. 2012 Aug 9;75(3):517-30.
doi: 10.1016/j.neuron.2012.05.028.

Neuronal correlates of metacognition in primate frontal cortex

Affiliations

Neuronal correlates of metacognition in primate frontal cortex

Paul G Middlebrooks et al. Neuron. .

Abstract

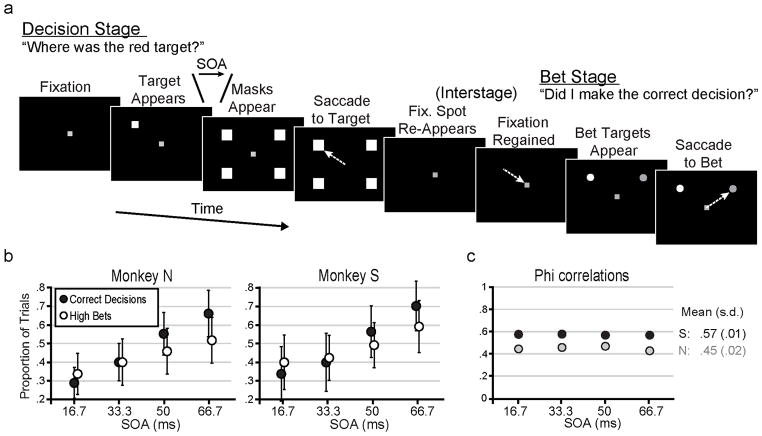
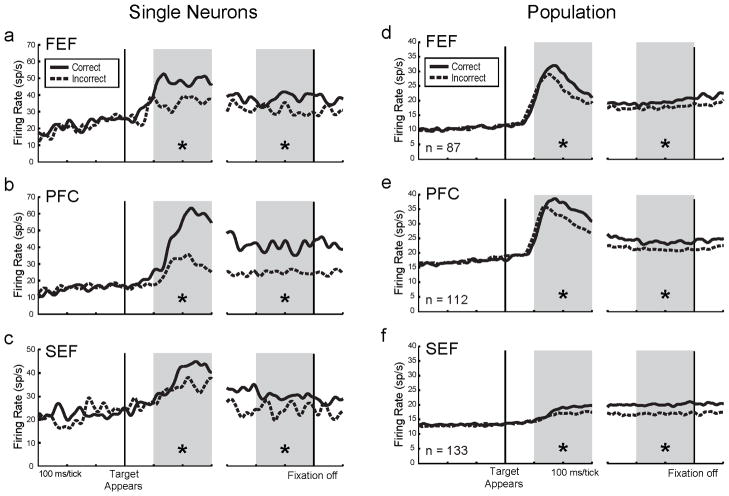
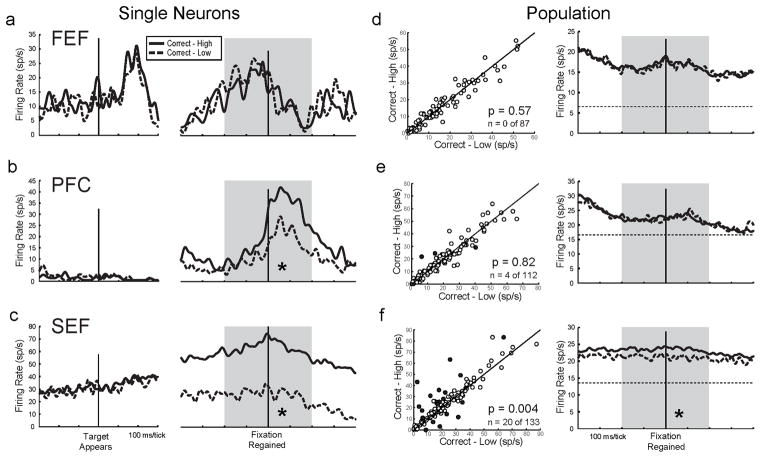
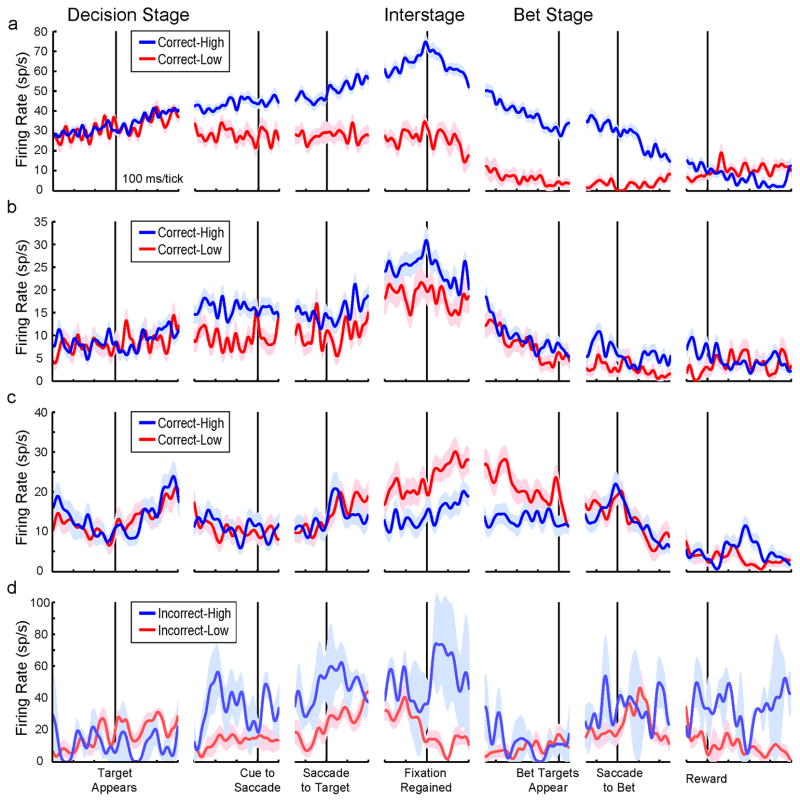
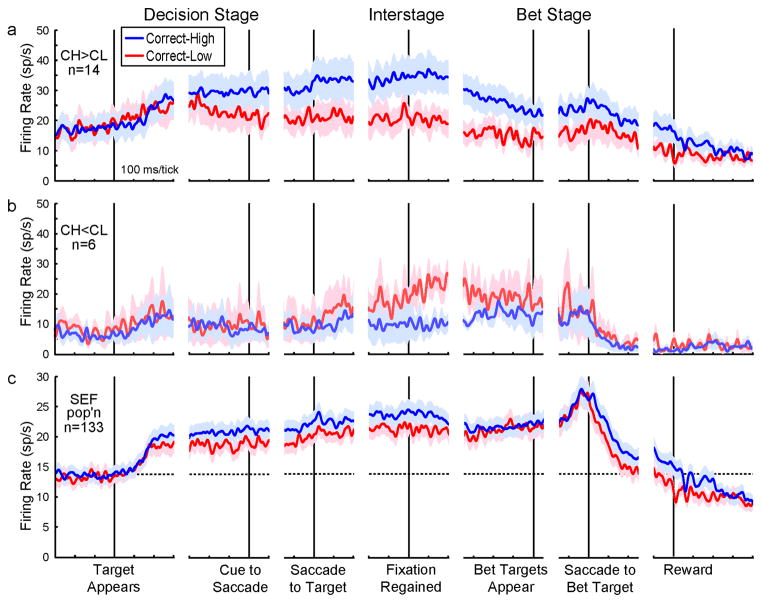
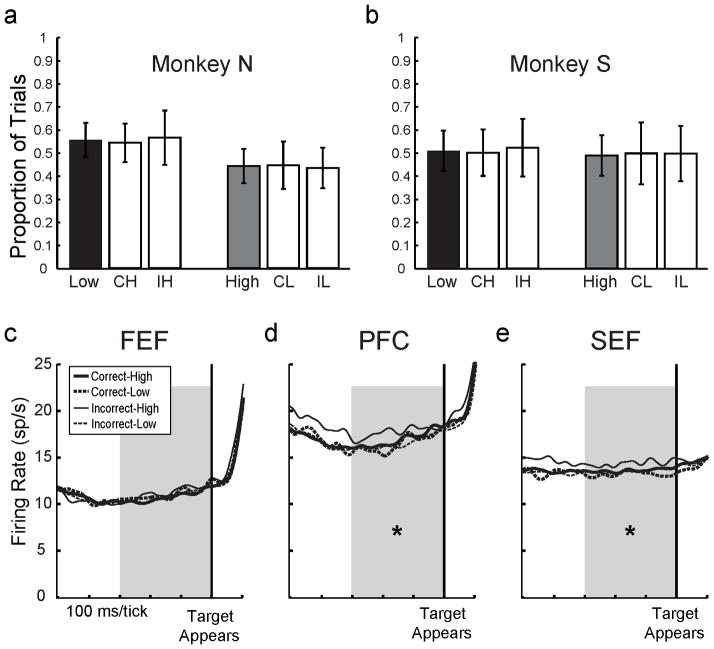
Humans are metacognitive: they monitor and control their cognition. Our hypothesis was that neuronal correlates of metacognition reside in the same brain areas responsible for cognition, including frontal cortex. Recent work demonstrated that nonhuman primates are capable of metacognition, so we recorded from single neurons in the frontal eye field, dorsolateral prefrontal cortex, and supplementary eye field of monkeys (Macaca mulatta) that performed a metacognitive visual-oculomotor task. The animals made a decision and reported it with a saccade, but received no immediate reward or feedback. Instead, they had to monitor their decision and bet whether it was correct. Activity was correlated with decisions and bets in all three brain areas, but putative metacognitive activity that linked decisions to appropriate bets occurred exclusively in the SEF. Our results offer a survey of neuronal correlates of metacognition and implicate the SEF in linking cognitive functions over short periods of time.


Figures

Figure 1
Figure 1
Task and behavior. (a) Each trial consisted of a Decision Stage and a Bet Stage, separated by an interstage period. In the Decision Stage, monkeys foveated a fixation spot, a target appeared at one of four locations, and after a variable stimulus onset asynchrony (SOA), masks appeared at the four locations. A correct decision (shown) was made if a saccade (arrow) went to the target location. A saccade to any other location was an incorrect decision (not shown). During the interstage period, the fixation spot re-appeared and monkeys foveated it to initiate the Bet Stage. Two bet targets appeared and monkeys placed their bet by making a saccade to one of them. They received the outcome of the bet (reward or timeout) to end the trial. (b) Overall proportion of correct decisions (black circles) and high bets (white circles) made by each monkey as a function of SOA. Error bars represent standard deviations (s.d.). (c) Overall phi correlations (Kornell et al., 2007) for Monkeys N (grey) and S (black) as a function of SOA. Mean and s.d. across SOAs are shown to the right. See also Figure S1.
Figure 2
Figure 2
Decision-related neuronal activity. Within each panel, neuronal firing rates for all correct trials (solid lines) and incorrect trials (dashed lines) are aligned to Decision Stage target onset (left) and fixation spot offset (right), and grey shadings indicate visual-1 (left) and delay epochs (right). Asterisks indicate a significant difference in activity (p < .05) within the epoch. (a–c) Single neuron examples. Each neuron was more active during correct than incorrect trials in both epochs. (d–f) Population activity. In all three areas, activity was greater for correct than for incorrect trials in both epochs (Table 1 shows corresponding numerical data). Population spike density functions are the average of all individual neuron spike density functions from each area. See also Figure S2.
Figure 3
Figure 3
Metacognition-related activity. For the single neuron examples (a–c), firing rates for all Correct-High (CH) trials (solid lines) and Correct-Low (CL) trials (dashed lines) are aligned to Decision Stage target onset (left) and on regaining fixation to begin the Bet Stage (right). Grey shading indicates the interstage epoch. For the population data (d–f), scatterplots (left) show CH vs. CL firing rates for each neuron during the interstage epoch, p values of t-tests of population CH vs. CL activity, and numbers (n) of individual neurons with significant CH vs. CL activity (each denoted with a filled dot). Activity profiles (right) show population spike density functions, with baseline activity levels (dashed horizontal lines) provided for reference. Asterisks indicate significant differences within the interstage epoch (p < .05 for single neurons and < .025 for population data). The FEF neuron (a) was not significantly different between trial types (post-ANOVA t-test, p > .05), but the PFC neuron (b) and SEF neuron (c) had significantly greater activity in CH than in CL trials (both p < .001). (d) In the FEF, single neurons (left) and population profiles (right) showed no significant differences in activity between CH and CL trials. (e) In the PFC, a few single neurons showed CH vs. CL differences (left), but this was not significant at the population level, and population profiles overlapped (right). (f) In the SEF, many individual neurons showed CH vs. CL differences (left), this was significant at the population level, and population profiles were higher for CH than CL trials throughout the interstage epoch (right). Table 2, Interstage column, shows corresponding numerical data. See also Figure S3.
Figure 4
Figure 4
Time courses of example SEF neurons. Activity profiles depict means (lines) and SEMs (shading) and are aligned to events indicated at bottom. (a and b) Two example neurons for which Correct-High (CH) activity significantly exceeded Correct-Low (CL) activity during the interstage epoch. (b) Example neuron for which CL activity significantly exceeded CH activity during the interstage epoch. (d) Example neuron for which Incorrect-High (IH) activity significantly exceeded Incorrect-Low (IL) activity during the interstage epoch. Its noisy IH activity was typical, due to small numbers of trials (IH was the least likely trial outcome).
Figure 5
Figure 5
Time courses of SEF population activity. Conventions as in Figure 4. Average activity profiles are shown for (a) the 14 SEF neurons for which CH activity significantly exceeded CL activity during the interstage epoch, (b) the 6 SEF neurons for which CL activity significantly exceeded CH activity during the interstage epoch, and (c) the entire population of SEF neurons. In the population, SEF activity distinguished CH from CL trials ~200ms after target onset (“Target Appears”), and this differential activity was maintained through the interstage period (after “Fixation Regained” and before “Bet Targets Appear”). Table 2, bottom row, shows results of statistical analyses for this time range (Baseline through Interstage epochs). Population differential activity re-emerged after the saccade to the bet target. Only contralateral data are included here. Population baseline firing rate is shown with a horizontal dashed line. See also Figure S4.
Figure 6
Figure 6
Inter-trial effects. (a and b) Rate of placing bets as a function of previous trial outcome for each monkey. In each graph, the average low bet rate (black bar) is plotted next to low rates after previous CH and IH trials (white bars), and the average high bet rate (grey bar) is plotted next to high rates after previous CL and IL trials (white bars). Error bars are standard deviations. None of the “switch” rates were different from the respective average bet rates (paired t-tests, p > .05). (c–e) Neuronal activity during baseline period (shaded) as a function of previous trial outcome for the populations of FEF, PFC, and SEF neurons. Asterisks indicate whether IH activity was greater than all three of the other trial outcomes by paired t-tests (p < .05).

Comment in

References

    1. Anderson EB, Mitchell JF, Reynolds JH. Attentional modulation of firing rate varies with burstiness across putative pyramidal neurons in macaque visual area V4. J Neurosci. 2011;31:10983–10992. - PMC - PubMed
    1. Barraclough DJ, Conroy ML, Lee D. Prefrontal cortex and decision making in a mixed-strategy game. Nat Neurosci. 2004;7:404–410. - PubMed
    1. Boch RA, Goldberg ME. Participation of prefrontal neurons in the preparation of visually guided eye movements in the rhesus monkey. J Neurophysiol. 1989;61:1064–1084. - PubMed
    1. Bruce CJ, Goldberg ME. Primate frontal eye fields. I. Single neurons discharging before saccades. J Neurophysiol. 1985;53:603–635. - PubMed
    1. Call J. Do apes know that they could be wrong? Anim Cogn. 2010;13:689–700. - PubMed

Publication types

LinkOut - more resources