Review
. 2013 Jun;17(3):215-25.
doi: 10.1016/j.smrv.2012.06.007. Epub 2012 Aug 9.

Deconstructing and reconstructing cognitive performance in sleep deprivation

Affiliations
Review

Deconstructing and reconstructing cognitive performance in sleep deprivation

Melinda L Jackson et al. Sleep Med Rev. 2013 Jun.

Abstract

Mitigation of cognitive impairment due to sleep deprivation in operational settings is critical for safety and productivity. Achievements in this area are hampered by limited knowledge about the effects of sleep loss on actual job tasks. Sleep deprivation has different effects on different cognitive performance tasks, but the mechanisms behind this task-specificity are poorly understood. In this context it is important to recognize that cognitive performance is not a unitary process, but involves a number of component processes. There is emerging evidence that these component processes are differentially affected by sleep loss. Experiments have been conducted to decompose sleep-deprived performance into underlying cognitive processes using cognitive-behavioral, neuroimaging and cognitive modeling techniques. Furthermore, computational modeling in cognitive architectures has been employed to simulate sleep-deprived cognitive performance on the basis of the constituent cognitive processes. These efforts are beginning to enable quantitative prediction of the effects of sleep deprivation across different task contexts. This paper reviews a rapidly evolving area of research, and outlines a theoretical framework in which the effects of sleep loss on cognition may be understood from the deficits in the underlying neurobiology to the applied consequences in real-world job tasks.


Figures

Figure 1
Figure 1
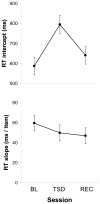
Performance degradation on a modified Sternberg working memory task during sleep deprivation. The top panel shows the intercept of the linear relationship between memory set size and response time (RT), which measures overall cognitive performance with the exception of the working memory scanning efficiency component. The bottom panel shows the slope of this relationship, which isolates the working memory scanning efficiency component of performance on the task. Means ± standard errors are shown for twelve healthy adults tested in a laboratory during a baseline session (BL), after 51 hours of total sleep deprivation (TSD), and following two nights of recovery sleep (REC), at fixed time of day (11:00). The results show that performance on the Sternberg task was adversely affected by sleep deprivation, but this was not attributable to impairment of working memory scanning efficiency. Figure adapted from Tucker et al. with permission.
Figure 2
Figure 2
The diffusion model for two-choice decision-making tasks. The figure shows three sample paths of evidence accumulation following stimulus presentation. These reach the criterion threshold for a correct decision (“A”) or error (“B”) with different drift rates (v), representing varying ability to effectively extract information from the stimulus. This illustrates variability within the decision process, leading to probability distributions for correct and error response time (RT). The mathematical equations of the diffusion model disentangle evidence accumulation (drift rate) from the criteria triggering the decision, and from non-decision processes such as information encoding and response execution. Figure adapted from Ratcliff and Van Dongen with permission.
Figure 3
Figure 3
Representation of the ACT-R cognitive architecture, showing central cognition and some of the other components of cognition implemented in the system. Modules are shown in large font, with associated information buffers adjacent in smaller font. The external task environment is represented with black boxes and white text. The effects of sleep loss are implemented as changes to the parameters of the underlying mechanisms (see gray boxes), reducing the efficiency and the effectiveness of the information processing system. In the research discussed in the main text, we focus specifically on changes to the parameters associated with central cognition.
Figure 4
Figure 4
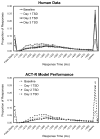
PVT performance as observed in an experiment and as predicted with computational modeling. The top panel shows response time distributions, aggregated over thirteen healthy human subjects, observed during 10-minute PVT sessions performed at baseline and across three days of total sleep deprivation (TSD) in a laboratory. The data are represented as proportions of responses falling into discrete response time categories. The first (left-most) point in each graph represents the proportion of false starts (i.e., responses made before the stimulus was presented or within 150 milliseconds of stimulus onset). The next set of points captures responses between 150 and 500 milliseconds after stimulus onset – aggregated into 10 millisecond bins – which are considered to be alert responses. The second-to-last point represents the proportion of responses greater than 500 milliseconds, which by convention are called “lapses”. The last (right-most) point (not labeled) shows non-responses, which are trials when no response was made within 30,000 milliseconds of stimulus onset (time-outs). Note the shift to the right of the response time distribution that occurred as a consequence of sleep deprivation, which is indicative of increasing state instability. The bottom panel shows ACT-R model predictions of the response time distributions as a function of increasing amounts of sleep deprivation. The model predictions are based upon simulating human performance in the task – actual aggregations of response times for individual trials over 100 simulated 10-minute task sessions. Note the high degree of correspondence between the human observations in the top panel and the computational predictions in the bottom panel. Figure adapted from Gunzelmann et al. with permission.
Figure 5
Figure 5
Predicted probability of lane violations as a function of driving speed and duration of wakefulness. The figure shows the average percentage of time that a portion of a motor vehicle is outside its lane boundary during a 10-minute driving scenario, simulated with our ACT-R model for three different speeds and four different times awake. The ACT-R model’s knowledge and all model parameters were held identical to those in the published model for all simulations. The only difference was the speed at which the model drove. Because the model generates data by interacting with the simulated driving environment, its performance predictions vary in accordance with the driving context.
Figure 6
Figure 6
Simplified representation of a theory on mechanisms of local, use-dependent sleep initiation underlying task-specific cognitive impairment during sleep deprivation. (a) Information processing in neuronal assemblies (such as a cortical columns) triggers a metabolic, biochemical cascade that promotes the local sleep state (medium gray schematic). When the neuronal assembly is in the wake state and stimulated by input stemming from the cognitive task at hand, it responds with synaptic transmission to process the input signal and generate corresponding output. This triggers release of adenosine triphosphate (ATP) into the extracellular space and increases local metabolic activity. Rapid breakdown of extracellular ATP results in accumulation of adenosine. Binding of adenosine at purine type 1 receptors (adenosine receptors) promotes the neuronal assembly sleep state, during which there is hyperpolarization (changing the evoked potential triggered by the input stimulus) and synaptic transmission is fundamentally altered. This effectively removes the assembly from the coordinated response of the neuronal assemblies involved in the task at hand, resulting in a lapse of information processing. Thus, the local sleep state causes output variability which, at the behavioral level, leads to task-specific performance instability. (b) ATP induces release of sleep regulatory substances (SRSs) such as tumor necrosis factor (TNF) and interleukin-1 (IL1) through binding at purine type 2 receptors (dark gray schematic). Continued stimulation of the neuronal assembly causes these SRSs to accumulate and effect an increase in the density of post-synaptic receptors binding adenosine, thereby use-dependently increasing the probability of entering the sleep state. The SRSs also promote the neuronal assembly sleep state through activation of GABAergic inhibitory neurons. The GABAergic neurons inhibit glutamatergic excitatory neurons, which prevents these latter neurons from promoting the local wake state. The SRSs together with metabolic products such as adenosine also influence regional blood flow and thereby oxygen and metabolic nutrient supply. (c) Subcortical sleep regulatory circuits coordination and consolidation sleep/wake states across the whole brain, as influenced by the collective neuronal assembly states integrated across the brain through mechanisms involving the SRSs (light gray schematic). Key subcortical sleep regulatory circuits include the ventrolateral preoptic nucleus (VLPO), which can shut down the wake-promoting (e.g., glutamatergic) neurons of the reticular activating system and other systems such as the cholinergic networks of the basal forebrain; orexinergic (hypocretinergic) neurons, through which it has been suggested that compensatory effort to stay awake prevents whole-brain sleep by inhibition of the VLPO; and the circadian pacemaker in the suprachiasmatic nuclei of the hypothalamus, which drives circadian rhythms in background metabolic activity. Whole-brain induction of sleep by the VLPO allows SRS concentrations and receptor densities to be restored, and prevents behavioral interaction with the environment when too many neuronal assemblies are in the local sleep state. Figure adapted from Van Dongen et al. with permission.

References

    1. Pilcher JJ, Huffcutt AJ. Effects of sleep deprivation on performance: a meta-analysis. Sleep. 1996;19:318–26. - PubMed
    1. Balkin T, Bliese P, Belenky G, Sing H, Thorne D, Thomas M, et al. Comparative utility of instruments for monitoring sleepiness-related performance decrements in the operational environment. J Sleep Res. 2004;13:219–27. - PubMed
    1. Lim J, Dinges DF. A meta-analysis of the impact of short-term sleep deprivation on cognitive variables. Psychol Bull. 2010;136:375–89. - PMC - PubMed
    1. Jackson ML, Van Dongen HPA. Cognitive effects of sleepiness. In: Thorpy MJ, Billiard M, editors. Sleepiness. Cambridge, UK: Cambridge University Press; 2011. pp. 72–81.
    1. Dinges DF. An overview of sleepiness and accidents. J Sleep Res. 1995;4(Suppl 2):4–14. - PubMed

Publication types

MeSH terms

LinkOut - more resources