

Shaping of object representations in the human medial temporal lobe based on temporal regularities
- PMID: 22885059
- PMCID: PMC3443305
- DOI: 10.1016/j.cub.2012.06.056
Shaping of object representations in the human medial temporal lobe based on temporal regularities
Abstract
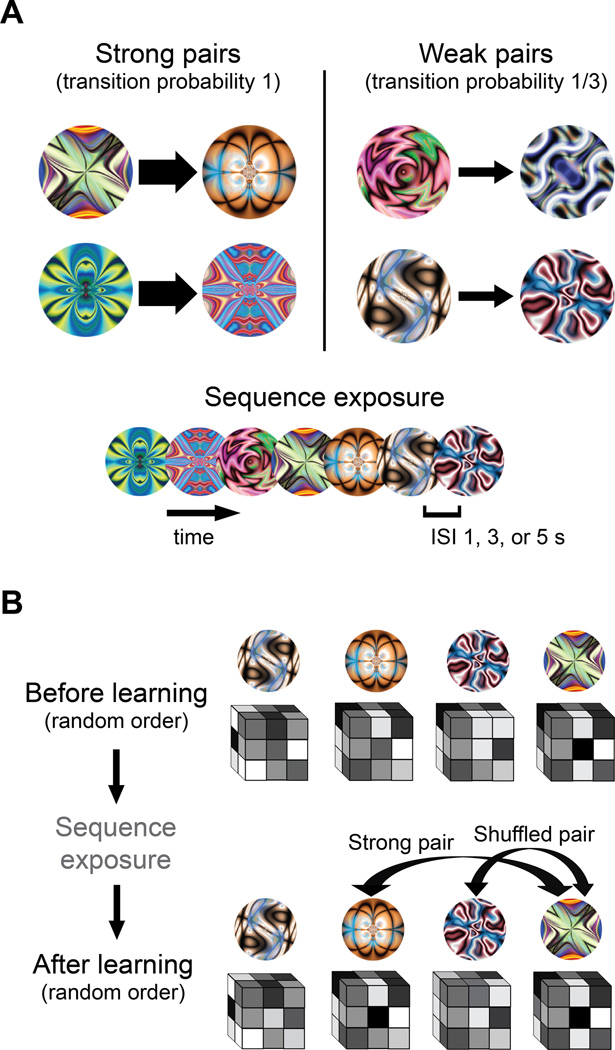
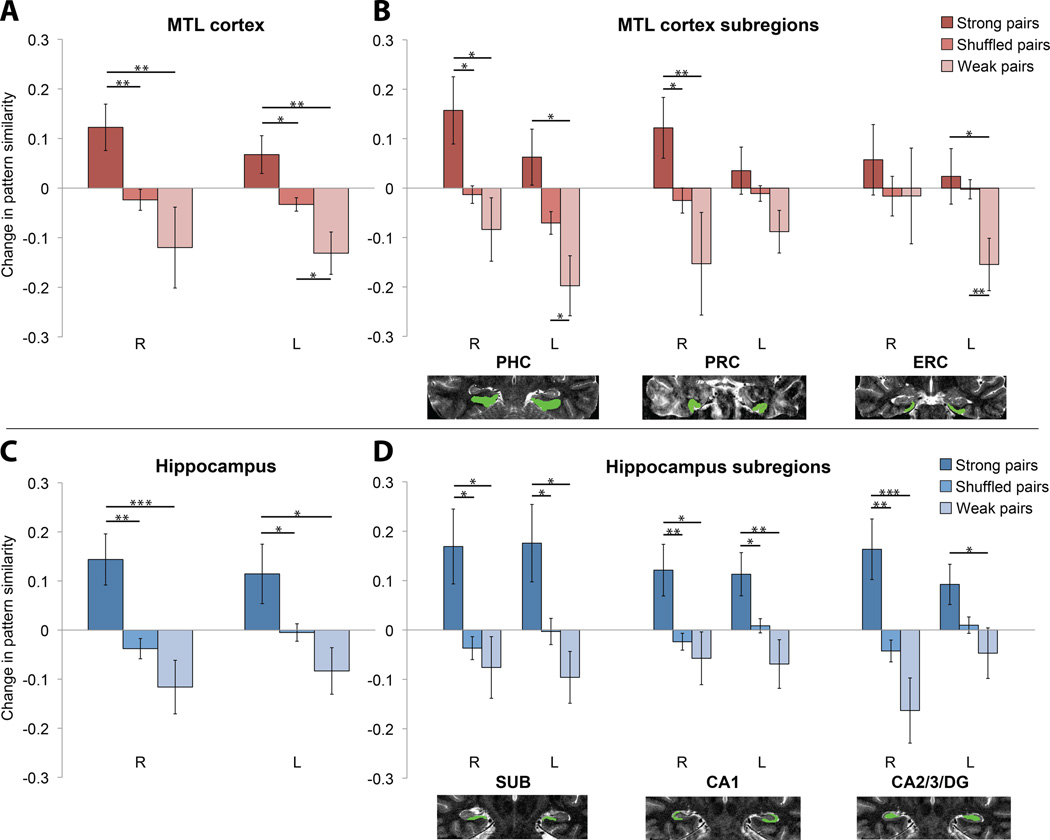
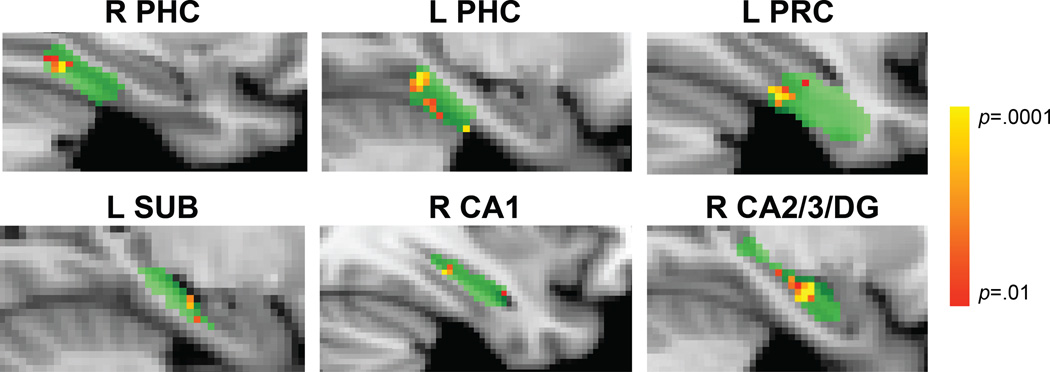
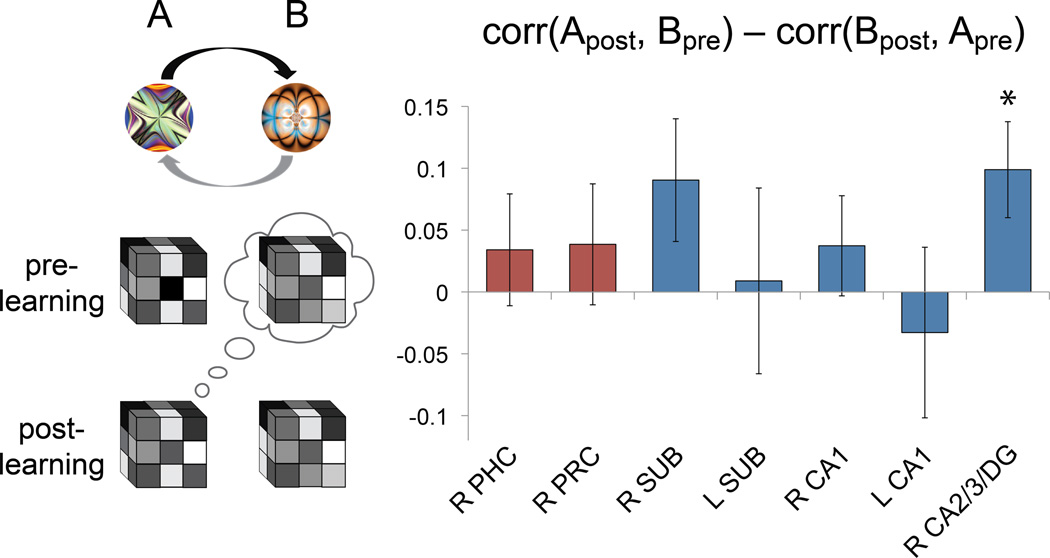
Regularities are gradually represented in cortex after extensive experience, and yet they can influence behavior after minimal exposure. What kind of representations support such rapid statistical learning? The medial temporal lobe (MTL) can represent information from even a single experience, making it a good candidate system for assisting in initial learning about regularities. We combined anatomical segmentation of the MTL, high-resolution fMRI, and multivariate pattern analysis to identify representations of objects in cortical and hippocampal areas of human MTL, assessing how these representations were shaped by exposure to regularities. Subjects viewed a continuous visual stream containing hidden temporal relationships--pairs of objects that reliably appeared nearby in time. We compared the pattern of blood oxygen level-dependent activity evoked by each object before and after this exposure, and found that perirhinal cortex, parahippocampal cortex, subiculum, CA1, and CA2/CA3/dentate gyrus (CA2/3/DG) encoded regularities by increasing the representational similarity of their constituent objects. Most regions exhibited bidirectional associative shaping, whereas CA2/3/DG represented regularities in a forward-looking predictive manner. These findings suggest that object representations in MTL come to mirror the temporal structure of the environment, supporting rapid and incidental statistical learning.
Copyright © 2012 Elsevier Ltd. All rights reserved.
Figures
Similar articles
-
Animacy and real-world size shape object representations in the human medial temporal lobes.Hum Brain Mapp. 2018 Sep;39(9):3779-3792. doi: 10.1002/hbm.24212. Epub 2018 Jun 26. Hum Brain Mapp. 2018. PMID: 29947037 Free PMC article.
-
Global similarity and pattern separation in the human medial temporal lobe predict subsequent memory.J Neurosci. 2013 Mar 27;33(13):5466-74. doi: 10.1523/JNEUROSCI.4293-12.2013. J Neurosci. 2013. PMID: 23536062 Free PMC article.
-
A protocol for manual segmentation of medial temporal lobe subregions in 7 Tesla MRI.Neuroimage Clin. 2017 May 26;15:466-482. doi: 10.1016/j.nicl.2017.05.022. eCollection 2017. Neuroimage Clin. 2017. PMID: 28652965 Free PMC article.
-
The anatomy and function of the postrhinal cortex.Behav Neurosci. 2022 Apr;136(2):101-113. doi: 10.1037/bne0000500. Epub 2021 Dec 16. Behav Neurosci. 2022. PMID: 34914422 Free PMC article. Review.
-
Reunification of Object and View-Center Background Information in the Primate Medial Temporal Lobe.Front Behav Neurosci. 2021 Dec 6;15:756801. doi: 10.3389/fnbeh.2021.756801. eCollection 2021. Front Behav Neurosci. 2021. PMID: 34938164 Free PMC article. Review.
Cited by
-
Model-based choices involve prospective neural activity.Nat Neurosci. 2015 May;18(5):767-72. doi: 10.1038/nn.3981. Epub 2015 Mar 23. Nat Neurosci. 2015. PMID: 25799041 Free PMC article.
-
Reward Learning over Weeks Versus Minutes Increases the Neural Representation of Value in the Human Brain.J Neurosci. 2018 Aug 29;38(35):7649-7666. doi: 10.1523/JNEUROSCI.0075-18.2018. Epub 2018 Jul 30. J Neurosci. 2018. PMID: 30061189 Free PMC article.
-
Mapping sequence structure in the human lateral entorhinal cortex.Elife. 2019 Aug 6;8:e45333. doi: 10.7554/eLife.45333. Elife. 2019. PMID: 31383256 Free PMC article.
-
Understanding the Neural Bases of Implicit and Statistical Learning.Top Cogn Sci. 2019 Jul;11(3):482-503. doi: 10.1111/tops.12420. Epub 2019 Apr 3. Top Cogn Sci. 2019. PMID: 30942536 Free PMC article. Review.
-
Hippocampal representations switch from errors to predictions during acquisition of predictive associations.Nat Commun. 2022 Jun 8;13(1):3294. doi: 10.1038/s41467-022-31040-w. Nat Commun. 2022. PMID: 35676285 Free PMC article.
References
-
- Gilbert CD, Sigman M, Crist RE. The neural basis of perceptual learning. Neuron. 2001;31:681–697. - PubMed
-
- Saffran JR, Newport EL, Aslin RN. Word segmentation: the role of distributional cues. J Mem Lang. 1996;35:606–621.
-
- McClelland JL, McNaughton BL, O'Reilly RC. Why there are complementary learning systems in the hippocampus and neocortex: insights from the successes and failures of connectionist models of learning and memory. Psychol Rev. 1995;102:419–457. - PubMed
-
- Miyashita Y. Neuronal correlate of visual associative long-term memory in the primate temporal cortex. Nature. 1988;335:817–820. - PubMed
Publication types
MeSH terms
Substances
Grants and funding
LinkOut - more resources
Full Text Sources
Medical
Miscellaneous
