. 2012 Oct 9;22(19):1755-64.
doi: 10.1016/j.cub.2012.07.042. Epub 2012 Aug 9.

Genome-wide and caste-specific DNA methylomes of the ants Camponotus floridanus and Harpegnathos saltator

Affiliations

Genome-wide and caste-specific DNA methylomes of the ants Camponotus floridanus and Harpegnathos saltator

Roberto Bonasio et al. Curr Biol. .

Abstract

Background: Ant societies comprise individuals belonging to different castes characterized by specialized morphologies and behaviors. Because ant embryos can follow different developmental trajectories, epigenetic mechanisms must play a role in caste determination. Ants have a full set of DNA methyltransferases and their genomes contain methylcytosine. To determine the relationship between DNA methylation and phenotypic plasticity in ants, we obtained and compared the genome-wide methylomes of different castes and developmental stages of Camponotus floridanus and Harpegnathos saltator.

Results: In the ant genomes, methylcytosines are found both in symmetric CG dinucleotides (CpG) and non-CpG contexts and are strongly enriched at exons of active genes. Changes in exonic DNA methylation correlate with alternative splicing events such as exon skipping and alternative splice site selection. Several genes exhibit caste-specific and developmental changes in DNA methylation that are conserved between the two species, including genes involved in reproduction, telomere maintenance, and noncoding RNA metabolism. Several loci are methylated and expressed monoallelically, and in some cases, the choice of methylated allele depends on the caste.

Conclusions: These first ant methylomes and their intra- and interspecies comparison reveal an exonic methylation pattern that points to a connection between DNA methylation and splicing. The presence of monoallelic DNA methylation and the methylation of non-CpG sites in all samples suggest roles in genome regulation in these social insects, including the intriguing possibility of parental or caste-specific genomic imprinting.


Figures

Figure 1
Figure 1
CpG and non-CpG methylation in the ant genome. A) Total number of mCGs (black), mCHGs (grey), and mCHHs (white) in the indicated sample from both ant species. B–C) Validation of CH methylation in adult individuals. Bars represent single, contiguous cytosines in the indicated locus. The fraction of clones (above the x axis) or Illumina reads (below the x axis) that support methylation is plotted on the y axis. Numbers indicate the total number of clones analyzed (top) or Illumina reads mapped to the site (below). Asterisks indicate sites that were determined to be mCs by BS-seq at an FDR-adjusted P-value < 0.01. D–E) Sequence context of CH methylation; the first and second base after the methylated cytosine are indicated by numbers.
Figure 2
Figure 2
Distribution of mCGs on coding and non-coding regions. A) The methylation level for each indicated genomic feature is plotted on the y axis. Values were calculated separately for each caste and developmental stage and the averages + s.e.m. are shown (N = 7). B) Methylation profile of genome regions with high GC content (>55%) and high CpG O/E (> 0.65). C) The average methylation level of CG sites along the body of all complete protein coding genes is plotted on the y axis for the indicated castes and developmental stages of Camponotus. Genes were divided in 20 bins and the methylation level was calculated for each bin of each gene and the average for all genes is shown. D) Methylation profile over the average gene body in Camponotus. Exons and introns are shown separately, as well as 5′ and 3′ UTR (thinner boxes).
Figure 3
Figure 3
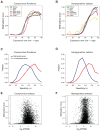
Gene body methylation and gene expression. A–B) Genes were binned from 0 (least expressed) to 100 (most expressed), their expression rank plotted on the x axis and their methylation level plotted on the y axis. C–D) Specificity index (see text for details) for methylated and unmethylated genes. E–F) Scatter plot for methylation level versus RNA levels (log-transformed read per kilobase per million). Each point is an individual gene.
Figure 4
Figure 4
Differentially methylated genes. A) An example of a differentially methylated gene in Camponotus, where the differentially methylated region is very limited and coincides with the position of an alternative splicing event (thinner red box). The number of high-confidence junction reads from major worker RNA-seq is indicated in the gene model. B) An example of a differentially methylated gene in Harpegnathos, which shows an extended region hypermethylated in gamergates, where the gene is expressed at higher level. In both panels, green boxes indicate annotated exons; pA RNA tracks indicate normalized RNA-seq signal by intensity of the black coloring; mC tracks show methylated cytosines as vertical lines and their degree of methylation is indicated by the intensity of black coloring (black, all reads methylated; white, all reads unmethylated). C) Heatmap for the total number of differentially methylated genes containing at least one 200 bp region with ≥ 2-fold difference in methylation levels in each pairwise comparison in Camponotus. D) Differentially methylated genes heat map for Harpegnathos.
Figure 5
Figure 5
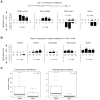
DNA methylation and alternative splicing in ants. A) The methylation level for randomly selected exons from the embryonic methylome of Camponotus (left) or Harpegnathos (right) was calculated for 10,000 simulations using randomly selected exons from comparably expressed genes and is shown as a bell-shaped curve. The average value for skipped exons (SE) is indicated by the arrow. B) Methylation level of upstream (UE), affected (AE) and downstream (DE) exons in regions with alternative 5′ splice sites (A5SS) in Camponotus (Cf) and Harpegnathos (Hs) (white bars) compared to the methylation level of randomly selected exons (black bars). Bars show mean + s.e.m. *, P < 0.05. P-values higher than 0.05 but lower than 0.1 are indicated and were determined with a non-parametric Mann-Whitney test. C) Same as in B) but for alternative 3′ splice sites (A3SS).
Figure 6
Figure 6
Allele-specific methylation. A–B) Each bar represents a single CpG in the analyzed locus. The fraction of methylated reads belonging to an arbitrarily defined allele #1 is plotted above the x axis, and the fraction of methylated reads belonging to allele #2 is plotted below the x axis. The total number of informative reads covering each C on each allele is indicated above or below the bars. FDR-adjusted P-values for the null hypothesis (no alelle-specific methylation) were calculated with a simulation process repeated for 100,000 cycles. A) Camponotus gene Cflo_11155, the region affected by ASM is shaded in gray. B) Harpegnathos scaffold 2143, position 15373. C) Boxplots showing the relationship between alelle-specific methylation and allele-specific expression. The number of RNA-seq reads assigned to the hypermethylated allele (hyper) or the hypomethylated allele (hypo) is plotted on the y axis. P-values are from Wilcoxon signed-rank tests.

Comment in

References

    1. Hölldobler B, Wilson EO. The Ants. Cambridge, MA: Harvard University Press; 1990.
    1. Bonasio R, Tu S, Reinberg D. Molecular signals of epigenetic states. Science. 2010;330:612–616. - PMC - PubMed
    1. Bonasio R. Emerging topics in epigenetics: ants, brains, and noncoding RNAs. Ann N Y Acad Sci 2012 - PubMed
    1. Bonasio R, Zhang G, Ye C, Mutti NS, Fang X, Qin N, Donahue G, Yang P, Li Q, Li C, et al. Genomic comparison of the ants Camponotus floridanus and Harpegnathos saltator. Science. 2010;329:1068–1071. - PMC - PubMed
    1. Peeters C, Liebig J, Hölldobler B. Sexual reproduction by both queens and workers in the ponerine ant Harpegnathos saltator. Insectes Sociaux. 2000;47:325–332.

Publication types

Associated data