

Aggregation behavior of ibuprofen, cholic acid and dodecylphosphocholine micelles
- PMID: 22885171
- PMCID: PMC3478136
- DOI: 10.1016/j.bbamem.2012.07.029
Aggregation behavior of ibuprofen, cholic acid and dodecylphosphocholine micelles
Abstract
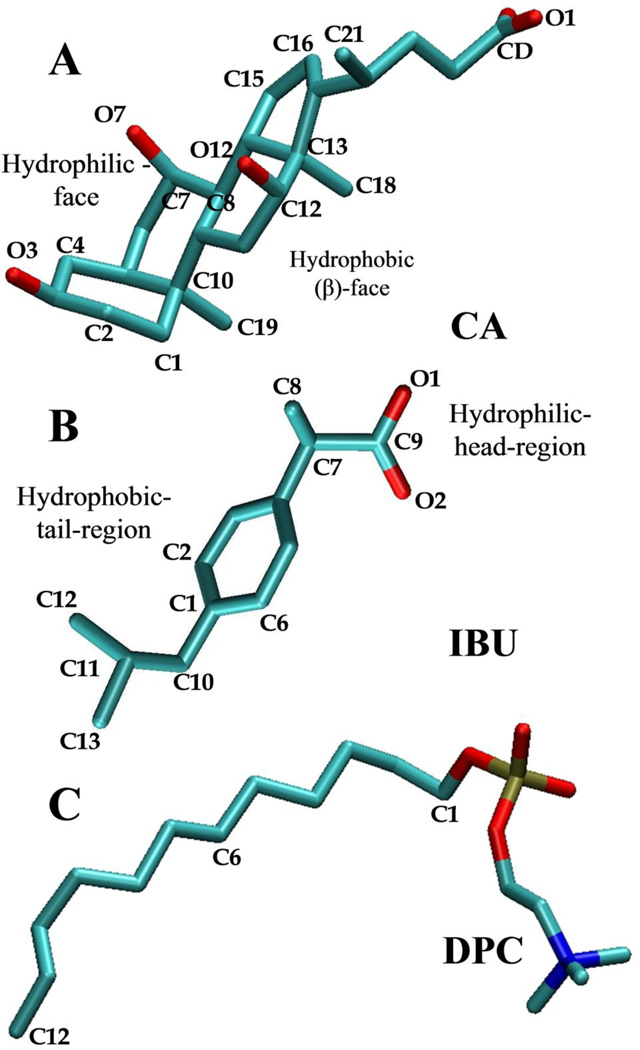
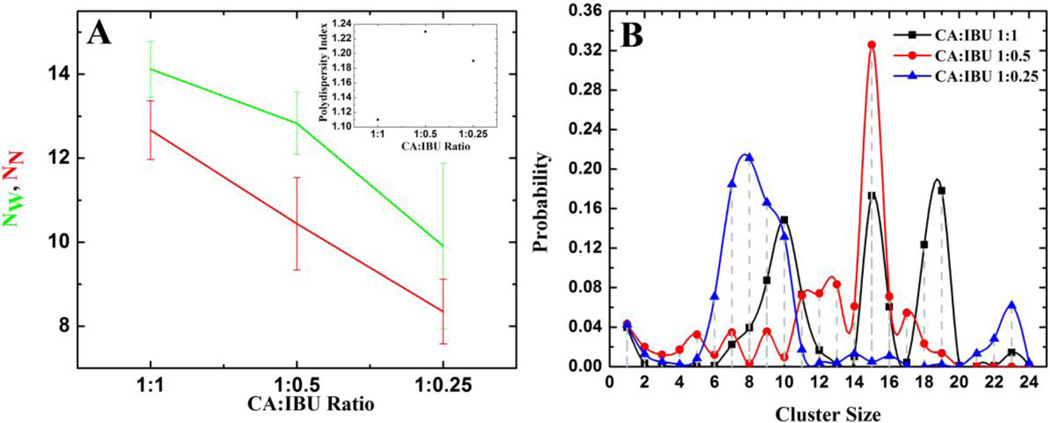
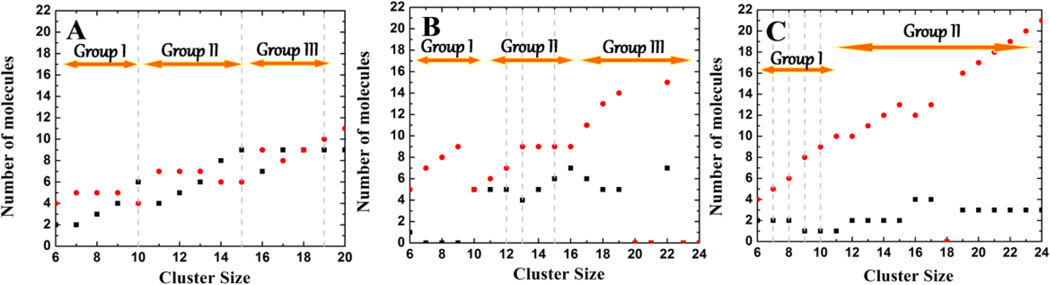
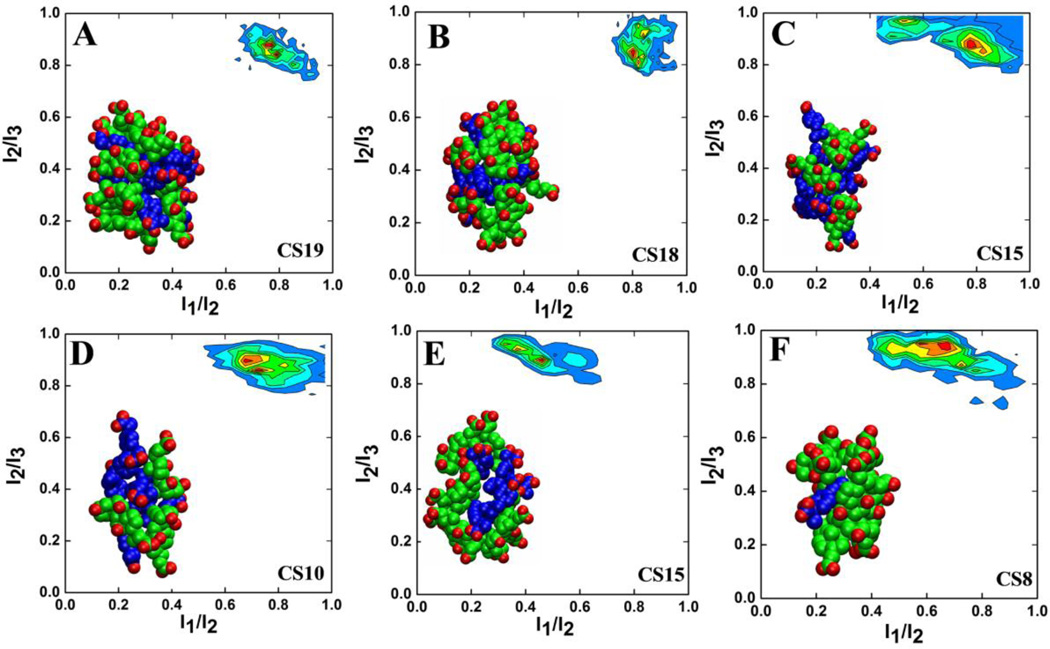
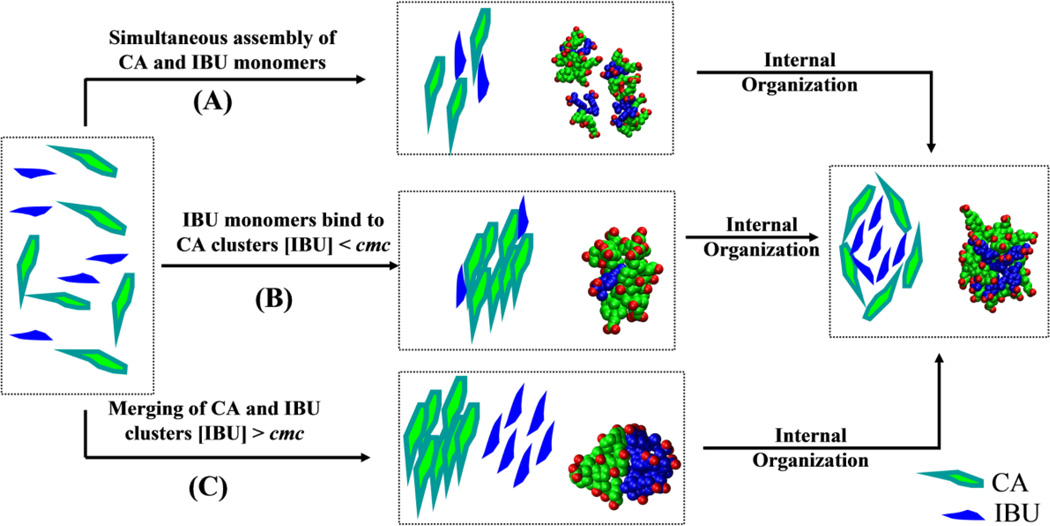
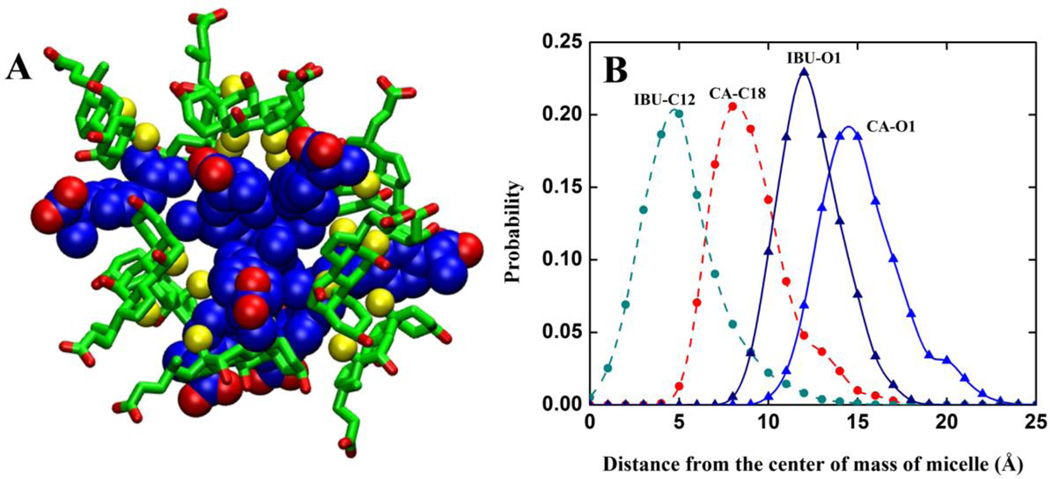
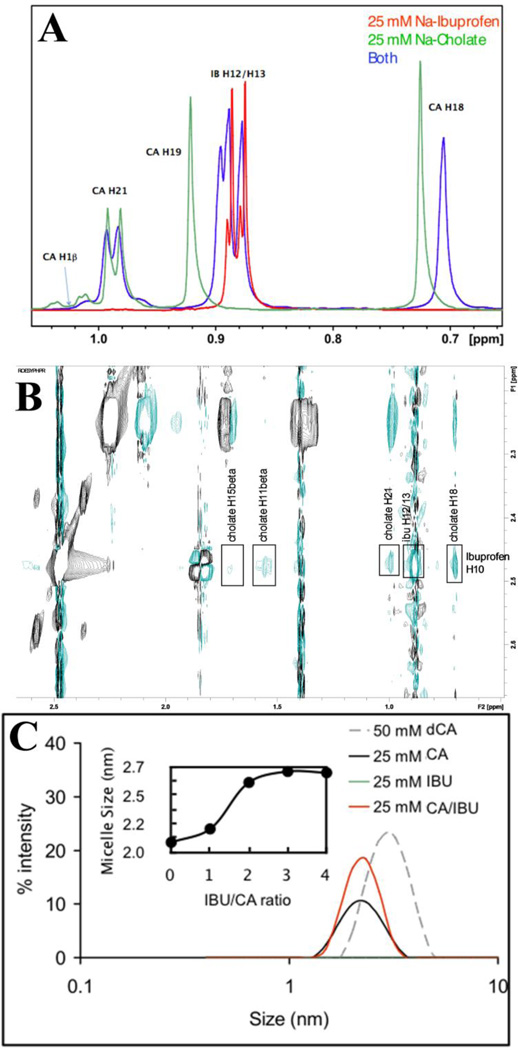
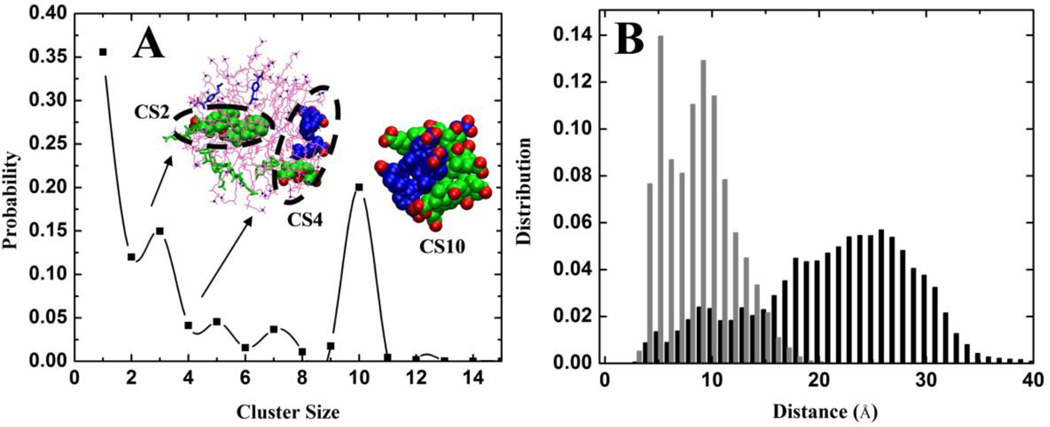
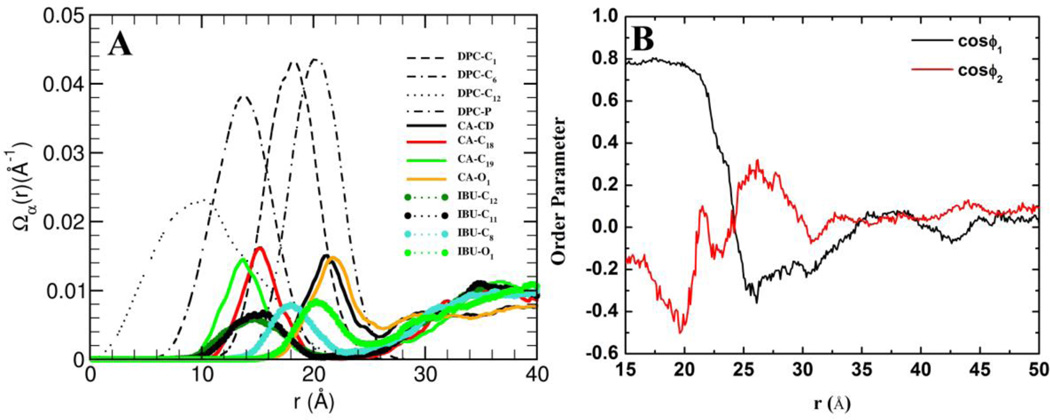
Non-steroidal anti-inflammatory drugs (NSAIDs) are frequently used to treat chronic pain and inflammation. However, prolonged use of NSAIDs has been known to result in Gastrointestinal (GI) ulceration/bleeding, with a bile-mediated mechanism underlying their toxicity to the lower gut. Bile acids (BAs) and phosphatidylcholines (PCs), the major components of bile, form mixed micelles to reduce the membrane disruptive actions of monomeric BAs and simple BA micelles. NSAIDs are suspected to alter the BA/PC balance in the bile, but the molecular interactions of NSAID-BA or NSAID-BA-PC remain undetermined. In this work, we used a series of all-atom molecular dynamics simulations of cholic acid (CA), ibuprofen (IBU) and dodecylphosphocholine (DPC) mixtures to study the spontaneous aggregation of CA and IBU as well as their adsorption on a DPC micelle. We found that the size of CA-IBU mixed micelles varies with their molar ratio in a non-linear manner, and that micelles of different sizes adopt similar shapes but differ in composition and internal interactions. These observations are supported by NMR chemical shift changes, NMR ROESY crosspeaks between IBU and CA, and dynamic light scattering experiments. Smaller CA-IBU aggregates were formed in the presence of a DPC micelle due to the segregation of CA and IBU away from each other by the DPC micelle. While the larger CA-IBU aggregates arising from higher IBU concentrations might be responsible for NSAID-induced intestinal toxicity, the absence of larger CA-IBU aggregates in the presence of DPC micelles may explain the observed attenuation of NSAID toxicity by PCs.
Copyright © 2012 Elsevier B.V. All rights reserved.
Figures
Similar articles
-
Structure and dynamics of cholic acid and dodecylphosphocholine-cholic acid aggregates.Langmuir. 2010 Aug 17;26(16):13407-14. doi: 10.1021/la102106t. Langmuir. 2010. PMID: 20695585 Free PMC article.
-
Phosphatidylcholine attenuates aggregation of nonsteroidal anti-inflammatory drugs with bile acid.Biochemistry. 2013 Oct 22;52(42):7461-9. doi: 10.1021/bi400723r. Epub 2013 Oct 10. Biochemistry. 2013. PMID: 24066846
-
Phosphatidylcholine-associated nonsteroidal anti-inflammatory drugs (NSAIDs) inhibit DNA synthesis and the growth of colon cancer cells in vitro.Cancer Chemother Pharmacol. 2006 Feb;57(3):295-300. doi: 10.1007/s00280-005-0048-x. Epub 2005 Jul 20. Cancer Chemother Pharmacol. 2006. PMID: 16032431
-
Preparation of well-defined ibuprofen prodrug micelles by RAFT polymerization.Biomacromolecules. 2013 Sep 9;14(9):3314-20. doi: 10.1021/bm4009149. Epub 2013 Aug 22. Biomacromolecules. 2013. PMID: 23937521
-
Toxicity of the Non-Steroidal Anti-Inflammatory Drugs (NSAIDs) acetylsalicylic acid, paracetamol, diclofenac, ibuprofen and naproxen towards freshwater invertebrates: A review.Sci Total Environ. 2020 Oct 20;740:140043. doi: 10.1016/j.scitotenv.2020.140043. Epub 2020 Jun 9. Sci Total Environ. 2020. PMID: 32559537 Review.
Cited by
-
Statistical investigation of simulated fed intestinal media composition on the equilibrium solubility of oral drugs.Eur J Pharm Sci. 2017 Mar 1;99:95-104. doi: 10.1016/j.ejps.2016.12.008. Epub 2016 Dec 7. Eur J Pharm Sci. 2017. PMID: 27940083 Free PMC article.
-
In vitro evidence that phosphatidylcholine protects against indomethacin/bile acid-induced injury to cells.Am J Physiol Gastrointest Liver Physiol. 2015 Feb 1;308(3):G217-22. doi: 10.1152/ajpgi.00322.2014. Epub 2014 Dec 4. Am J Physiol Gastrointest Liver Physiol. 2015. PMID: 25477376 Free PMC article.
-
Solubilization Behavior of Polyene Antibiotics in Nanomicellar System: Insights from Molecular Dynamics Simulation of the Amphotericin B and Nystatin Interactions with Polysorbate 80.Molecules. 2015 Dec 24;21(1):E6. doi: 10.3390/molecules21010006. Molecules. 2015. PMID: 26712721 Free PMC article.
-
RAS Nanoclusters Selectively Sort Distinct Lipid Headgroups and Acyl Chains.Front Mol Biosci. 2021 Jun 17;8:686338. doi: 10.3389/fmolb.2021.686338. eCollection 2021. Front Mol Biosci. 2021. PMID: 34222339 Free PMC article. Review.
-
Mixed-Probe Simulation and Probe-Derived Surface Topography Map Analysis for Ligand Binding Site Identification.J Chem Theory Comput. 2017 Apr 11;13(4):1851-1861. doi: 10.1021/acs.jctc.7b00130. Epub 2017 Mar 13. J Chem Theory Comput. 2017. PMID: 28252958 Free PMC article.
References
-
- Stix G. A malignant flame. Understanding chronic inflammation, which contributes to heart disease, Alzheimer's and a variety of other ailments, may be a key to unlocking the mysteries of cancer. Sci Am. 2007;297:8. - PubMed
-
- Singh G, Triadafilopoulos G. Epidemiology of NSAID induced gastrointestinal complications. J Rheumatol Suppl. 1999;56:18–24. - PubMed
-
- Cryer B, Kimmey MB. Gastrointestinal side effects of nonsteroidal anti-inflammatory drugs. Am J Med. 1998;105:20S–30S. - PubMed
-
- Barrios JM, Lichtenberger LM. Role of biliary phosphatidylcholine in bile acid protection and NSAID injury of the ileal mucosa in rats. Gastroenterology. 2000;118:1179–1186. - PubMed
-
- Lichtenberger LM. Where is the evidence that cyclooxygenase inhibition is the primary cause of nonsteroidal anti-inflammatory drug (NSAID)-induced gastrointestinal injury?: Topical injury revisited. Biochem Pharmacol. 2001;61:631–637. - PubMed
Publication types
MeSH terms
Substances
Grants and funding
LinkOut - more resources
Full Text Sources
