. 2012 Nov;78(21):7527-37.
doi: 10.1128/AEM.01459-12. Epub 2012 Aug 10.

Abiotic factors shape microbial diversity in Sonoran Desert soils

Affiliations

Abiotic factors shape microbial diversity in Sonoran Desert soils

David R Andrew et al. Appl Environ Microbiol. 2012 Nov.

Abstract

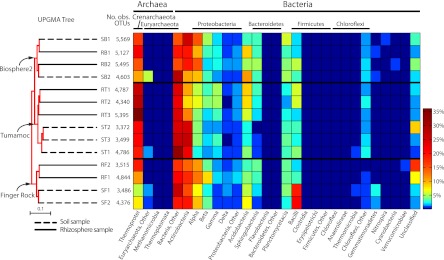
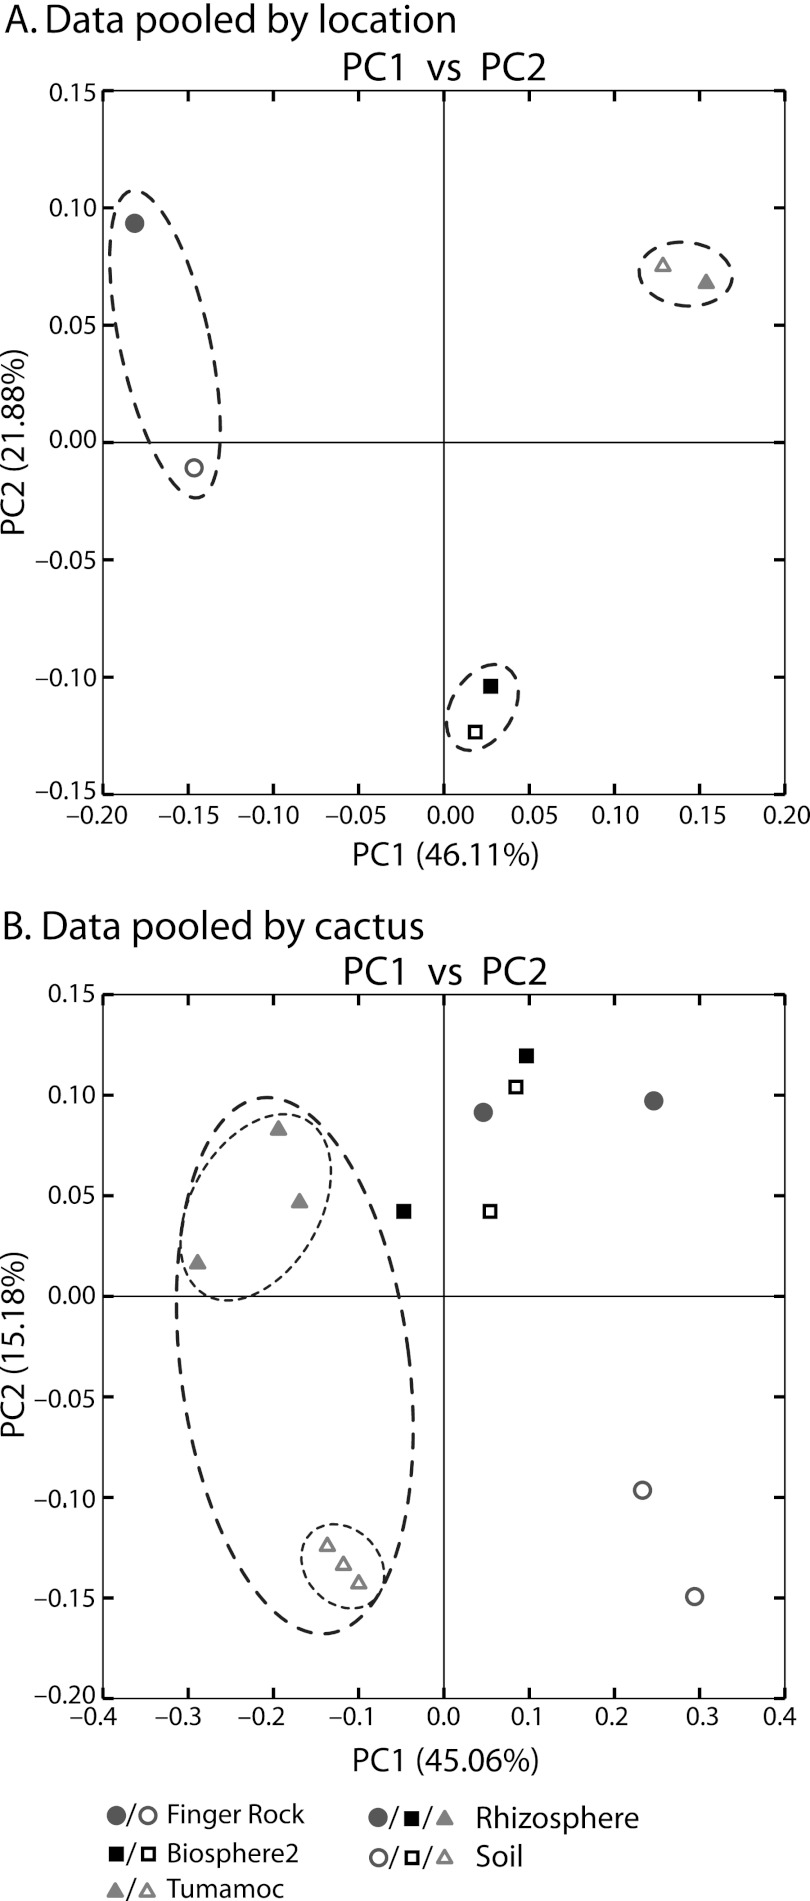
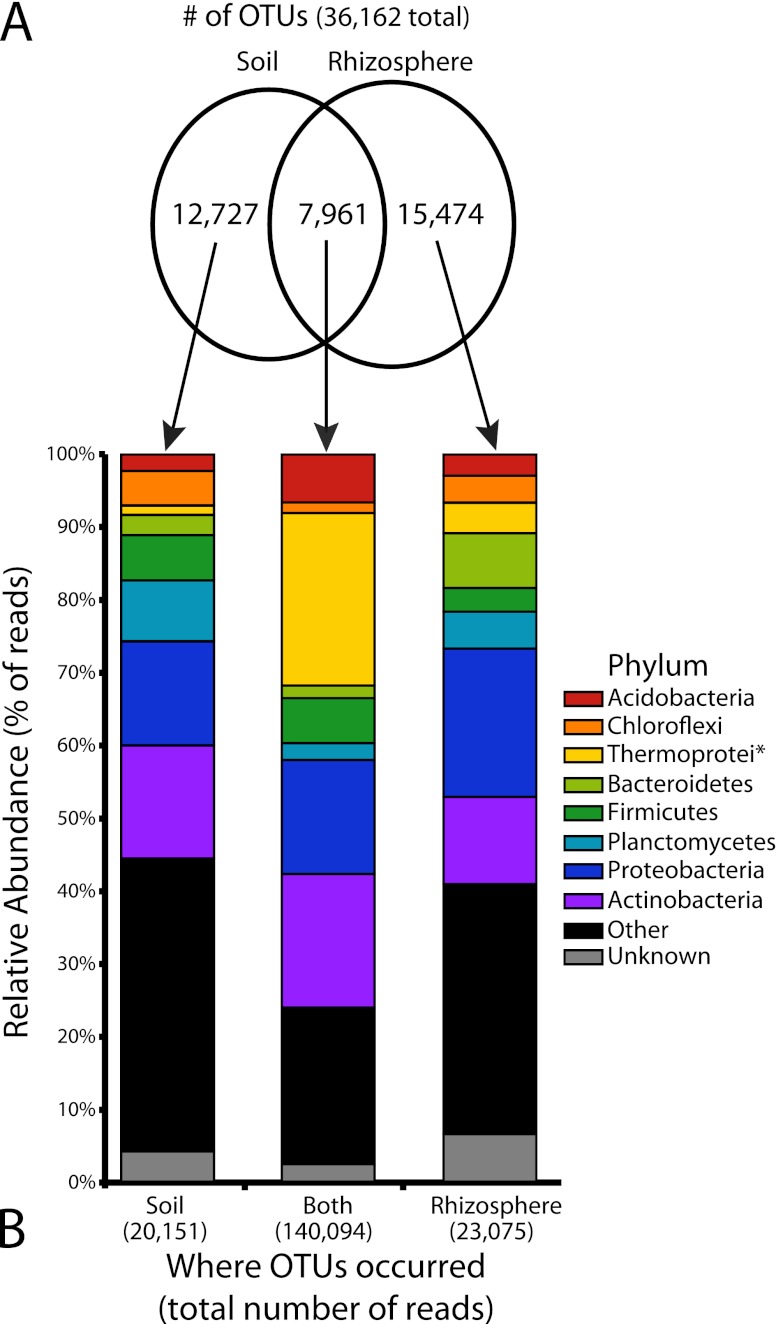
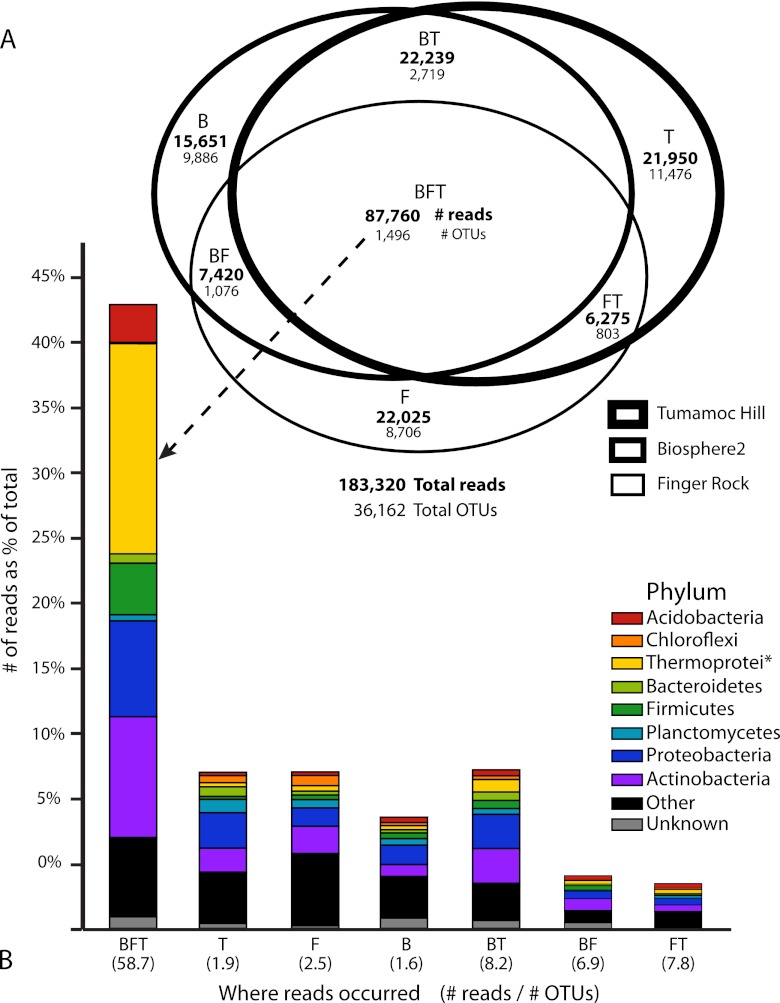
High-throughput, culture-independent surveys of bacterial and archaeal communities in soil have illuminated the importance of both edaphic and biotic influences on microbial diversity, yet few studies compare the relative importance of these factors. Here, we employ multiplexed pyrosequencing of the 16S rRNA gene to examine soil- and cactus-associated rhizosphere microbial communities of the Sonoran Desert and the artificial desert biome of the Biosphere2 research facility. The results of our replicate sampling approach show that microbial communities are shaped primarily by soil characteristics associated with geographic locations, while rhizosphere associations are secondary factors. We found little difference between rhizosphere communities of the ecologically similar saguaro (Carnegiea gigantea) and cardón (Pachycereus pringlei) cacti. Both rhizosphere and soil communities were dominated by the disproportionately abundant Crenarchaeota class Thermoprotei, which comprised 18.7% of 183,320 total pyrosequencing reads from a comparatively small number (1,337 or 3.7%) of the 36,162 total operational taxonomic units (OTUs). OTUs common to both soil and rhizosphere samples comprised the bulk of raw sequence reads, suggesting that the shared community of soil and rhizosphere microbes constitute common and abundant taxa, particularly in the bacterial phyla Proteobacteria, Actinobacteria, Planctomycetes, Firmicutes, Bacteroidetes, Chloroflexi, and Acidobacteria. The vast majority of OTUs, however, were rare and unique to either soil or rhizosphere communities and differed among locations dozens of kilometers apart. Several soil properties, particularly soil pH and carbon content, were significantly correlated with community diversity measurements. Our results highlight the importance of culture-independent approaches in surveying microbial communities of extreme environments.


Figures

Fig 1
Fig 1
Distribution heatmap of microbial orders arranged by hierarchical clustering of pooled soil and rhizosphere samples. The bootstrap tree on the left was created by the unweighted-pair group method using arithmetic means (UPGMA) and shows that the primary clustering of samples follows the collection site, with the samples from each site clustering together. The samples are named as follows: the first letter indicates whether the sample is from soil (S) or rhizosphere (R), the second letter indicates the site (B for Biosphere2, T for Tumamoc Hill, or F for Finger Rock), and the number indicates the sample number (first, second, or third sample from that source and site). The number of observed operational taxonomic units (No. obs. OTUs) is shown to the right of the UPGMA tree and to the left of the heatmap. Within the Finger Rock and Tumamoc Hill sites, rhizosphere and soil samples cluster together with 100% bootstrap support. Each pooled sample shows a high percentage of reads belonging to Thermoprotei and Actinobacteria. Similar distributions of bacterial and archaeal orders can be seen in the heatmaps of closely clustered samples, for example, the preponderance of bacilli in the soil samples at the Finger Rock site.
Fig 2
Fig 2
Principal coordinate analysis plots of data pooled in silico by location and by cactus. (A) The first principal coordinate (PC1) clearly separates pooled samples by the location from which they were collected, as indicated by the ovals around pooled samples from the same collection site. (B) Soil and rhizosphere samples were pooled by the cactus from which they were collected and show separation based primarily on geographic location and secondarily by soil type (i.e., rhizosphere or soil). PC1 separates the samples first by collection site, with the exception of one sample from Finger Rock that nests within those from Biosphere2. PC2 separates samples by their association with the rhizosphere or bulk soil at both the Tumamoc Hill site (indicated by the small ovals within the large oval) and the Finger Rock site, but not from those samples collected at Biosphere2.
Fig 3
Fig 3
Comparison of pooled soil and rhizosphere samples. (A) A proportional Venn diagram showing the number of operational taxonomic units (OTUs) found only in the soil (12,727), only in the rhizosphere (15,474), or in both locations (7,961). These OTUs were used to create the abundance bar graphs in panel B as indicated by the arrows. (B) The relative abundance of raw reads for different phyla belonging to the OTUs depicted in panel A. Note that the relatively smaller number of OTUs containing both soil and rhizosphere reads (7,961 or 22.0% of all OTUs) contain a disproportionately large percentage of the raw reads (140,094 of the 183,320 reads or 76.4%). The class Thermoprotei (phylum Crenarchaeota) is notably abundant and disproportionately overrepresented in this core set of OTUs. The asterisk after Thermoprotei indicates that this designation is at the level of class, not phylum like the other taxa listed.
Fig 4
Fig 4
OTUs and raw reads pooled by the collection location. The collection locations were Biosphere2 (B), Finger Rock (F), and Tumamoc Hill (T). (A) A Venn diagram with set intersections proportional to the number of raw reads shows that the largest portion of reads is found in OTUs present at each collection site. Although this core set (BFT) contains only 1,496 OTUs (4.1% of the total number of OTUs), it contains the largest portion of reads (87,760 or 47.9%). (B) The number of reads for different phyla as a percentage of the total number of reads for each combination of sets as shown in panel A. The height of each bar is proportional to the number of reads. The class Thermoprotei (phylum Crenarchaeota) comprises 18.7% of all raw reads, the vast majority of which are in OTUs present at each site. The number in parentheses below each bar represents the ratio of raw reads to the number of OTUs for a given set. The OTUs unique to a particular site (i.e., B, F, or T) have few reads on average (1.6 to 2.5), suggesting that these unique OTUs represent a rare fraction of soil microbes. The asterisk after Thermoprotei indicates that this designation is at the level of class, not phylum like the other taxa listed.

References

    1. Acosta-Martínez V, Dowds S, Sun Y, Allen V. 2008. Tag-encoded pyrosequencing analysis of bacterial diversity in a single soil type as affected by management and land use. Soil Biol. Biochem. 40:2762–2770
    1. Aguilera LE, Gutierrez JR, Meserve PL. 1999. Variation in soil microorganisms and nutrients underneath and outside the canopy of Adesmia bedwellii (Papilionaceae) shrubs in arid coastal Chile following drought and above average rainfall. J. Arid Environ. 42:61–70
    1. Allen JP, Nelson M, Alling A. 2003. The legacy of Biosphere 2 for the study of biospherics and closed ecological systems. Space Life Sci. 31:1629–1639 - PubMed
    1. Angel R, Soares MIM, Ungar ED, Gillor O. 2010. Biogeography of soil archaea and bacteria along a steep precipitation gradient. ISME J. 4:553–563 - PubMed
    1. Badri DV, Weir TL, van der Lelie D, Vivanco JM. 2009. Rhizosphere chemical dialogues: plant-microbe interactions. Curr. Opin. Biotechnol. 20:642–650 - PubMed

Publication types

LinkOut - more resources