Comparative Study
. 2012 Sep;89(9):1343-52.
doi: 10.1097/OPX.0b013e3182678d99.

Peripheral prism glasses: effects of dominance, suppression, and background

Affiliations
Comparative Study

Peripheral prism glasses: effects of dominance, suppression, and background

Nicole C Ross et al. Optom Vis Sci. 2012 Sep.

Abstract

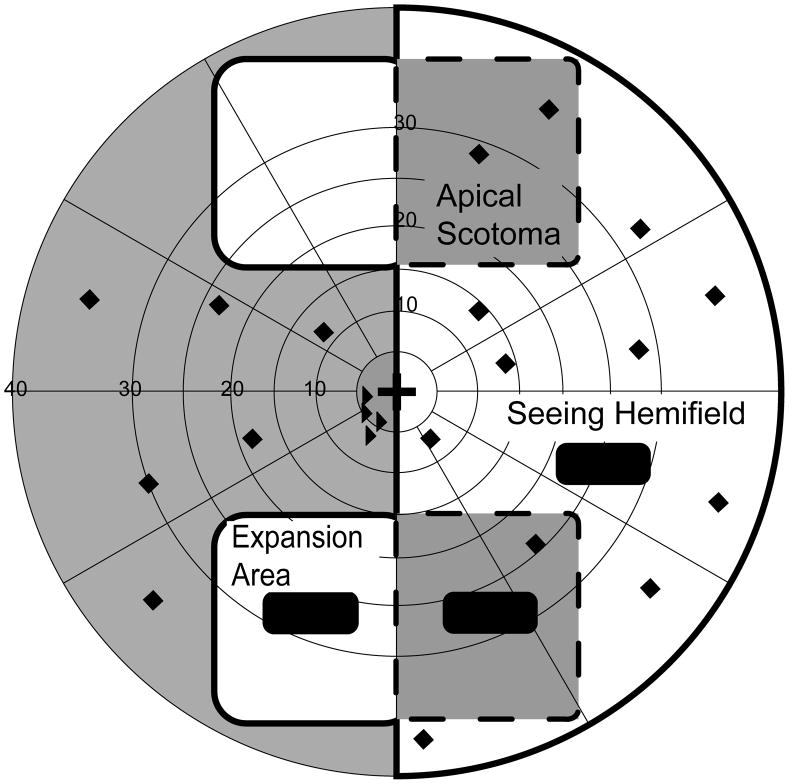
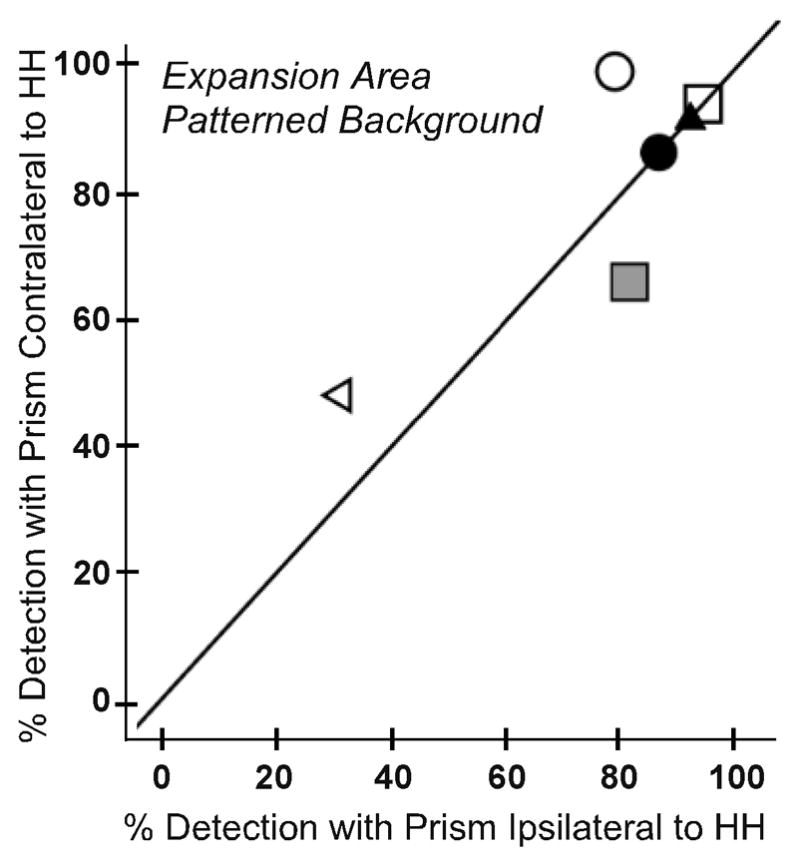
Purpose: Unilateral peripheral prisms for homonymous hemianopia (HH) place different images on corresponding peripheral retinal points, a rivalrous situation in which local suppression of the prism image could occur and thus limit device functionality. Detection with peripheral prisms has primarily been evaluated using conventional perimetry, where binocular rivalry is unlikely to occur. We quantified detection over more visually complex backgrounds and examined the effects of ocular dominance.

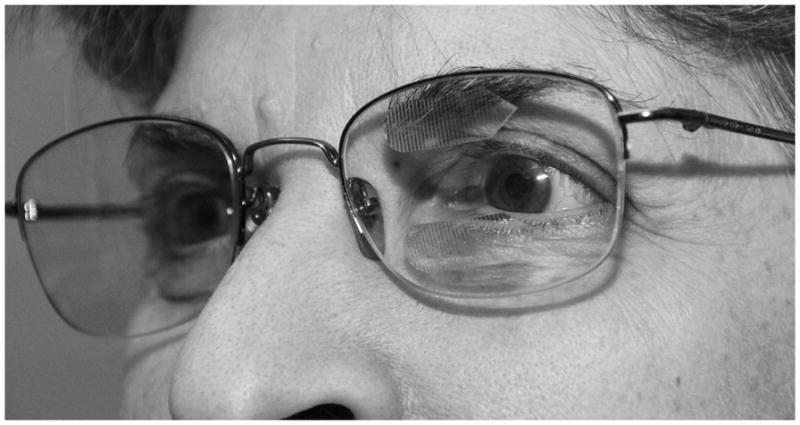
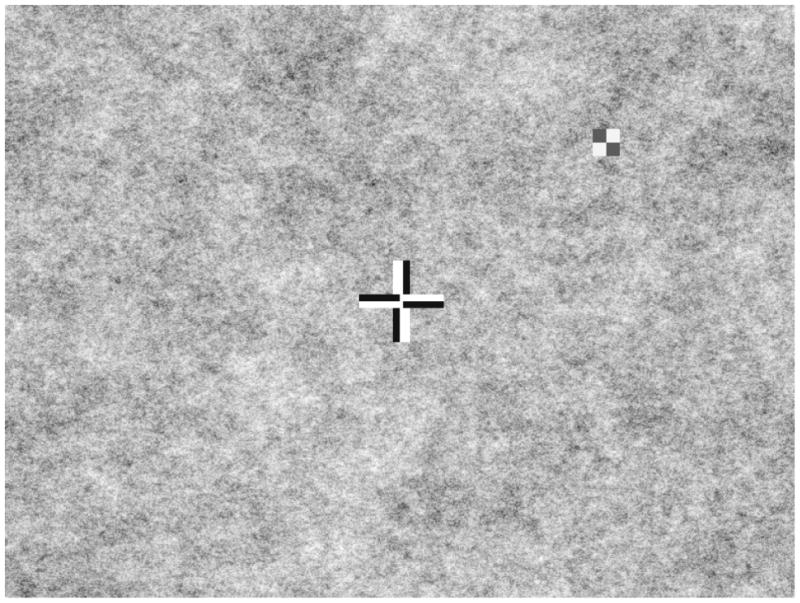
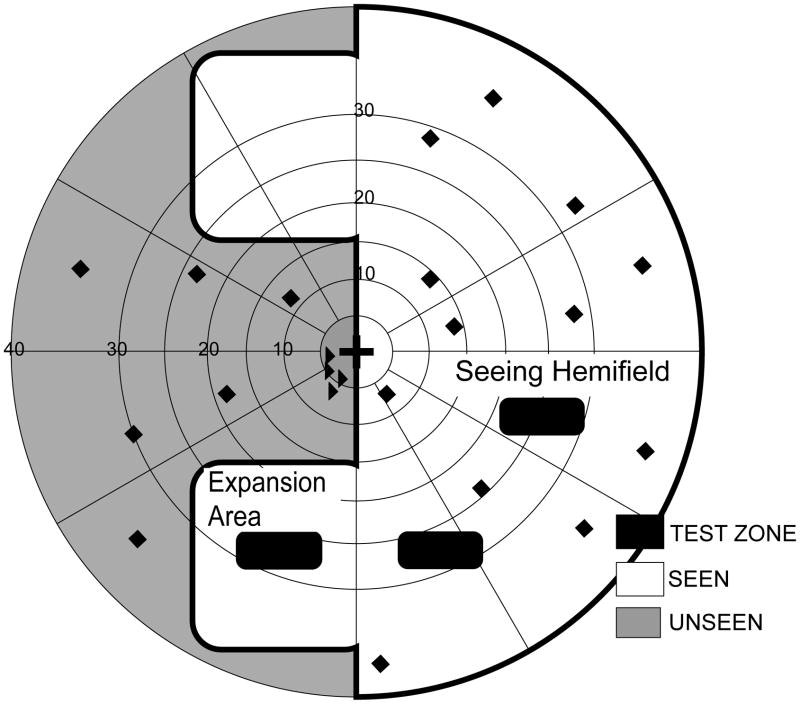
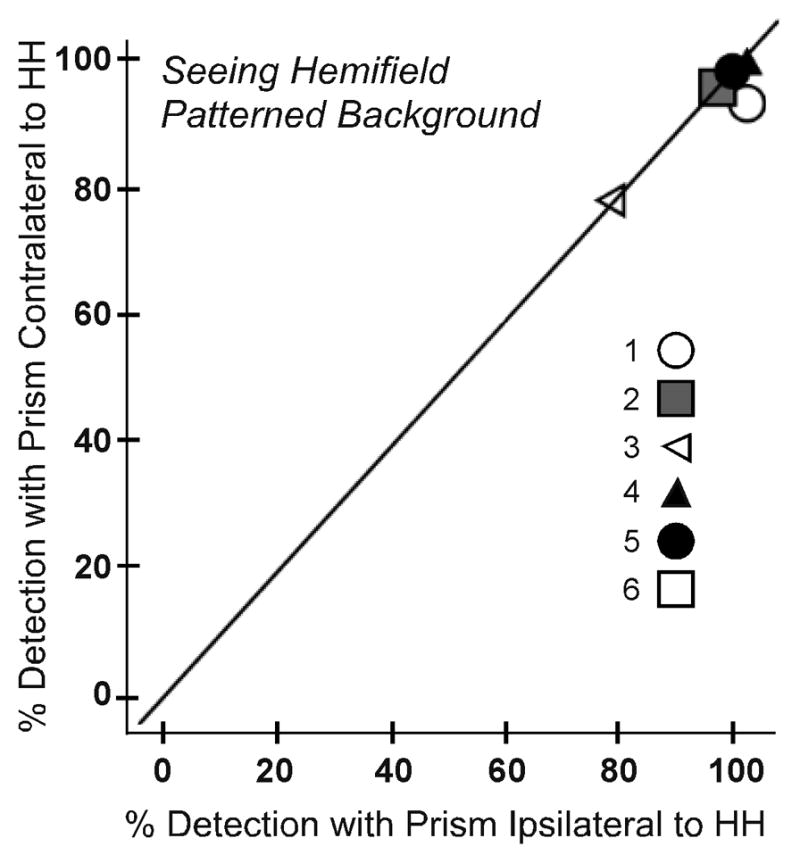
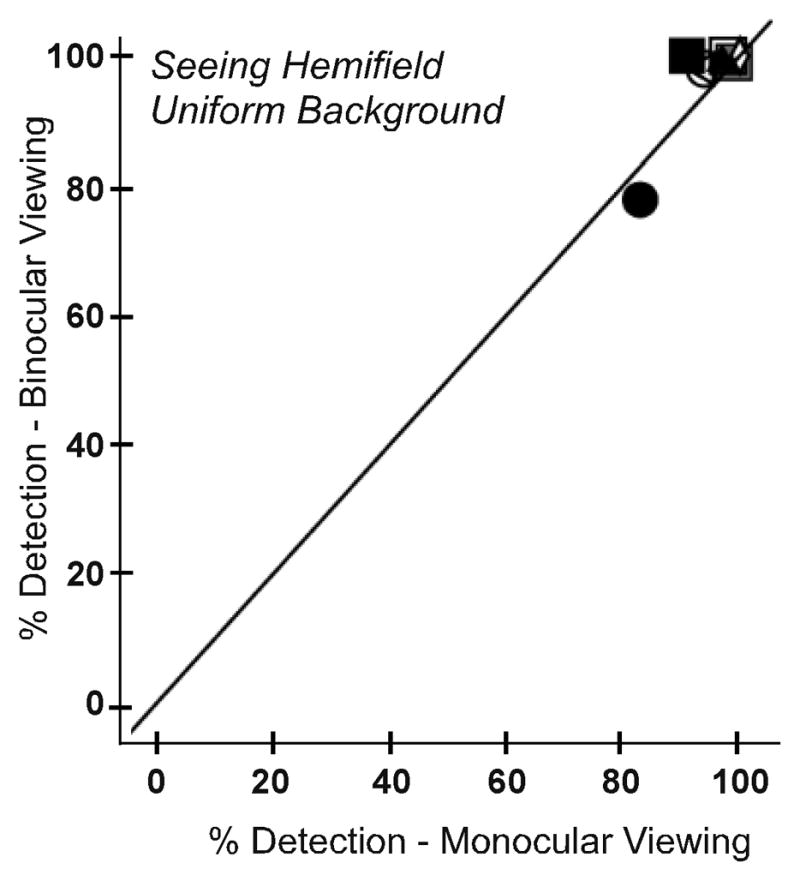
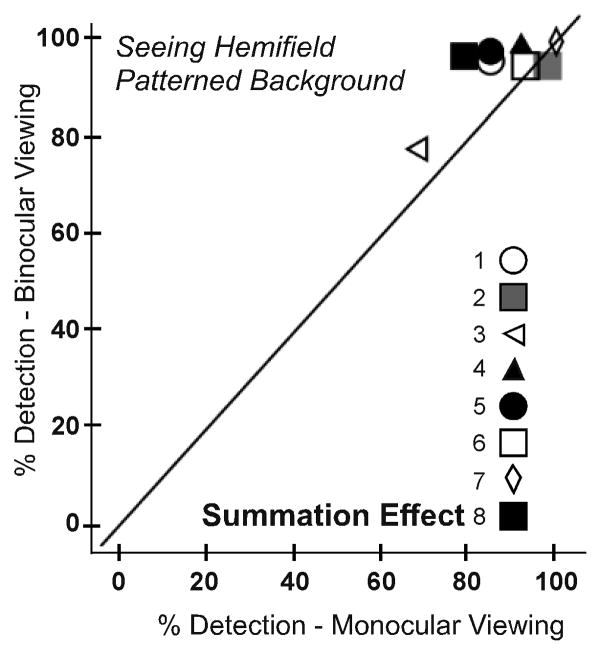
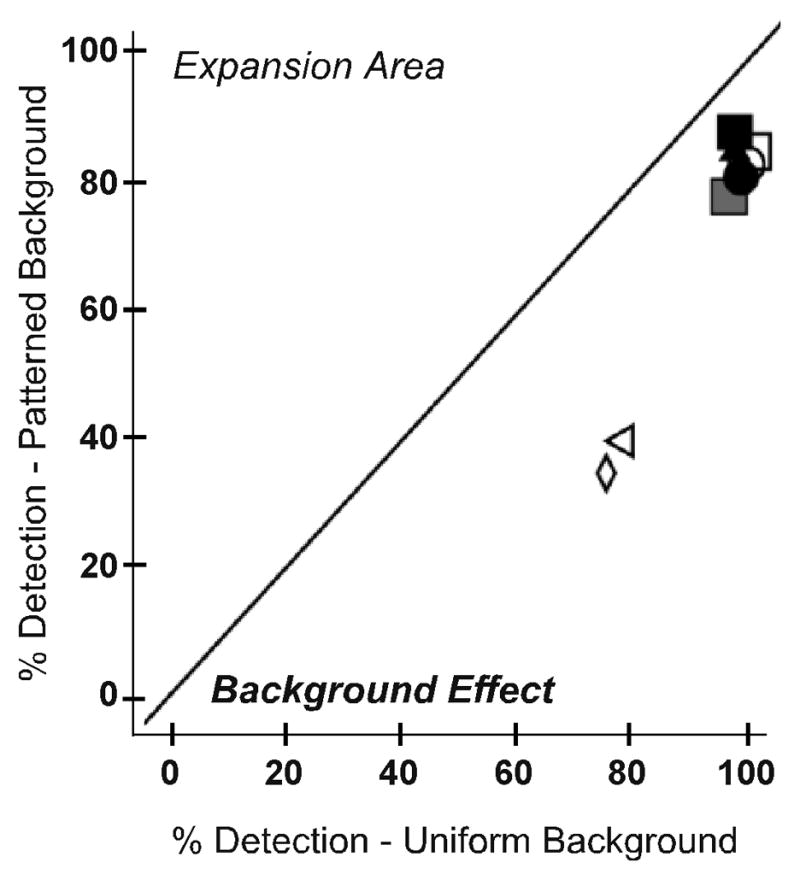
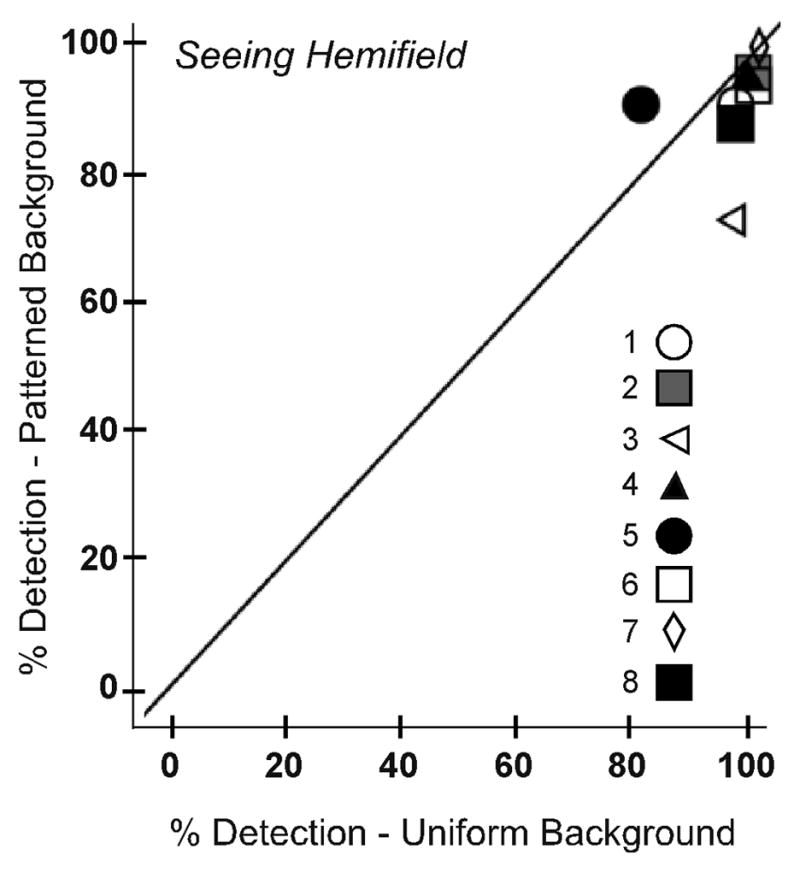
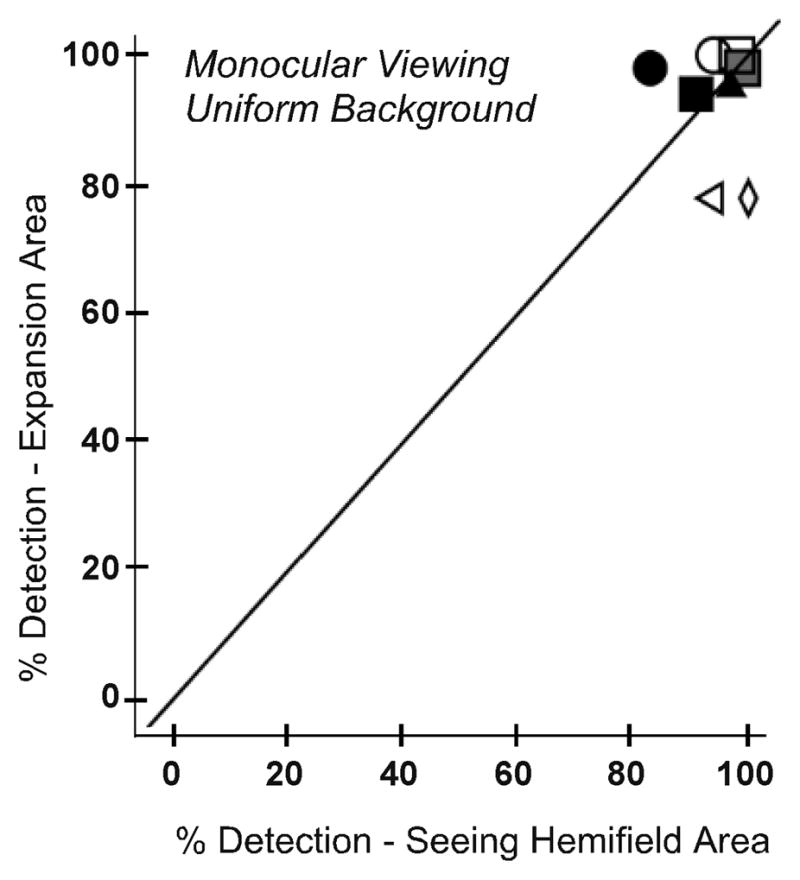
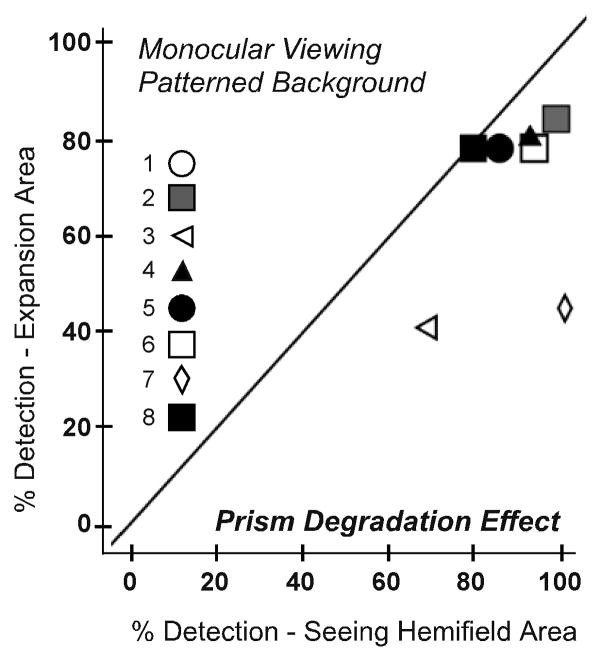
Methods: Detection rates of eight participants with HH or quadranopia and normal binocularity wearing unilateral peripheral prism glasses were determined for static perimetry targets briefly presented in the prism expansion area (in the blind hemifield) and the seeing hemifield, under monocular and binocular viewing, over uniform gray and more complex patterned backgrounds.

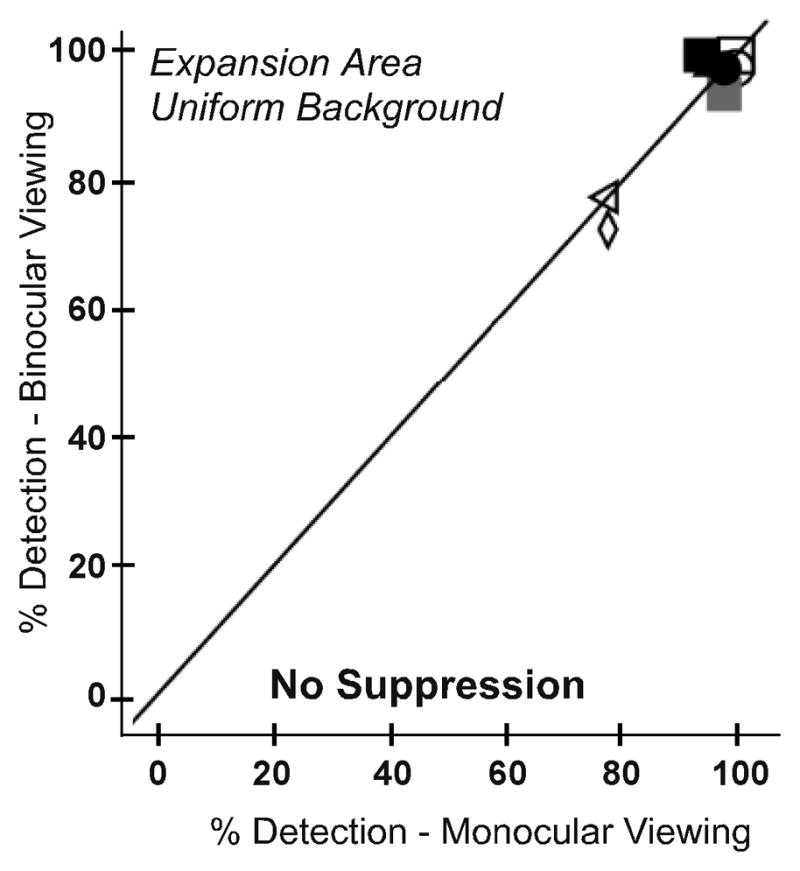
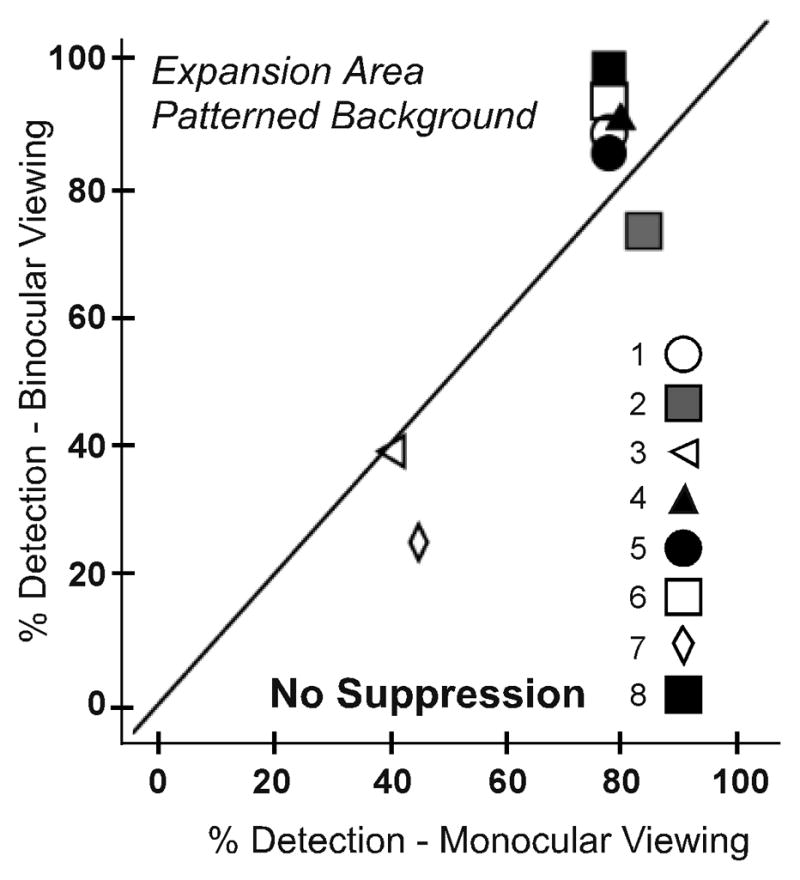
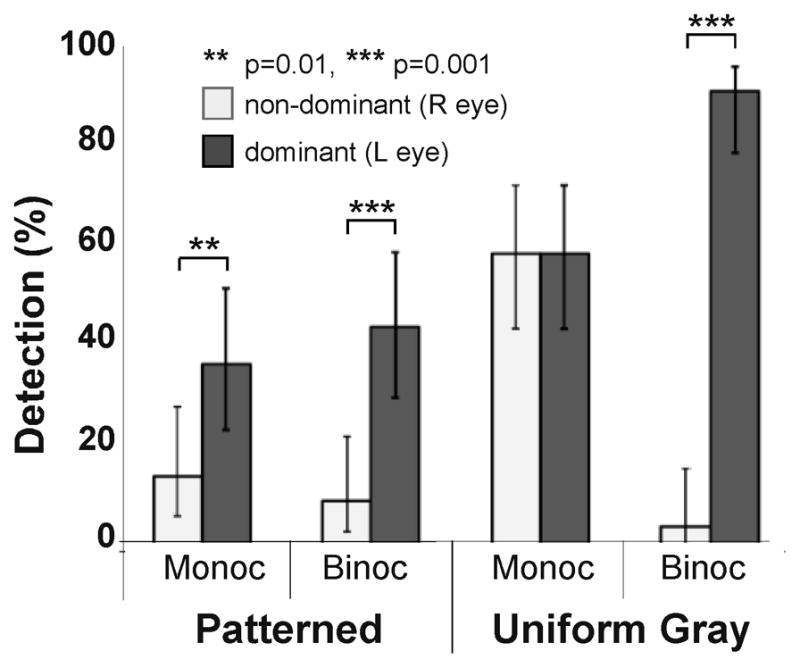
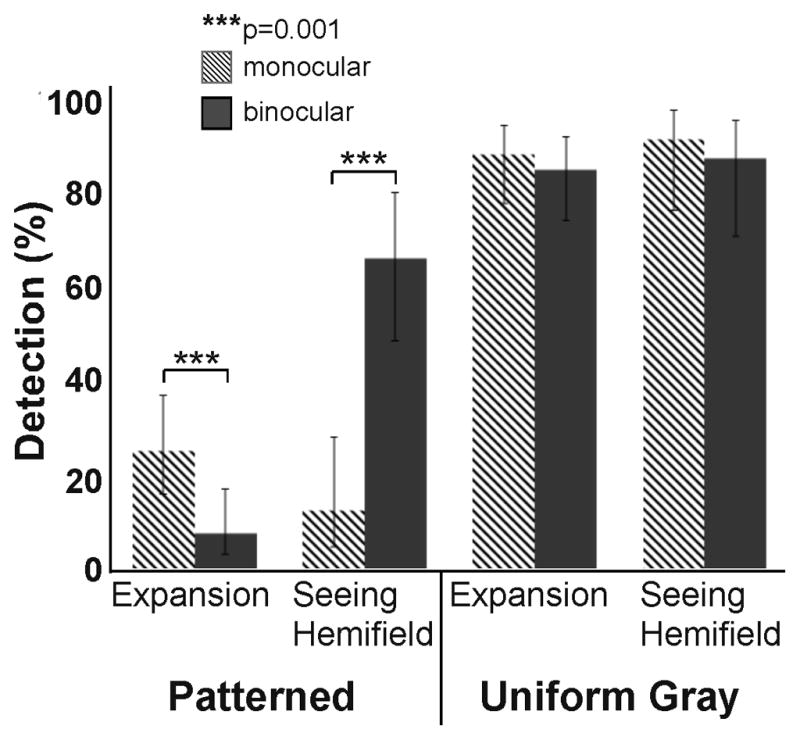
Results: Participants with normal binocularity had mixed sensory ocular dominance, demonstrated no difference in detection rates when prisms were fitted on the side of the HH or the opposite side (p > 0.2), and had detection rates in the expansion area that were not different for monocular and binocular viewing over both backgrounds (p > 0.4). However, two participants with abnormal binocularity and strong ocular dominance demonstrated reduced detection in the expansion area when prisms were fitted in front of the non-dominant eye.

Conclusions: We found little evidence of local suppression of the peripheral prism image for HH patients with normal binocularity. However, in cases of strong ocular dominance, consideration should be given to fitting prisms before the dominant eye. Although these results are promising, further testing in more realistic conditions including image motion is needed.


Figures

Figure 1
Figure 1
Press-on Fresnel 40Δ prisms, as fitted for the study, placed base left on the left spectacle lens of a left HH patient (the pointed edge of the prism segments indicates the direction of the base).
Figure 2
Figure 2
Patient’s view during testing consisting of a patterned background (1/f 0.75 spatial noise), a bipolar fixation cross, and a peripheral bipolar checkerboard target (shown here at high, 95% contrast). Only the central portion of the screen is shown.
Figure 3
Figure 3
Schematic visual field plots and static detection test zones for a patient with left HH wearing peripheral prism glasses. (A) Prism eye only; (B) Binocular viewing. Thick black lines mark the kinetic isopter. Dashed lines outline the prism apical scotoma mapped in the prism-eye only condition. Black-filled rounded-corner rectangles represent test zones (20 targets per zone). Black diamonds represent arbitrary positions of additional targets (20) included to prevent anticipation of a target’s location. Black triangles are targets used to monitor fixation.
Figure 3
Figure 3
Schematic visual field plots and static detection test zones for a patient with left HH wearing peripheral prism glasses. (A) Prism eye only; (B) Binocular viewing. Thick black lines mark the kinetic isopter. Dashed lines outline the prism apical scotoma mapped in the prism-eye only condition. Black-filled rounded-corner rectangles represent test zones (20 targets per zone). Black diamonds represent arbitrary positions of additional targets (20) included to prevent anticipation of a target’s location. Black triangles are targets used to monitor fixation.
Figure 4
Figure 4
Detection rates for each participant under binocular viewing on the patterned background when peripheral prism segments were fit ipsilateral and contralateral to the side of HH: (A) prism expansion area test zone and (B) seeing hemifield test zone. In both test zones detection rates were not significantly different for the two fittings (p > 0.2). The y=x reference line is plotted to assist interpretation; data points falling on the reference line indicate no difference between the ipsilateral and contralateral fittings.
Figure 4
Figure 4
Detection rates for each participant under binocular viewing on the patterned background when peripheral prism segments were fit ipsilateral and contralateral to the side of HH: (A) prism expansion area test zone and (B) seeing hemifield test zone. In both test zones detection rates were not significantly different for the two fittings (p > 0.2). The y=x reference line is plotted to assist interpretation; data points falling on the reference line indicate no difference between the ipsilateral and contralateral fittings.
Figure 5
Figure 5
Detection rates for each participant in the expansion area test zone for monocular and binocular viewing for (A) the uniform and (B) the patterned background. There were no significant differences in detection rates between monocular and binocular viewing on either background, suggesting no reduction in predominance or local suppression of the prism image in binocular viewing.
Figure 5
Figure 5
Detection rates for each participant in the expansion area test zone for monocular and binocular viewing for (A) the uniform and (B) the patterned background. There were no significant differences in detection rates between monocular and binocular viewing on either background, suggesting no reduction in predominance or local suppression of the prism image in binocular viewing.
Figure 6
Figure 6
Detection rates for each participant in the main seeing hemifield area test zone for monocular and binocular viewing for (A) the uniform and (B) the patterned background. On the patterned background, detection was better under binocular than monocular viewing consistent with a binocular summation effect, which was not evident on the uniform background (as expected).
Figure 6
Figure 6
Detection rates for each participant in the main seeing hemifield area test zone for monocular and binocular viewing for (A) the uniform and (B) the patterned background. On the patterned background, detection was better under binocular than monocular viewing consistent with a binocular summation effect, which was not evident on the uniform background (as expected).
Figure 7
Figure 7
Detection rates for each participant on the uniform and patterned backgrounds for (A) the prism expansion area and (B) the seeing hemifield test zones. In the prism expansion area, detection rates were significantly lower on the patterned than the uniform gray background (p=0.012). Data are pooled across monocular and binocular viewing.
Figure 7
Figure 7
Detection rates for each participant on the uniform and patterned backgrounds for (A) the prism expansion area and (B) the seeing hemifield test zones. In the prism expansion area, detection rates were significantly lower on the patterned than the uniform gray background (p=0.012). Data are pooled across monocular and binocular viewing.
Figure 8
Figure 8
The degrading effect of the Fresnel prism was measured by comparing detection rates for each participant in the seeing hemifield and expansion area test zones under monocular viewing for (A) the uniform and (B) the patterned background. The poor optical quality of the prisms reduced detection by about 10% (median) on the patterned background, but had little effect on detection rates on the uniform background.
Figure 8
Figure 8
The degrading effect of the Fresnel prism was measured by comparing detection rates for each participant in the seeing hemifield and expansion area test zones under monocular viewing for (A) the uniform and (B) the patterned background. The poor optical quality of the prisms reduced detection by about 10% (median) on the patterned background, but had little effect on detection rates on the uniform background.
Figure 9
Figure 9
Detection performance in the expansion area for participant 9 with left HH and a strongly dominant left eye due to unilateral (right eye) ocular pathology. Detection rates were significantly higher in the prism expansion area when the prism was fit to the left than the right eye for both viewing conditions on the patterned background and for the binocular condition on the uniform background. Error bars are 95% confidence limits.
Figure 10
Figure 10
Detection rates when peripheral prisms were fit in front of the non-dominant left eye of participant 10 with left HH and left exotropia. On the patterned background, monocular (prism-eye only) detection was significantly reduced in both the expansion and seeing hemifield zones (compared to the binocular seeing hemifield condition) indicating overall poor visual function of the prism eye. In the expansion zone, detection rates on the patterned background were significantly lower in binocular than monocular viewing, suggesting partial local suppression of the prism image from the non-dominant prism eye. Error bars are 95% confidence limits.

Similar articles

Cited by

References

    1. Gilhotra JS, Mitchell P, Healey PR, Cumming RG, Currie J. Homonymous visual field defects and stroke in an older population. Stroke. 2002;33:2417–20. - PubMed
    1. Zhang X, Kedar S, Lynn MJ, Newman NJ, Biousse V. Homonymous hemianopias: clinical-anatomic correlations in 904 cases. Neurology. 2006;66:906–10. - PubMed
    1. Peli E, Peli D. Driving With Confidence: A Practical Guide to Driving With Low Vision. Singapore: World Scientific; 2002.
    1. O’Neil EC, Connell PP, O’Connor JC, Brady J, Reid I, Logan P. Prism Therapy and Visual Rehabilitation in Homonymous Visual Field Loss. Optom Vis Sci. 2011;88:263–8. - PubMed
    1. Vu H, Keeffe J, McCarty C, Taylor H. Impact of unilateral and bilateral vision loss on quality of life. Br J Ophthalmol. 2005;89:360–3. - PMC - PubMed

Publication types