. 2012 Sep;9(9):923-8.
doi: 10.1038/nmeth.2138. Epub 2012 Aug 12.

Fractional proliferation: a method to deconvolve cell population dynamics from single-cell data

Affiliations

Fractional proliferation: a method to deconvolve cell population dynamics from single-cell data

Darren R Tyson et al. Nat Methods. 2012 Sep.

Abstract

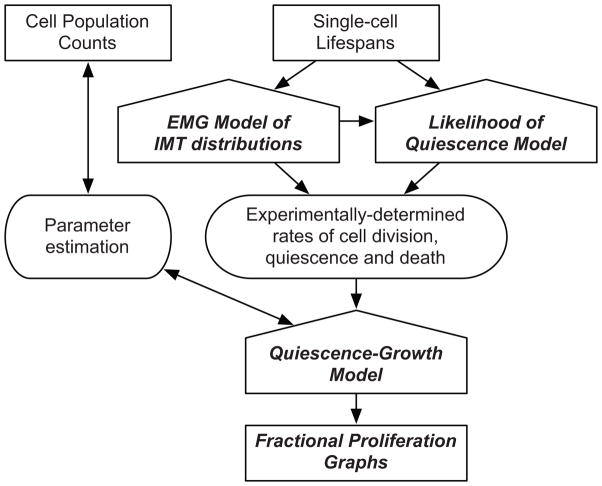
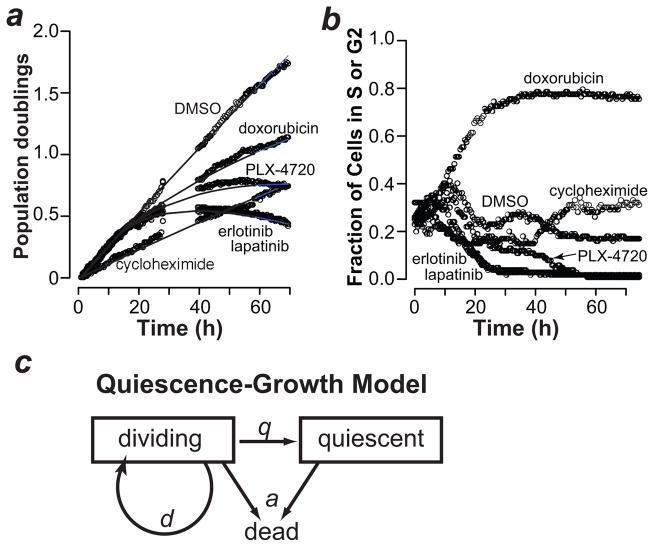
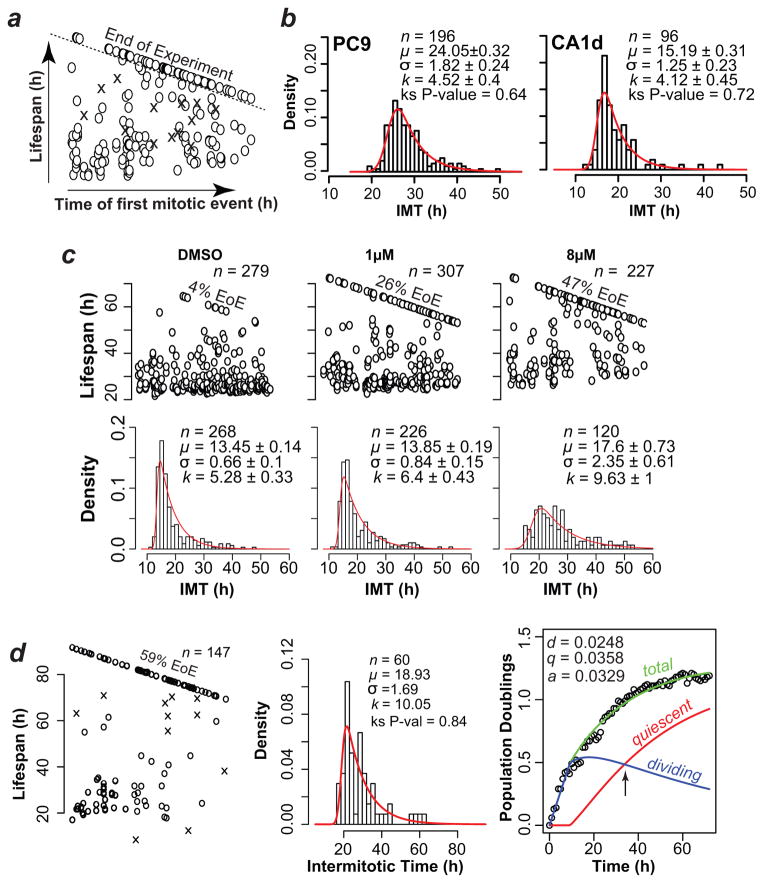
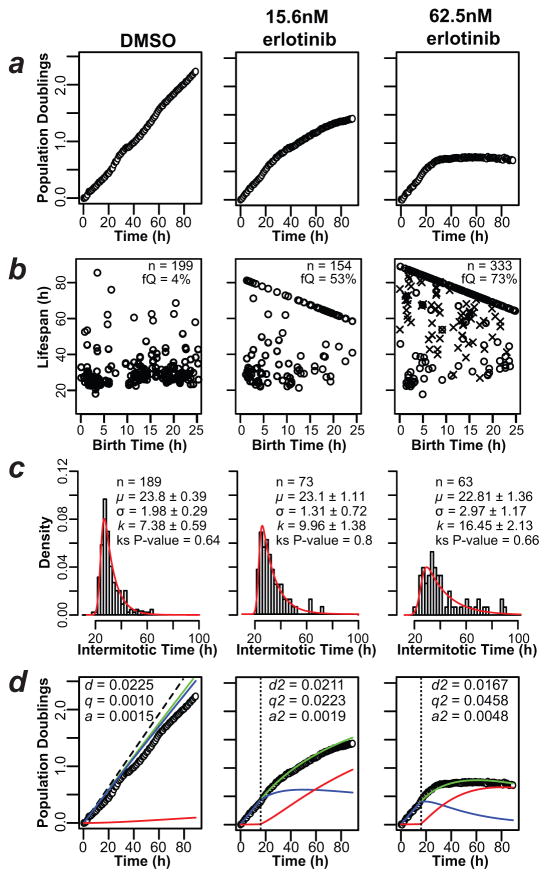
We present an integrated method that uses extended time-lapse automated imaging to quantify the dynamics of cell proliferation. Cell counts are fit with a quiescence-growth model that estimates rates of cell division, entry into quiescence and death. The model is constrained with rates extracted experimentally from the behavior of tracked single cells over time. We visualize the output of the analysis in fractional proliferation graphs, which deconvolve dynamic proliferative responses to perturbations into the relative contributions of dividing, quiescent (nondividing) and dead cells. The method reveals that the response of 'oncogene-addicted' human cancer cells to tyrosine kinase inhibitors is a composite of altered rates of division, death and entry into quiescence, a finding that challenges the notion that such cells simply die in response to oncogene-targeted therapy.


Figures

Figure 1
Figure 1. The Fractional Proliferation methodology
The principal inputs are cell population counts and metrics of single-cell fate obtained by automated time-lapse imaging. The Quiescence-Growth Model is fit to cell count data to estimate rates of cell division, death and entry into quiescence. These estimated rates are statistically bound and can be evaluated with the Quiescence-Growth model to provide initial insights into the underlying biology without requiring experimental determination of the rates. The EMG model of IMT distribution and the Likelihood of Quiescence models extract experimental rates of division and entry into quiescence from single-cell tracking data. Incorporating experimentally derived rates constrains the Quiescence Growth Model and produces Fractional Proliferation graphs that dynamically resolve the change in cell counts into fractions of dividing and quiescent cells.
Figure 2
Figure 2. The Quiescence-Growth model explains nonlinear proliferation
(a) The number of population doublings of PC9 cells treated with vehicle (DMSO) or the indicated drugs is shown as circles (see Methods for details). Cycloheximide, 250 ng/ml; erlotinib, 4 μM; lapatinib, 4 μM; PLX-4720, 16 μM; doxorubicin, 31 nM. The lines indicate Quiescence-Growth model fits to the data. (b) PC9 cells treated as in Fig. 2a (except 250 ng/ml doxorubicin) were analyzed for their expression of a marker of S or G2 phase (mAG-geminin) . (c) The Quiescence-Growth model considers two cellular compartments, dividing and non-dividing (quiescent). The dividing cell compartment is depleted at the rate of entry into quiescence (q), and replenished at the rate of division (d). A rate of death (a) depletes both compartments. The differential equations derived from the model are shown in Methods.
Figure 3
Figure 3. Interpretation of tracked single-cell data with mathematical models
(a). Schematic example plot of tracked single cell lifespans. The data used in this example plot are shown in Fig. 3c (CA1d cells treated with 8μM erlotinib). Time of first mitotic event (birth time) is along the x-axis and cell lifespan along the y-axis. O, live cells; X, dead cells. Cells born during the experiment but reaching the end of experiment (EoE) without a second mitotic event are above the dashed line and are not included in IMT distributions. (b) Representative intermitotic time (IMT) distributions of untreated populations of the indicated cell types (shown as a density histogram). Distributions were fit to an EMG model. n = number of IMT in the distribution; μ =mean of the Gaussian component of EMG; σ = deviation of the Gaussian component of EMG; k= the mean of the exponential component of EMG. Values ± 95% confidence intervals. (c) Plots of single cell lifespans (top) and IMT distributions (bottom) of CA1d cells treated with indicated concentrations of erlotinib or vehicle (DMSO). (d) The plots show proliferation of CA1d cells treated with 16 μM erlotinib. The left panel shows single cell lifespans, the middle panel is the IMT distribution and the right panel is the Fractional Proliferation graph. The Fractional Proliferation graph (Methods) shows total cells (green), the fraction of dividing cells (blue) and the fraction of non-dividing or quiescent cells (red) over time. Arrow, time at which quiescent and dividing fractions are equal. Note that the death rate is not explicitly represented but is applied to both quiescent and dividing fractions.
Figure 4
Figure 4. Application of Fractional Proliferation to a model of oncogene-addicted tumor cells
(a) The plots show PC9 cell counts obtained by automated quantification of cell nuclei from time-lapse images of cultures treated as indicated. Data were normalized and plotted (open circles) on a log2 scale (Population Doublings). (b) Lifespan plots of tracked PC9 cells treated as indicated; observed birth time is on the x-axis and observed lifespan on the y-axis. Only cells born within the first 25 h of the experiment are shown. fQ, quiescent fraction; n = number of lifespans examined. (c) IMT distributions of PC9 cells treated as indicated. The EMG model was fit with the parameters shown within each graph. The P-value of the Kolmogorov-Smirnoff (ks) test indicates that the EMG model cannot be excluded as an explanation of the data (P>0.05). (d) Fractional Proliferation graphs of erlotinib-treated PC9 cells, as in 3d. The dashed line indicates calculated proliferation without the contribution of death and quiescence (based on DTd; see Fig. 3c). Parameter values fitting these data are indicated in the boxes and were applied after a delay (vertical dotted line) to account for lag time in drug action.

References

    1. Hughes M, et al. Early Drug Discovery and Development Guidelines: For Academic Researchers, Collaborators, and Start-up Companies. In: Sittampalam GS, et al., editors. Assay Guidance Manual. Bethesda (MD): 2004. - PubMed
    1. Terry NH, White RA. Flow cytometry after bromodeoxyuridine labeling to measure S and G2+M phase durations plus doubling times in vitro and in vivo. Nat Protoc. 2006;1:859–869. - PubMed
    1. van Genderen H, et al. In vitro measurement of cell death with the annexin A5 affinity assay. Nat Protoc. 2006;1:363–367. - PubMed
    1. Hawkins ED, et al. Measuring lymphocyte proliferation, survival and differentiation using CFSE time-series data. Nat Protoc. 2007;2:2057–2067. - PubMed
    1. Sakaue-Sawano A, et al. Visualizing spatiotemporal dynamics of multicellular cell-cycle progression. Cell. 2008;132:487–498. - PubMed

Publication types

MeSH terms

Substances