. 2012 Sep;122(9):3114-26.
doi: 10.1172/JCI61758. Epub 2012 Aug 13.

Dynamic T cell-APC interactions sustain chronic inflammation in atherosclerosis

Affiliations

Dynamic T cell-APC interactions sustain chronic inflammation in atherosclerosis

Ekaterina K Koltsova et al. J Clin Invest. 2012 Sep.

Abstract

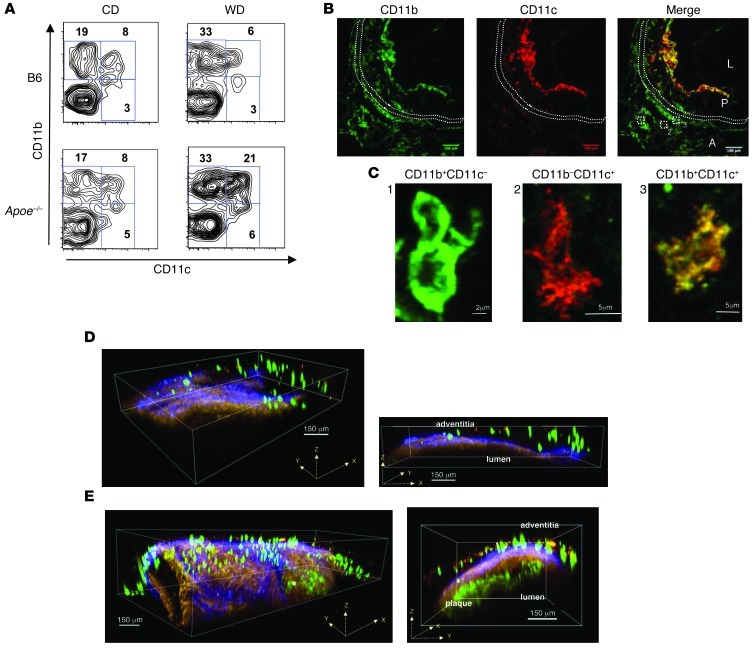
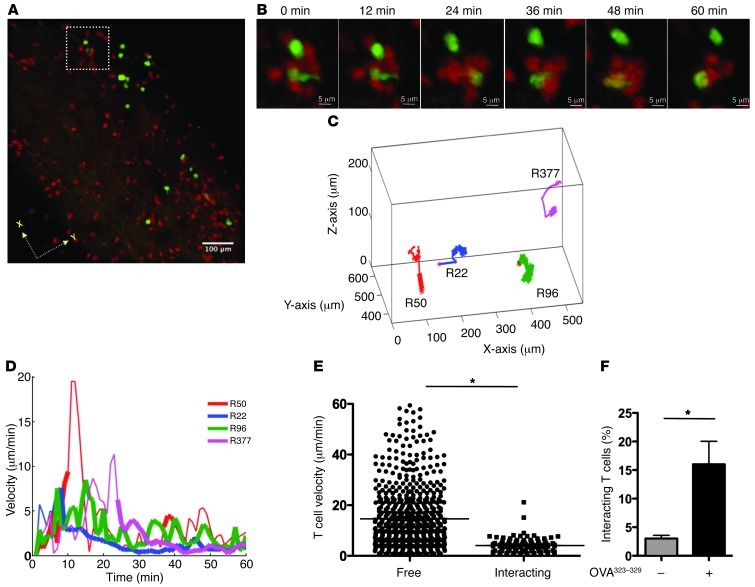
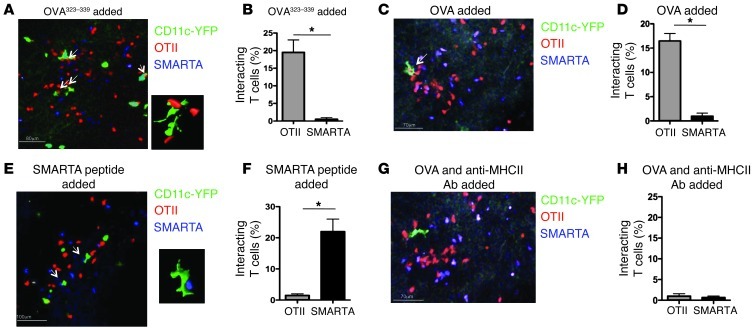
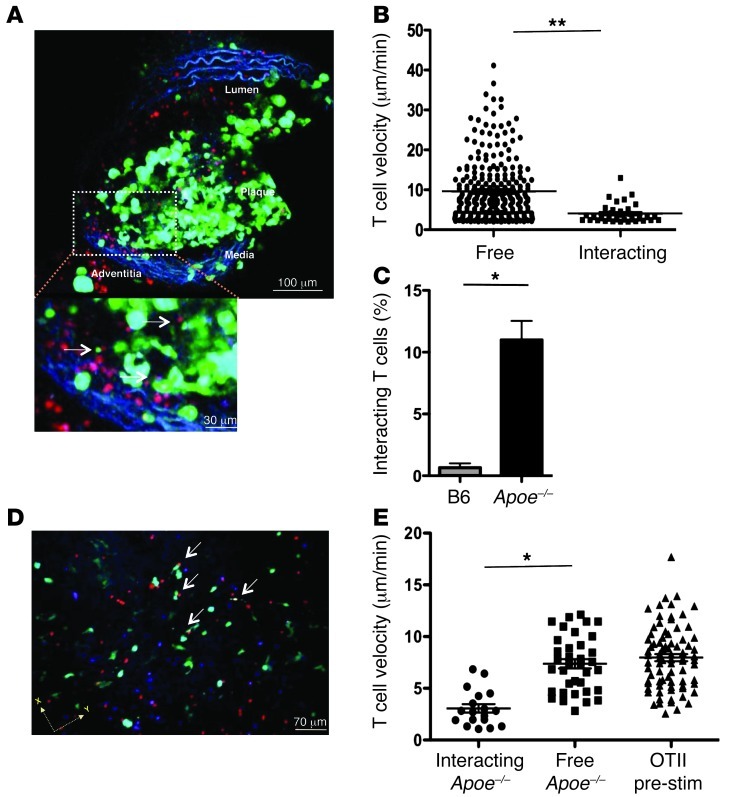
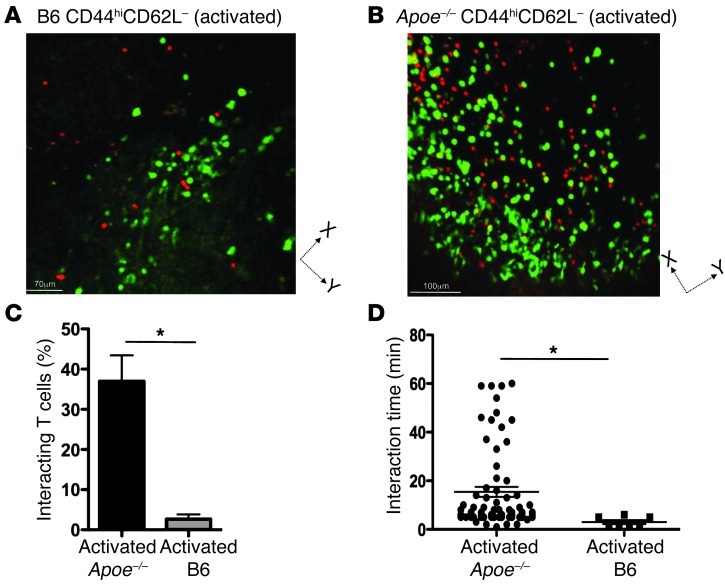
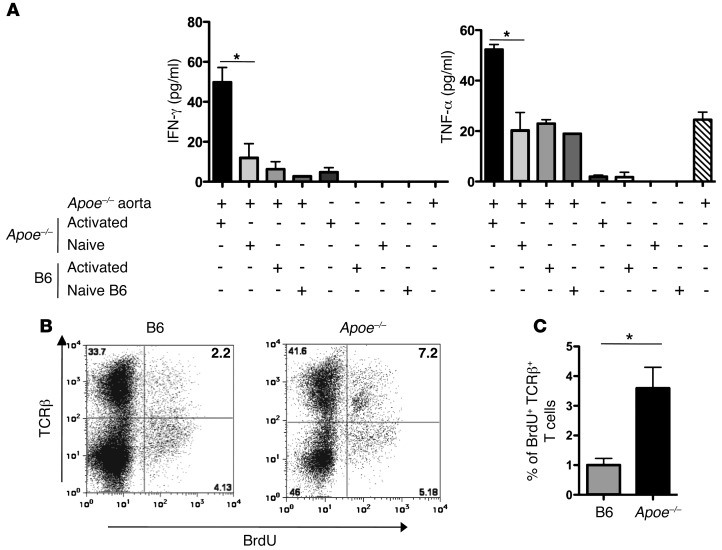
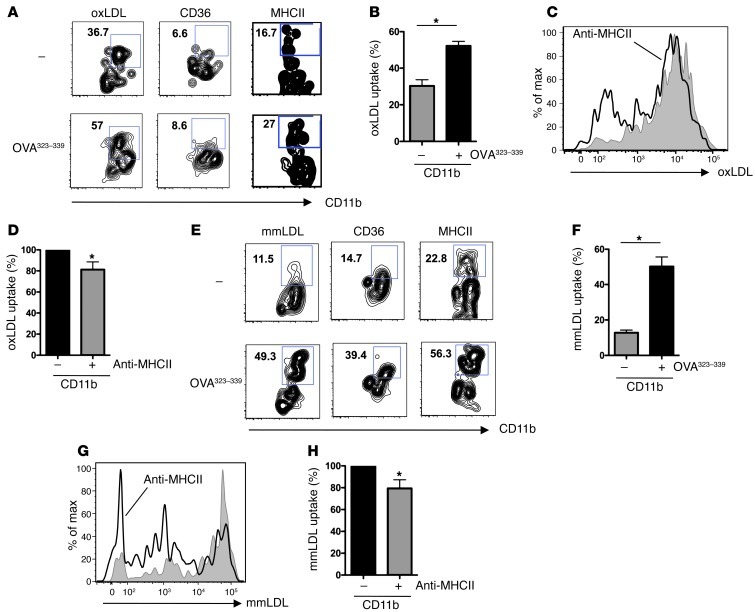
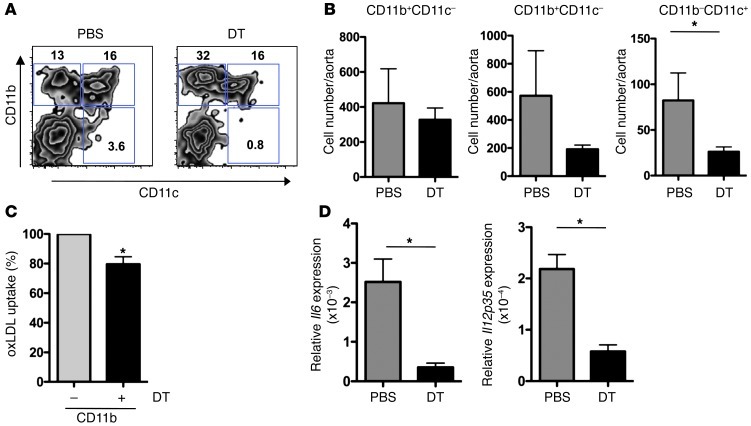
Atherosclerosis is a chronic inflammatory disease of large and medium-sized arteries characterized by leukocyte accumulation in the vessel wall. Both innate and adaptive immune responses contribute to atherogenesis, but the identity of atherosclerosis-relevant antigens and the role of antigen presentation in this disease remain poorly characterized. We developed live-cell imaging of explanted aortas to compare the behavior and role of APCs in normal and atherosclerotic mice. We found that CD4+ T cells were capable of interacting with fluorescently labeled (CD11c-YFP+) APCs in the aortic wall in the presence, but not the absence, of cognate antigen. In atherosclerosis-prone Apoe-/-CD11c-YFP+ mice, APCs extensively interacted with CD4+ T cells in the aorta, leading to cell activation and proliferation as well as secretion of IFN-γ and TNF-α. These cytokines enhanced uptake of oxidized and minimally modified LDL by macrophages. We conclude that antigen presentation by APCs to CD4+ T cells in the arterial wall causes local T cell activation and production of proinflammatory cytokines, which promote atherosclerosis by maintaining chronic inflammation and inducing foam cell formation.


Figures

Figure 1
Figure 1. Myeloid cells in aortic plaque and adventitia.
(A) Live CD45+ cells from aortas of Apoe–/– mice fed CD or WD for 12 weeks were stained for CD11b and CD11c. Numbers indicate percentage in each quadrant. (B) Localization of CD11b+CD11c (green), CD11b+CD11c+ (yellow), and CD11bCD11c+ (red) cells in aortic roots of WD-fed Apoe–/– mice, shown by immunofluorescence. Dotted white lines indicate border of lamina muscularis. L, lumen; P, plaque; A, adventitia. Representative images from at least 3 independent experiments. (C) Examples of CD11b+CD11c, CD11b+CD11c+, and CD11bCD11c+ cells in the adventitia enlarged from boxed regions in B. Localization of CD11c-YFP+ cells (green) in normal B6 (D) and in atherosclerotic Apoe–/– (E) mouse aorta. Blue, second harmonic; brown, autofluorescence. Scale bars: 100 μm (B); 2 μm (C, left); 5 μm (C, middle and right); 150 μm (D and E).
Figure 2
Figure 2. 2-photon imaging of T cell–APC interaction in aortic wall.
(A) Maximum intensity projection along z axis (top view) through image stacks (760 × 760 × 210 μm [x, y, z]). View of CD11c-YFP+ (green) and SNARF-labeled OTII T cells (red) from the adventitial side of explanted mouse aorta. (B) Time-lapse images of interacting APCs (green) and T cells (red) in the adventitia (boxed region in A) in the presence of OVA323–339. Tracks (C) and velocities (D) of individual T cells obtained from 3D projection (1 color per cell) in the presence of OVA323–339. Long interaction with APCs (>5 minutes) is denoted by a thick line. (E) Velocities of individual noninteracting (free; n = 1,057) and interacting (>5 minutes; n = 99) T cells. Average is indicated by horizontal line. (F) Percent T cells interacting with APCs in the presence and absence of OVA323–329. Data (mean ± SEM) are representative of at least 3 independent experiments. *P < 0.05. Scale bars: 100 μm (A); 5 μm (B).
Figure 3
Figure 3. 2-photon imaging of antigen-specific T cell–APC interaction in aortic wall.
Interaction of CD11c-YFP+ APCs (green) with OTII T cells (red) or SMARTA T cells (blue) in the presence of OVA323–339 (A and B), OVA (C and D), SMARTA peptide (E and F), or OVA and anti-MHCII antibody (G and H). Aortas were explanted from Apoe–/– mice fed with WD for 12 weeks. See Supplemental Videos 5 and 6 for time series. (A, C, E, and G) Interacting APCs and T cells (white arrows) were located in the adventitia. Insets in A and E show surface-rendered OTII (A; enlarged ×8) or SMARTA (E; enlarged ×7) T cells interacting with CD11c-YFP+ APCs. (B, D, F, and H) Percent interacting OTII and SMARTA T cells. Data are mean ± SEM. Scale bars: 80 μm (A); 70 μm (C and G); 100 μm (E).
Figure 4
Figure 4. 2-photon imaging of Apoe–/– CD4+ T cell–APC interaction in the plaque and adventitia of Apoe–/– aorta.
(A) Cross-sectional view of innominate artery plaque and media. CD11c-YFP+ cells are stained green, and SNARF-labeled Apoe–/– CD4+ T cells are stained red. (B) Velocities of individual freely migrating (n = 126) and interacting (n = 47) T cells. No exogenous antigen was added. Average is indicated by horizontal line. (C) Percent interaction with CD11c-YFP+CD4+ T cells isolated from spleens and lymph nodes of atherosclerotic WD-fed Apoe–/– or B6 mice. Data are mean ± SEM of 2 independent experiments. (D) Maximum intensity projection (top view) through image stacks (760 × 760 × 225 μm [x, y, z]). CD11c-YFP+ cells are stained green, SNARF-labeled Apoe–/– CD4+ T cells are stained red, and CMRA-labeled OTII CD4+ T cells are stained blue. No antigen was added. Interacting cells (arrows) were located in the adventitia. See Supplemental Video 7. (E) Mean velocities of individual prestimulated (CD3/CD28) OTII and freely migrating or interacting Apoe–/– CD4+ T cells, isolated from Apoe–/– mice fed WD for 20 weeks. Average is indicated by horizontal line. *P < 0.05; **P < 0.01. Scale bars: 100 μm (A); 30 μm (A, inset); 70 μm (D).
Figure 5
Figure 5. 2-photon imaging of interactions of activated B6 or Apoe–/– CD4+ T cells with APCs in the adventitia of atherosclerotic aorta.
(A and B) Maximum intensity projection along z axis (top view) through image stacks (760 × 760 × 225 μm [x, y, z]). CD11c-YFP+ cells are stained green, and SNARF-labeled activated CD44hiCD62L B6 (A) or Apoe–/– (B) CD4+ T cells are stained red. (C) Percent interacting CD11c-YFP+ APCs and CD44hiCD62LCD4+ T cells isolated from atherosclerotic WD-fed Apoe–/– or B6 mice. (D) Interaction times between CD11c-YFP+ APCs and Apoe–/– or B6 CD44hiCD62LCD4+ T cells. Each symbol represents 1 T cell–APC interaction. Data are mean ± SEM. *P < 0.05. Scale bars: 70 μm (A); 100 μm (B).
Figure 6
Figure 6. Cytokine secretion and T cell proliferation in mouse aorta.
(A) IFN-γ and TNF-α protein levels from supernatants of explanted intact Apoe–/– aortas incubated with sorted CD44loCD62L+ naive or CD44hiCD62L activated (effector-memory) CD4+ T cells isolated from Apoe–/– or B6 mice. No antigen was added. Average of 3 independent experiments. (B and C) Aortic TCRβ+ T cell proliferation was analyzed by i.p. BrdU injection 24 and 12 hours prior to collection of aortas. Aortas of B6 (n = 4) and Apoe–/– (n = 8) mice after 15 weeks of WD feeding were digested and stained for aorta-infiltrating cells. Numbers indicate percentage in each quadrant. Data are mean ± SEM. *P < 0.05.
Figure 7
Figure 7. oxLDL and mmLDL uptake and foam cell formation in mouse CD11b+ aortic macrophages.
Uptake of oxLDL (A) or mmLDL (E), CD36, and MHCII expression in CD11b+ macrophages in explanted aortas cultured with OTII T cells in the presence or absence of OVA323–339. Shown are representative experiments. Average ± SEM oxLDL (B) or mmLDL (F) uptake in 3 independent experiments. oxLDL (C) and mmLDL (G) in CD11b+ aortic macrophages, measured in the presence of OVA323–339 with (open histograms) or without (filled filled histograms) MHCII blocking antibody. Shown are representative experiments. CD11b+ cells taking up oxLDL (D) or mmLDL (H) in explanted aortas from Apoe–/–CD11c-YFP+ mice cultured with OTII T cells in the presence of OVA323–339 with or without anti-MHCII antibody. Data (mean ± SEM) are expressed as a percentage of the untreated value. *P < 0.05.
Figure 8
Figure 8. Depletion of CD11bCD11c+ cells in the mouse aorta decreases oxLDL uptake.
(A). DT was injected into Apoe–/–Cd11c-DTR+ bone marrow chimeric mice fed WD for 12 weeks during the last 2 weeks of WD feeding. Aortas was harvested, digested, and stained for CD11b and CD11c. Percentage (A) and absolute number (B) of live CD45+ CD11b+CD11c, CD11b+CD11c+, and CD11bCD11c+ cells in aortas from Apoe–/–Cd11c-DTR+ mice injected with DT (n = 5) or vehicle control (n = 5). (C) Percent CD11b+ cells taking up oxLDL in explanted aortas from 24-hour CD11c-depleted and nondepleted Apoe–/–Cd11c-DTR+ mice cultured with OTII T cells in the presence of OVA323–339. Data (average of 3 independent experiments) are expressed as a percentage of oxLDL uptake in the absence of CD11c depletion. (D) Expression of Il6 and Il12p35, as determined by real-time PCR, in aortas of mice as in A. Data are mean ± SEM. *P < 0.05.

References

    1. Weber C, Zernecke A, Libby P. The multifaceted contributions of leukocyte subsets to atherosclerosis: lessons from mouse models. Nat Rev Immunol. 2008;8(10):802–815. doi: 10.1038/nri2415. - DOI - PubMed
    1. Andersson J, Libby P, Hansson GK. Adaptive immunity and atherosclerosis. Clin Immunol. 2010;134(1):33–46. doi: 10.1016/j.clim.2009.07.002. - DOI - PubMed
    1. Galkina E, Ley K. Immune and inflammatory mechanisms of atherosclerosis. Annu Rev Immunol. 2009;27:165–197. doi: 10.1146/annurev.immunol.021908.132620. - DOI - PMC - PubMed
    1. Stoneman V, et al. Monocyte/macrophage suppression in CD11b diphtheria toxin receptor transgenic mice differentially affects atherogenesis and established plaques. Circ Res. 2007;100(6):884–893. doi: 10.1161/01.RES.0000260802.75766.00. - DOI - PMC - PubMed
    1. Mantovani A, Garlanda C, Locati M. Macrophage diversity and polarization in atherosclerosis: a question of balance. Arterioscler Thromb Vasc Biol. 2009;29(10):1419–1423. doi: 10.1161/ATVBAHA.108.180497. - DOI - PubMed

Publication types

MeSH terms