. 2012 Sep;122(9):3088-100.
doi: 10.1172/JCI62129. Epub 2012 Aug 13.

A metabolic prosurvival role for PML in breast cancer

Affiliations

A metabolic prosurvival role for PML in breast cancer

Arkaitz Carracedo et al. J Clin Invest. 2012 Sep.

Abstract

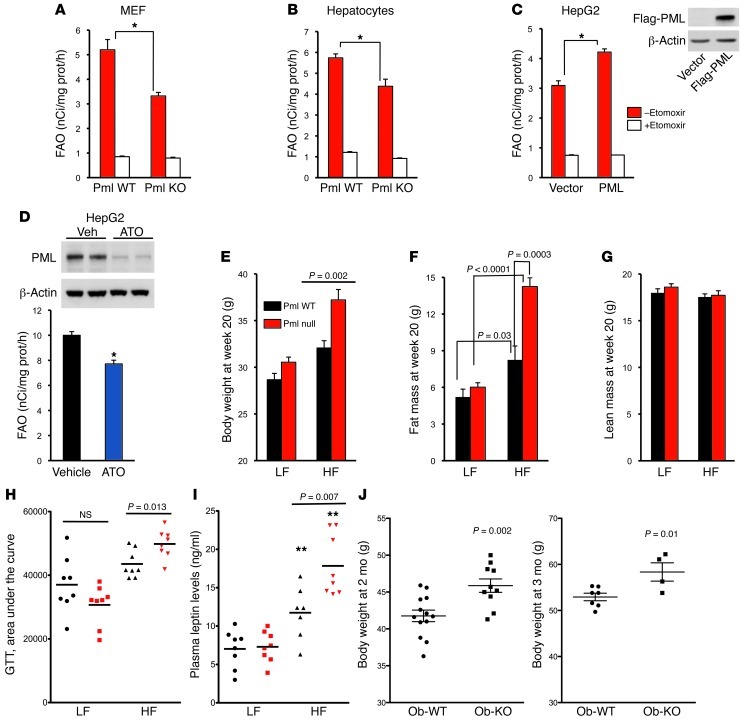
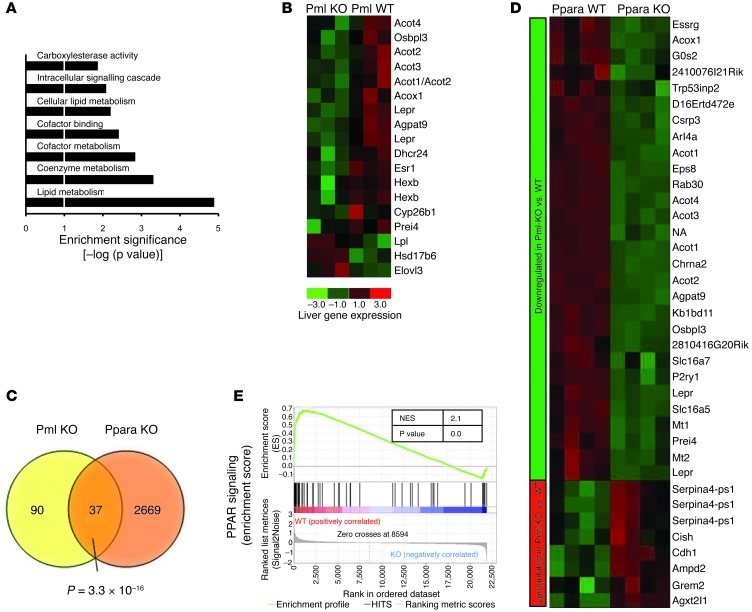
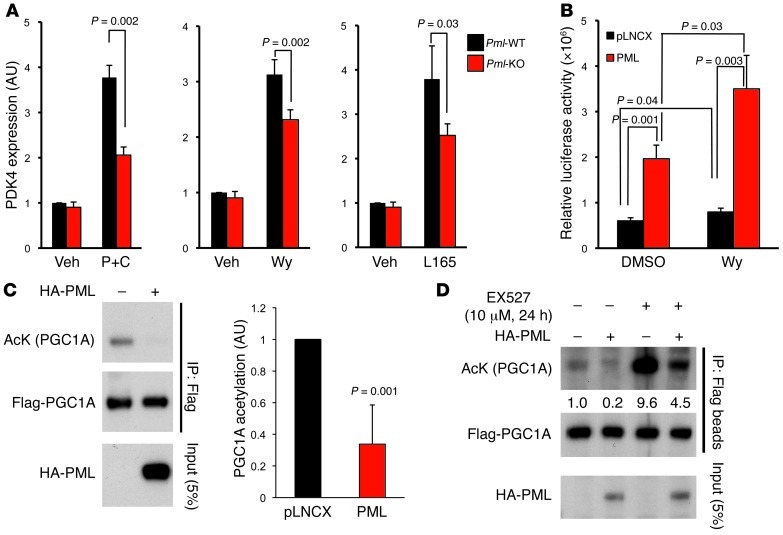
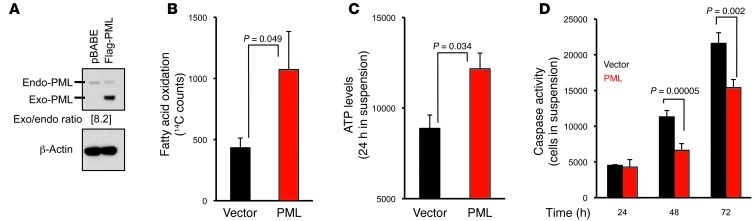
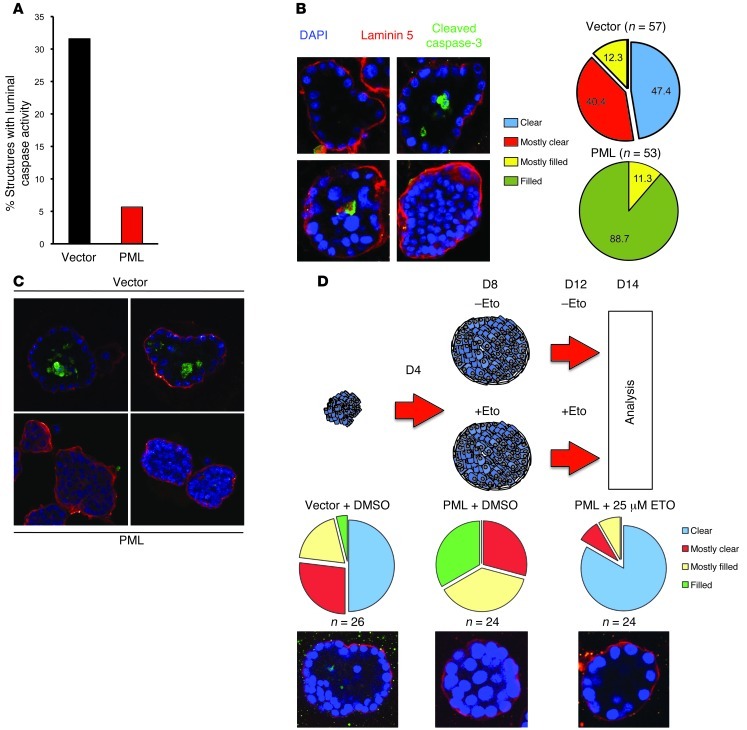
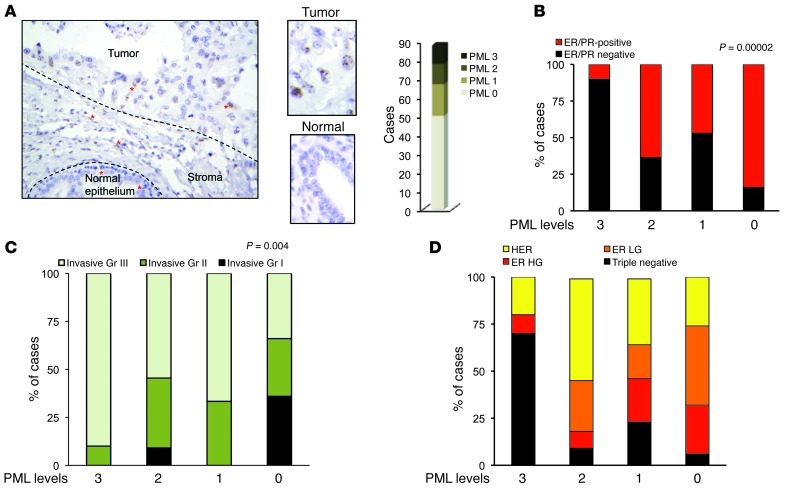
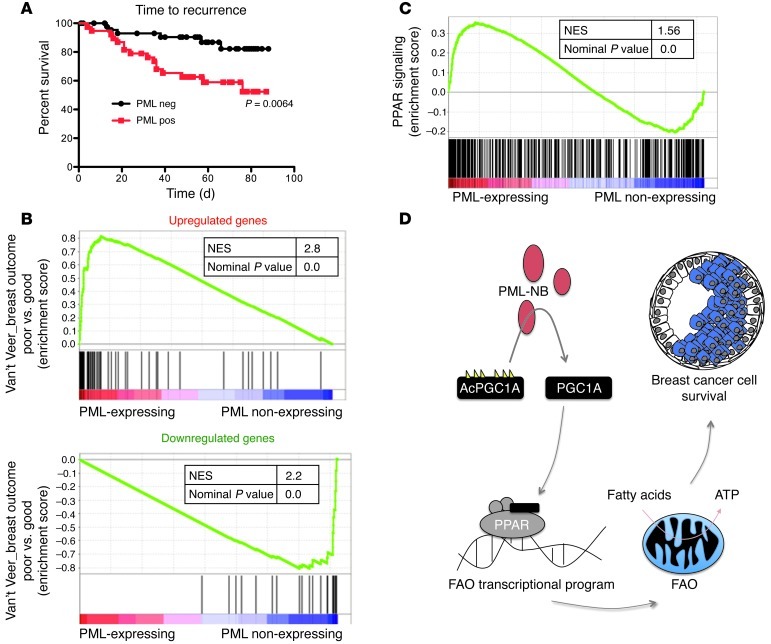
Cancer cells exhibit an aberrant metabolism that facilitates more efficient production of biomass and hence tumor growth and progression. However, the genetic cues modulating this metabolic switch remain largely undetermined. We identified a metabolic function for the promyelocytic leukemia (PML) gene, uncovering an unexpected role for this bona fide tumor suppressor in breast cancer cell survival. We found that PML acted as both a negative regulator of PPARγ coactivator 1A (PGC1A) acetylation and a potent activator of PPAR signaling and fatty acid oxidation. We further showed that PML promoted ATP production and inhibited anoikis. Importantly, PML expression allowed luminal filling in 3D basement membrane breast culture models, an effect that was reverted by the pharmacological inhibition of fatty acid oxidation. Additionally, immunohistochemical analysis of breast cancer biopsies revealed that PML was overexpressed in a subset of breast cancers and enriched in triple-negative cases. Indeed, PML expression in breast cancer correlated strikingly with reduced time to recurrence, a gene signature of poor prognosis, and activated PPAR signaling. These findings have important therapeutic implications, as PML and its key role in fatty acid oxidation metabolism are amenable to pharmacological suppression, a potential future mode of cancer prevention and treatment.


Figures

Figure 1
Figure 1. PML regulates FAO and predisposition to obesity.
(AC) FAO levels in Pml-WT and -KO primary MEFs (A, n = 3) and primary hepatocytes (B, 4–5 independent hepatocyte cultures) and in HepG2 cells acutely infected with an empty or a PML-expressing retrovirus (C, from 2 independent infections; FAO was measured in triplicate for each infection. Representative Western blot for PML overexpression is shown). Etomoxir 100 μM. Representative experiments are shown. (D) FAO levels in HepG2 cells treated with vehicle or ATO (1 μM) for 72 hours (n = 4, a representative experiment is shown, right panel indicates PML levels [anti-PML] by Western blot using β-actin as endogenous control). (EI) Body weight (E), fat mass (F), lean mass (G), GTT (H), and serum leptin levels (I) in Pml-WT (black bars/symbols) and Pml-KO (red bars/symbols) mice subjected to a control (LF) or HFD (HF) (n = 8). (J) Body weight in Pml-WT and Pml-KO LepOb/Ob female mice of the indicated age. *P < 0.05. Error bars in AD represent mean ± SD; error bars in EG represent mean ± SEM.
Figure 2
Figure 2. PML loss is associated with defects in PPAR signaling and lipid metabolism.
(A) GO processes differentially affected in microarray analysis from Pml-WT and -KO liver extracts (n = 3). (B) Heat map depicting genes related to lipid metabolism from A differentially modulated in Pml-WT and -KO liver extracts. (CE) Venn diagram (C), heat map depicting genes differentially expressed (D), and GSEA (E; the enrichment is depicted by nominal P value and NES) in Pml-WT and -KO (A and B) and in Ppara-WT and -KO (see Methods) liver extract microarray that are found coregulated. P value in C indicates significance by Fisher’s exact test. Green and red colors in D represent downregulated and upregulated genes, respectively, whereas the left lateral bar depicts the status of these genes in Pml-KO vs. -WT liver extract microarray (green, downregulated in Pml-KO; red, upregulated in Pml-KO).
Figure 3
Figure 3. PML regulates PPAR signaling and PGC1A acetylation.
(A) Real-time PCR analysis of Pdk4 in transformed (Ras-E1A) MEFs treated overnight with palmitate and carnitine (P+C) (100 μM and 1 mM, respectively, n = 7), Wy14643 (100 μM, n = 3), and L165041 (10 μM, n = 4) using Glucuronidase B as endogenous control. Error bars represent mean ± SEM. P value indicates statistical significance by t test. (B) PPAR luciferase reporter activity in HEK293 cells transfected with pLNCX or pLNCX-PMLIV vector upon treatment with vehicle or Wy14643 (50 μM) (n = 3). Error bars indicate mean ± SD. (C) Western Blot for detection of PGC1A acetylation in PGC1A immunoprecipitates from U2OS cells transfected with empty or PMLIV-expressing vectors (n = 4); right panel shows the quantification from 4 independent experiments. Error bars indicate mean ± SD. (D) Western blot for detection of PGC1A acetylation in PGC1A immunoprecipitates from U2OS cells transfected with empty or PMLIV-expressing vectors and treated with vehicle or the SIRT1 inhibitor EX527 (10 μM, 24 hours).
Figure 4
Figure 4. PML expression promotes FAO, ATP production, and cell survival in MCF10A cells.
(A) Representative Western blot showing Flag-PMLIV expression by anti-Flag antibody in MCF10A cells infected with an empty (pBABE) or PMLIV-expressing (pBABE-Flag-PML) retroviral vector. (BD) FAO (24 hours; B), ATP levels (C), and caspase activity (D) at the indicated time points in detached MCF10A cells from A.
Figure 5
Figure 5. PML expression promotes luminal filling in MCF10A cells in an FAO-dependent manner.
(A) Caspase-3 positivity in 3D basement cultures of MCF10A cells (day 10 of culture) transduced with an empty or PMLIV-expressing retrovirus. (B) Representative fluorescence images (upper panels) used as criteria for quantification of luminal filling of MCF10A cells from Figure 4 (lower panels) cultured in Matrigel for 10 days. (C) Representative images of MCF10A cells from Figure 4 cultured in Matrigel for 12 days (as in B; from an independent 3D culture). (D) Representative scheme of the treatment procedure of MCF10A cells with etomoxir in the 3D model. Lower panels show the quantification of luminal filling after a total of 14 days (6-day treatment with 25 μM etomoxir). Original magnification, ×400.
Figure 6
Figure 6. PML is overexpressed in a subset of breast cancers.
(A) Representative image depicting PML immunoreactivity levels in normal breast epithelium and breast tumor cells (dashed lines delimit the different areas in the field; red asterisks indicate representative PML staining in each cell type). High magnification of a different field from the same slide is shown in central panels. Histogram in right panels shows the number of cases for each group with different PML expression levels by IHC (scoring criteria in Supplemental Figure 4). Original magnification, ×400 (left panel); ×1800 (central panels). (BD) Status of ER/PR (B), invasive tumor grade (Gr) (C), and gene expression subtype (D) in the samples analyzed. Modified Scarff-Bloom-Richardson grade scale (82): I, low grade; II, intermediate grade; III, high grade. P value reflects χ2 statistical significance in the correlation analysis. HG, high grade; LG, low grade.
Figure 7
Figure 7. PML overexpression correlates with reduced disease-free survival and poor prognosis in breast cancer.
(A) Time to recurrence in the group of patients harboring PML-expressing vs. nonexpressing tumors. P value indicates the statistical significance by log-rank (Mantel-Cox) test. (B) GSEA analysis in PML-expressing vs. nonexpressing tumors shows a significant enrichment in poor-prognosis signature in PML-expressing tumors and a good-prognosis signature in nonexpressing tumors using the signature defined by van ‘t Veer et al. (60). The enrichment is depicted by nominal P value and NES. (C) GSEA analysis in PML-expressing vs. nonexpressing tumors shows a significant enrichment in activated Ppara signaling (top 500 Ppara-KO downregulated genes) in PML-expressing tumors. The enrichment is depicted by nominal P value and NES. (D) Schematic representation summarizing the main findings in this study. Briefly, PML increases the fraction of deacetylated PGC1A (AcPGC1A and PGC1A represent the acetylated and deacetylated portion of the protein, respectively) and leads to the activation of PPAR signaling and FAO. In turn, FAO increases ATP levels and promotes cell survival and luminal filling in breast cancer, indicating that in these conditions, PML provides a selective advantage in breast cancer.

References

    1. Vander Heiden MG, Cantley LC, Thompson CB. Understanding the Warburg effect: the metabolic requirements of cell proliferation. Science. 2009;324(5930):1029–1033. doi: 10.1126/science.1160809. - DOI - PMC - PubMed
    1. Koppenol WH, Bounds PL, Dang CV. Otto Warburg’s contributions to current concepts of cancer metabolism. Cancer. 2011;11(5):325–337. - PubMed
    1. Locasale JW, Cantley LC. Metabolic flux and the regulation of Mammalian cell growth. Cell Metab. 2011;14(4):443–451. doi: 10.1016/j.cmet.2011.07.014. - DOI - PMC - PubMed
    1. Hanahan D, Weinberg RA. Hallmarks of cancer: the next generation. Cell. 2011;144(5):646–674. doi: 10.1016/j.cell.2011.02.013. - DOI - PubMed
    1. Bernardi R, Pandolfi PP. Structure, dynamics and functions of promyelocytic leukaemia nuclear bodies. Nat Rev Mol Cell Biol. 2007;8(12):1006–1016. doi: 10.1038/nrm2277. - DOI - PubMed

Publication types

MeSH terms

Substances