. 2013 Jan;28(1):22-34.
doi: 10.1002/jbmr.1734.

Peripheral leptin regulates bone formation

Affiliations

Peripheral leptin regulates bone formation

Russell T Turner et al. J Bone Miner Res. 2013 Jan.

Abstract

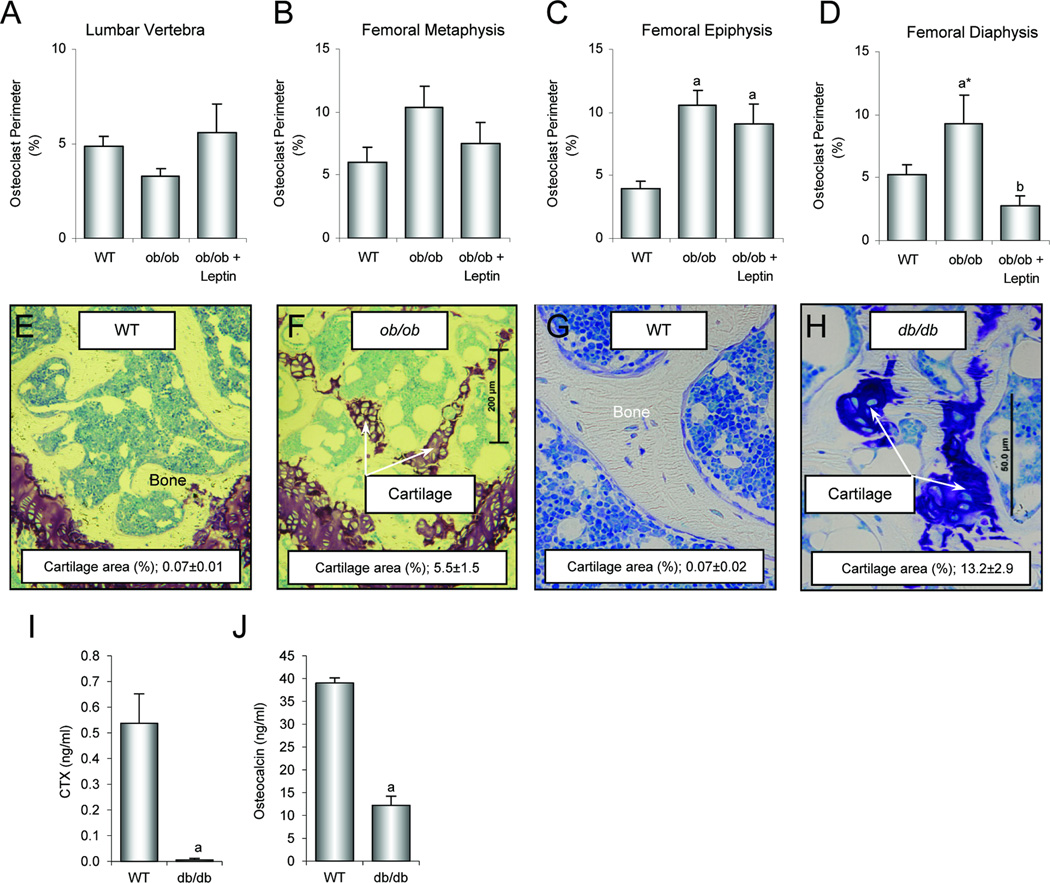
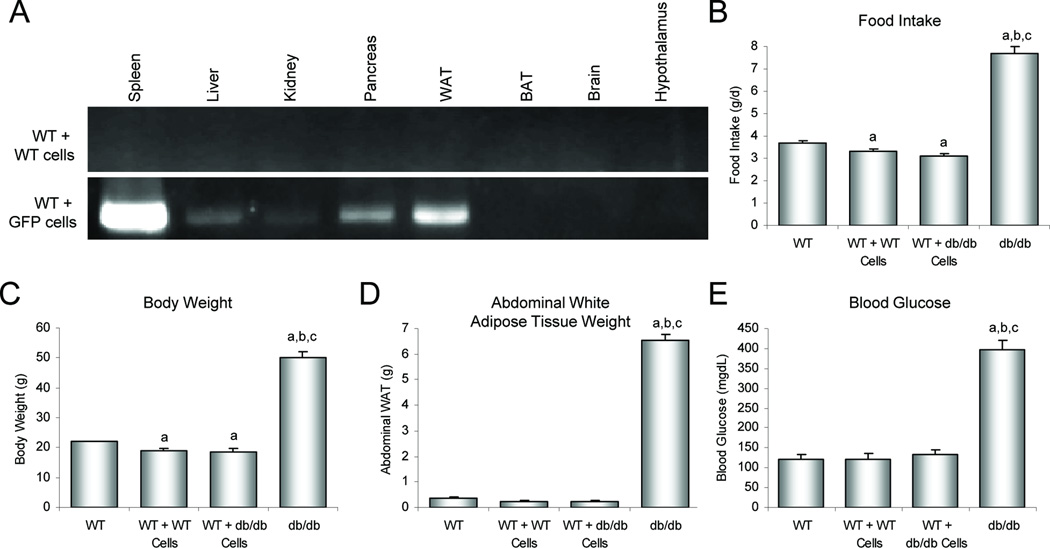
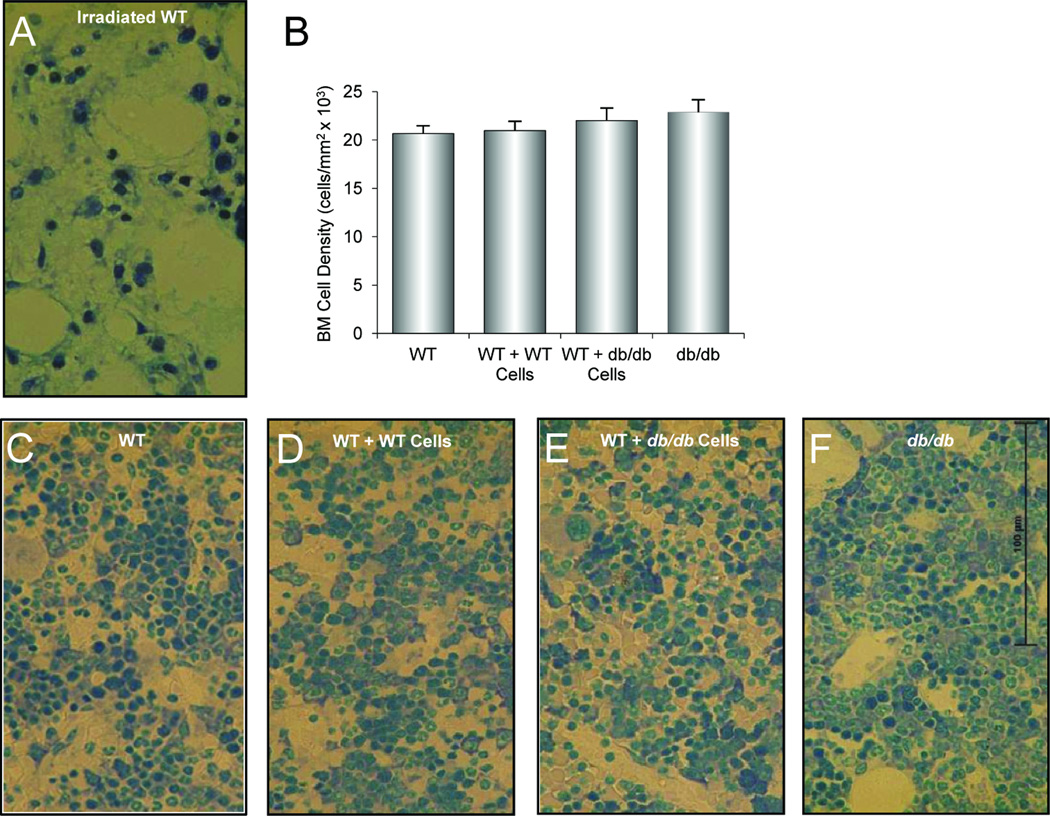
Substantial evidence does not support the prevailing view that leptin, acting through a hypothalamic relay, decreases bone accrual by inhibiting bone formation. To clarify the mechanisms underlying regulation of bone architecture by leptin, we evaluated bone growth and turnover in wild-type (WT) mice, leptin receptor-deficient db/db mice, leptin-deficient ob/ob mice, and ob/ob mice treated with leptin. We also performed hypothalamic leptin gene therapy to determine the effect of elevated hypothalamic leptin levels on osteoblasts. Finally, to determine the effects of loss of peripheral leptin signaling on bone formation and energy metabolism, we used bone marrow (BM) from WT or db/db donor mice to reconstitute the hematopoietic and mesenchymal stem cell compartments in lethally irradiated WT recipient mice. Decreases in bone growth, osteoblast-lined bone perimeter and bone formation rate were observed in ob/ob mice and greatly increased in ob/ob mice following subcutaneous administration of leptin. Similarly, hypothalamic leptin gene therapy increased osteoblast-lined bone perimeter in ob/ob mice. In spite of normal osteoclast-lined bone perimeter, db/db mice exhibited a mild but generalized osteopetrotic-like (calcified cartilage encased by bone) skeletal phenotype and greatly reduced serum markers of bone turnover. Tracking studies and histology revealed quantitative replacement of BM cells following BM transplantation. WT mice engrafted with db/db BM did not differ in energy homeostasis from untreated WT mice or WT mice engrafted with WT BM. Bone formation in WT mice engrafted with WT BM did not differ from WT mice, whereas bone formation in WT mice engrafted with db/db cells did not differ from the low rates observed in untreated db/db mice. In summary, our results indicate that leptin, acting primarily through peripheral pathways, increases osteoblast number and activity.


Conflict of interest statement

Disclosure: All authors state that they have no conflict of interest.

Figures

Figure 1
Figure 1
Evolving models for action of leptin on bone. Panel A, Ducy model in which adipocyte-derived leptin indirectly inhibits bone formation by acting through a hypothalamic relay. Panal B, Burguera/Hamrick model in which local skeletal effects of leptin result from anabolic actions of peripheral leptin and antiosteogenic actions of hypothalamic leptin. Panel C, our model indicating that leptin directly increases bone growth, osteoblast number and function, as well as osteoclast function. These physiological actions of the hormone are largely mediated through peripheral leptin signaling. Solid arrows are indicative of major route of action. The question mark indicates that mediation of the leptin-dependent increase in osteoclast activity by the osteoblast is speculative.
Figure 2
Figure 2
Subcutaneous administration of leptin increases bone formation and longitudinal bone growth in ob/ob mice. Panels A-D, bone formation rate at representative skeletal sites in WT, ob/ob, and leptin-treated ob/ob mice. Panels E-G, representative histological sections of lumbar vertebra showing fluorochrome labels. Note the higher calcein double-labeled bone perimeter (2nd and 3rd labels) in WT mice (E) and leptin-treated ob/ob mice (G) compared to ob/ob mice (F). The yellow declomycin label is also present but its lack of close correspondence to the twin calcein labels in WT mice is indicative of label escape (26). We therefore used the two calcein labels for calculation of bone formation parameters. Panels H-K, osteoblast-lined bone perimeter at representative skeletal sites in WT, ob/ob, and leptin-treated ob/ob mice. Panels L-N, representative tetrachrome-stained histological sections of lumbar vertebra showing osteoblasts. Note the higher osteoblast-lined bone perimeter in WT mice (L) and leptin-treated ob/ob mice (N) compared to ob/ob mice (M). Panel O, longitudinal growth rate in WT, ob/ob, and leptin-treated ob/ob mice in distal femur metaphysis. Panels P-R, representative histological sections of growth plate in distal femur metaphysis. Distance between opposing arrows reflects longitudinal growth rate. Data are mean ± SE. aDifferent from WT, P<0.05, a*P<0.1; bDifferent from ob/ob, P<0.05.
Figure 3
Figure 3
Deficiency in either leptin or leptin receptor results in impaired bone resorption. Panels A-D, osteoclast-lined bone perimeter at representative skeletal sites in WT, ob/ob, and leptin-treated ob/ob mice. Note that leptin deficiency is not associated with a reduction in osteoclast-lined bone perimeter. Panels E-H, representative toluidine blue-stained histological sections from the femoral epiphysis showing dramatic increases in calcified cartilage matrix encased within bone matrix in leptin signaling-deficient mice. This finding provides strong evidence for a defect in osteoclast function. Panels I-J, serum levels of the bone resorption marker C terminal telopeptide of type I collagen (CTX), and the bone formation marker osteocalcin in WT and db/db mice. Note the drastically lower CTX and osteocalcin levels in the db/db mice compared to WT mice.
Figure 4
Figure 4
Hypothalamic leptin gene therapy restores bone parameters in lumbar vertebrae of ob/ob mice to WT levels. Hypothalamic gene therapy restored bone architecture (A-D) and osteoblast-lined bone perimeter (E) to values that did not differ from those of WT mice. In contrast, neither leptin deficiency nor leptin gene therapy influenced osteoclast-lined bone perimeter (F). These findings provide strong evidence that the decrease in bone volume induced by hypothalamic leptin is not due to reduced bone formation. Data are mean ± SE. aDifferent from WT, P<0.05; bDifferent from ob/ob + rAAV-GFP, P<0.05.
Figure 5
Figure 5
Transplantation of bone marrow from GFP mice into lethally irradiated WT mice results in tissue-specific distribution of GFP expressing cells. Note that following marrow transplantation, GFP expressing bone marrow cells were present in spleen, liver, kidney, pancreas, and white adipose tissue (WAT) but were not detected in brown adipose tissue (BAT), brain or hypothalamus (A). Transplantation of db/db cells into WT (db→WT) mice had no effect on measures of energy metabolism (food intake, body weight, abdominal white adipose tissue weight) or blood glucose (B-E).
Figure 6
Figure 6
Transplantation of bone marrow from WT and leptin receptor-deficient db/db mice into lethally irradiated WT mice restores normal bone marrow cell density. Drastic reductions in bone marrow cellularity are observed 3 days following exposure to high-dose radiation in a mouse not receiving bone marrow transplantation (A). Transplantation of WT cells into WT (WT→WT) mice and db/db cells into WT (db→WT) mice resulted in normal cell bone marrow cell density (B). Representative histological sections of the bone marrow in WT, WT→WT, db→WT and db/db mice showing normal cellularity 9 weeks following marrow transplantation (C-F). Data are mean ± SE.
Figure 7
Figure 7
Transplantation of bone marrow from WT mice into lethally irradiated WT mice restores normal bone formation whereas transplantation of marrow cells from db/db mice into WT mice results in lower bone formation. Note the reduction of bone formation rate in db→WT mice at all skeletal sites examined (A-D). Panels E-H, representative histological sections of lumbar vertebra showing fluorochrome labels. Note the higher double-labeled bone perimeter (arrows) in untreated WT mice (E) and WT→WT mice (F) compared to db→WT mice (G) and db/db mice (H). Data are mean ± SE. aDifferent from WT, P<0.05, a*P<0.1; bDifferent from WT→WT cells, P<0.05. b*P<0.1.

Comment in

References

    1. Wong IP, Zengin A, Herzog H, Baldock PA. Central regulation of bone mass. Semin Cell Dev Biol. 2008;19(5):452–458. - PubMed
    1. Ducy P, Amling M, Takeda S, Priemel M, Schilling AF, Beil FT, Shen J, Vinson C, Rueger JM, Karsenty G. Leptin inhibits bone formation through a hypothalamic relay: a central control of bone mass. Cell. 2000;100(2):197–207. - PubMed
    1. Takeda S, Elefteriou F, Levasseur R, Liu X, Zhao L, Parker KL, Armstrong D, Ducy P, Karsenty G. Leptin regulates bone formation via the sympathetic nervous system. Cell. 2002;111(3):305–317. - PubMed
    1. Graham S, Hammond-Jones D, Gamie Z, Polyzois I, Tsiridis E. The effect of beta-blockers on bone metabolism as potential drugs under investigation for osteoporosis and fracture healing. Expert Opin Investig Drugs. 2008;17(9):1281–1299. - PubMed
    1. Trivedi R, Goswami R, Chattopadhyay N. Investigational anabolic therapies for osteoporosis. Expert Opin Investig Drugs. 2010;19(8):995–1005. - PubMed

Publication types

MeSH terms