. 2012 Oct;30(10):2100-13.
doi: 10.1002/stem.1193.

ALDH1A isozymes are markers of human melanoma stem cells and potential therapeutic targets

Affiliations

ALDH1A isozymes are markers of human melanoma stem cells and potential therapeutic targets

Yuchun Luo et al. Stem Cells. 2012 Oct.

Abstract

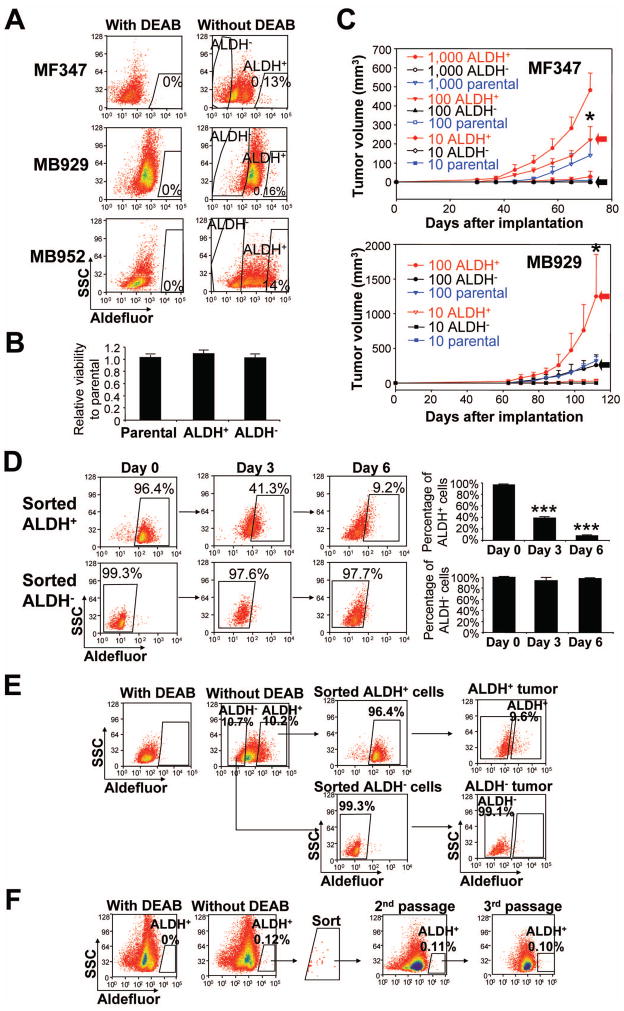
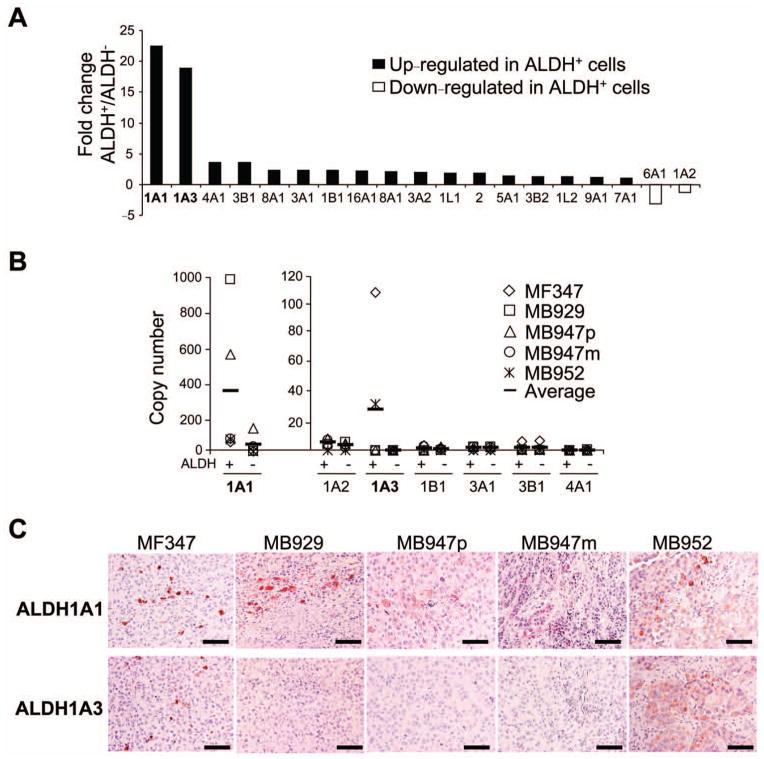
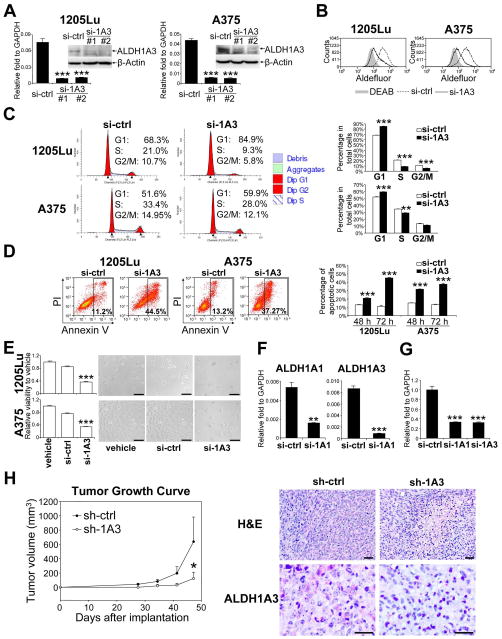
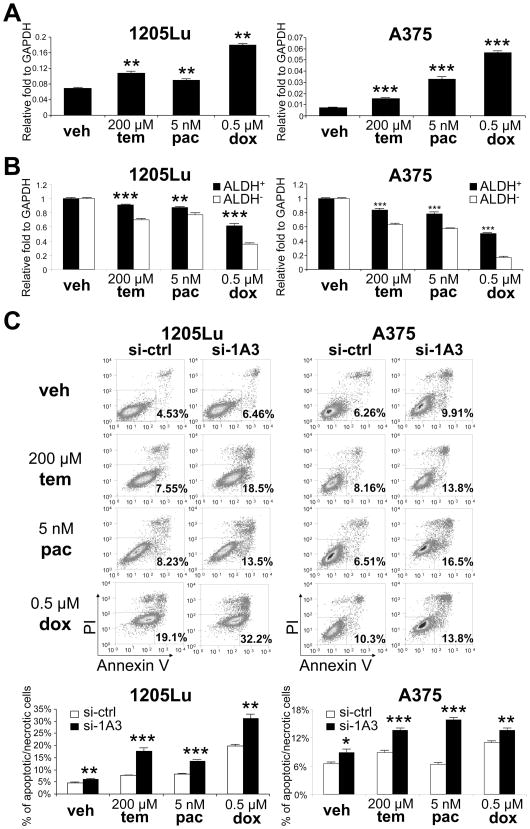
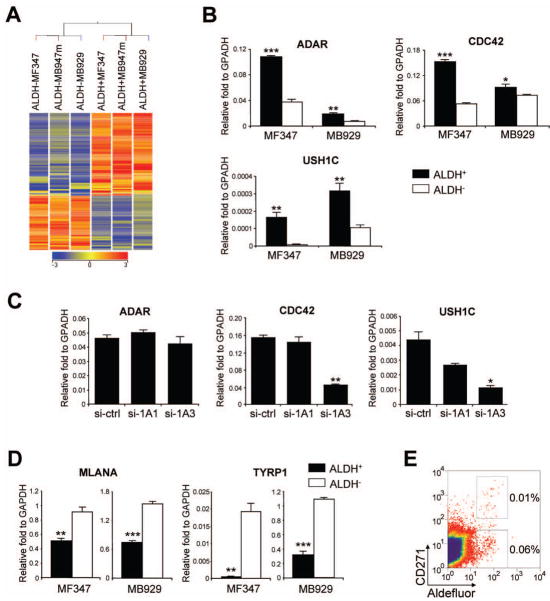
Although the concept of cancer stem cells (CSCs) is well-accepted for many tumors, the existence of such cells in human melanoma has been the subject of debate. In this study, we demonstrate the existence of human melanoma cells that fulfill the criteria for CSCs (self-renewal and differentiation) by serially xenotransplanting cells into nonobese diabetic/severe combined immunodeficiency (NOD/SCID) mice. These cells possess high aldehyde dehydrogenase (ALDH) activity with ALDH1A1 and ALDH1A3 being the predominant ALDH isozymes. ALDH-positive melanoma cells are more tumorigenic than ALDH-negative cells in both NOD/SCID mice and NSG mice. Biological analyses of the ALDH-positive melanoma cells reveal the ALDH isozymes to be key molecules regulating the function of these cells. Silencing ALDH1A by siRNA or shRNA leads to cell cycle arrest, apoptosis, decreased cell viability in vitro, and reduced tumorigenesis in vivo. ALDH-positive melanoma cells are more resistant to chemotherapeutic agents and silencing ALDH1A by siRNA sensitizes melanoma cells to drug-induced cell death. Furthermore, we, for the first time, examined the molecular signatures of ALDH-positive CSCs from patient-derived tumor specimens. The signatures of melanoma CSCs include retinoic acid (RA)-driven target genes with RA response elements and genes associated with stem cell function. These findings implicate that ALDH isozymes are not only biomarkers of CSCs but also attractive therapeutic targets for human melanoma. Further investigation of these isozymes and genes will enhance our understanding of the molecular mechanisms governing CSCs and reveal new molecular targets for therapeutic intervention of cancer.


Conflict of interest statement

DISCLOSURE OF POTENTIAL CONFLICTS OF INTEREST

The authors disclosed no potential conflicts of interest.

Figures

Figure 1
Figure 1
ALDH+ human melanoma cells possess cancer stem cell properties. (A) Representative Aldefluor® analysis in primary (MF347) and metastatic (MB929 and MB952) melanomas. Control samples incubated with the inhibitor, DEAB, were used to ensure identification of ALDH+ and ALDH cells. (B) Viability of parental, ALDH+ and ALDH cells in vitro. Sorted parental, ALDH+ and ALDH cells from xenografted MB347 tumor were cultured in RPMI-1640 medium with 10% fetal bovine serum, and analyzed by CellTiter 96® AQueous One Solution Cell Proliferation Assay 5 days later. (C) Tumorigenesis of xenografted patient tumors (MF347 and MB929) in NOD/SCID mice. Tumor growth curves were plotted for the numbers of engrafted cells (1000, 100, and 10 cells) and for each subpopulation (ALDH+, ALDH and parental). Red and black arrows depict tumor growth from 100 ALDH+ cells and 100 ALDH cells, respectively. Data represent mean ± SEM (n=4). *, P < 0.05 compared with ALDH. (D) Differentiation of ALDH+ and ALDH cells in vitro. Sorted ALDH+ and ALDH cells from xenografted MB1009 tumor were cultured in RPMI-1640 medium with 10% fetal bovine serum, and analyzed by Aldefluor® assay on days 0 (immediately after sorting), 3 and 6. Left panel, representative FACS analysis. Right panel, percentage of ALDH+ (upper) and ALDH (lower) cells on days 0, 3 and 6. ***, P < 0.001 compared with Day 0. (E) Differentiation of ALDH+ and ALDH cells in vivo. Sorted ALDH+ and ALDH cells from xenografted MB1009 tumor were implanted into NOD/SCID mice and the developing tumors from ALDH+ cells (ALDH+ tumor) and those from ALDH cells (ALDH+ tumor) were analyzed by Aldefluor® assay. (F) Serial transplantation of ALDH+ cells from xenografted MF347 tumor. One thousand ALDH+ cells were implanted each time in NOD/SCID mice and the developing tumors were analyzed by Aldefluor® assay.
Figure 2
Figure 2
Expression of ALDH isoforms in human melanoma tumors. (A) Fold change in 19 ALDH isoforms in ALDH+ cells relative to ALDH cells by microarray analysis. Xenografted patient tumors (MF347, MB929 and MB947m) were analyzed. Isoforms with fold change > 15.0 are emphasized in bold. (B) Copy number of representative human ALDH isoforms analyzed by qRT-PCR. mRNAs of ALDH+ and ALDH subpopulations obtained from xenografted patient tumors (MF347, MB929, MB947p, MB947m and MB952) were analyzed. Copy number was counted and determined by standard curve analysis. (C) Immunohistochemistry of ALDH1A1 (upper panel) and ALDH1A3 (lower panel) in representative melanoma specimen from patients. Scale bar = 100 μm.
Figure 3
Figure 3
Biological effect of silencing ALDH1A in ALDH+ human melanoma cells. (A) Levels of ALDH1A3 mRNA after siRNA transfection in ALDH+ cells from1205Lu (left panel) and A375 (right panel) cells. GAPDH and β-actin were used as internal controls for qRT-PCR and Western blot analysis, respectively. Two specific siRNAs (#1 and #2) were used. si-ALDH1A3-#1 (si-1A3-#1) was used for the rest of experiments (Figure 3, B–G). Data represent mean ± SEM (n=3). ***, P < 0.001 compared with control siRNA (si-ctrl). (B) Aldefluor® analysis 72 hours after silencing ALDH1A3 in ALDH+1205Lu and ALDH+A375 melanoma cells. Gray shadow, DEAB control; dashed line, control siRNA (si-ctrl); solid line, ALDH1A3 siRNA (si-1A3). (C) Cell cycle analysis of ALDH+1205Lu and ALDH+A375 cells at 48 hours after silencing ALDH1A3. Left panel, representative histograms. Right panel, percentage of cells. G1, Gap1 phase; S, Synthesis phase; G2/M, Gap2 or Mitosis phase. Data represent mean ± SEM (n=3). **, P < 0.01; ***, P < 0.001 compared with si-ctrl. (D) Apoptotic cell death of ALDH+1205Lu and ALDH+A375 cells after ALDH1A3 knockdown. Left panel, representative FACS analysis at 72 hours. Annexin V-positive cells were gated as apoptotic. Right panel, Annexin V-positive apoptotic cells at 48 and 72 hours. Data represent mean ± SEM (n=3). ***, P < 0.001 compared with control si-ctrl. (E) Cell viability analysis (left panel) and bright-field microscopic images (right panel) of ALDH+1205Lu and ALDH+A375 cells 72 hours after ALDH1A3 knockdown. Viability was analyzed by CellTiter-Glo® Luminescent Cell Viability Assay. Scale bar = 100 μm. Data represent mean ± SEM (n=4). ***, P < 0.001 compared with control siRNA (si-ctrl). (F) qRT-PCR analysis of ALDH1A and ALDH1A3 mRNA after transfection of si-ALDH1A1-#1 (si-1A1) and si-ALDH1A3-#1 (si-1A3) in ALDH+ xenografted patient tumor cells from MB952 (n=3). Expression levels were normalized to GAPDH. Data represent mean ± SEM (n=3). **, P < 0.01; ***, P < 0.001 compared with control siRNA (si-ctrl). (G) Cell viability of ALDH+ MB952 cells 72 hours after ALDH1A1 and ALDH1A3 knockdown. Viability was analyzed by CellTiter-Glo® Luminescent Cell Viability Assay. Data represent mean ± SEM (n=4). ***, P < 0.001 compared with si-ctrl. (H) Left panel, tumor growth curves of transfected cells. ALDH+ 1205Lu melanoma cells were transfected with GFP-expressing plasmid: sh-control (sh-ctrl) or sh-ALDH1A3 (sh-1A3). GFP-positive cells were sorted and implanted intradermally into NOD/SCID mice. Tumor size was measured weekly. Data represent mean ± SEM (n=4). *, P < 0.05 compared with shRNA control. Right panels, representative H&E-stained tumor sections (right upper panel) and ALDH1A3-stained tumor sections (right lower panel) from ALDH+ 1205Lu cells transfected with control shRNA (sh-ctrl) and ALDH+ 1205Lu cells transfected with sh-ALDH1A3 (sh-1A3). Scale bar = 100 μm.
Figure 4
Figure 4
Drug resistance of ALDH+ and ALDH cells. (A) Levels of ALDH1A3 mRNA after treatment of 1205Lu (left panel) and A375 (right panel) cells with vehicle (veh), temozolomide (tem), paclitaxel (pac) or doxorubicin (dox). Expression levels were normalized to GAPDH. Data represent mean ± SEM (n=3). **, P < 0.01; ***, P < 0.001 compared with vehicle treatment. (B) Viability of ALDH+ and ALDH cells from 1205Lu (left panel) and A375 (right panel) cells after 48 hours of treatment with vehicle (veh), temozolomide (tem), paclitaxel (pac) or doxorubicin (dox). Viability was analyzed by CellTiter-Glo® Luminescent Cell Viability Assay. Data represent mean ± SEM (n=3). **, P < 0.01; ***, P < 0.001 compared with ALDH cells. (C) Apoptotic and necrotic cell death of ALDH+1205Lu and ALDH+A375 cells after transfection of control si-RNA (si-ctrl) or si-ALDH1A3 (si-1A3), treated with vehicle (veh), temozolomide (tem), paclitaxel (pac) or doxorubicin (dox) for 24 hours. Upper panels, representative FACS analysis. Annexin V- and/or PI-positive cells were gated as dead cells. Lower panel, Annexin V and/or PI-positive cells at 24 hours. Data represent mean ± SEM (n=3). *, P < 0.05; **, P < 0.01; ***, P < 0.001 compared with vehicle treatment.
Figure 5
Figure 5
Profiling of ALDH+ and ALDH cells. (A) Supervised hierarchical clustering of 147 differentially expressed transcripts between ALDH+ and ALDH cells from xenografted patient melanomas (MF347, MB929 and MB947m). Colored spots indicate upregulated (red) or downregulated (blue) genes from microarray analysis. (B) qRT-PCR validation of differentially expressed genes. cDNAs of ALDH+ and ALDH subpopulations were obtained from xenografted patient tumors (MF347 and MB929). Expression levels were normalized to GAPDH. Black and white bars represent expression in ALDH+ cells and ALDH cells, respectively. Data represent mean ± SEM (n=3). *, P < 0.05; **, P < 0.01; ***, P < 0.001 compared with ALDH cells. (C) qRT-PCR analysis of ADAR, CDC42, and USH1C after siRNA silencing of ALDH1A1 (si-1A1) and ALDH1A3 (si-1A3) in ALDH+ xenografted patient melanoma cells from MB952. Expression levels were normalized to GAPDH. Data represent mean ± SEM (n=3). *, P < 0.05; **, P < 0.01 compared with transfection of control siRNA (si-ctrl). (D) qRT-PCR analysis of melanocyte differentiation antigens, MLANA and TYRP1. cDNAs of ALDH+ and ALDH subpopulations were obtained from xenografted patient tumors (MF347 and MB929). Expression levels were normalized to GAPDH. Data represent mean ± SEM (n=3). **, P < 0.01; ***, P < 0.001 compared with ALDH cells. (E) Representative flow cytometric analysis of melanoma tumor (MF348) stained for CD271 and ALDH enzymatic activity.

References

    1. Reya T, Morrison SJ, Clarke MF, et al. Stem cells, cancer, and cancer stem cells. Nature. 2001;414:105–111. - PubMed
    1. Fang D, Nguyen TK, Leishear K, et al. A tumorigenic subpopulation with stem cell properties in melanomas. Cancer Res. 2005;65:9328–9337. - PubMed
    1. Monzani E, Facchetti F, Galmozzi E, et al. Melanoma contains CD133 and ABCG2 positive cells with enhanced tumourigenic potential. Eur J Cancer. 2007;43:935–946. - PubMed
    1. Schatton T, Murphy GF, Frank NY, et al. Identification of cells initiating human melanomas. Nature. 2008;451:345–349. - PMC - PubMed
    1. Boiko AD, Razorenova OV, van de Rijn M, et al. Human melanoma-initiating cells express neural crest nerve growth factor receptor CD271. Nature. 2010;466:133–137. - PMC - PubMed

Publication types

MeSH terms