. 2012 Nov;30(11):2472-86.
doi: 10.1002/stem.1198.

Mesenchymal stem cells transmigrate between and directly through tumor necrosis factor-α-activated endothelial cells via both leukocyte-like and novel mechanisms

Affiliations

Mesenchymal stem cells transmigrate between and directly through tumor necrosis factor-α-activated endothelial cells via both leukocyte-like and novel mechanisms

Grace S L Teo et al. Stem Cells. 2012 Nov.

Abstract

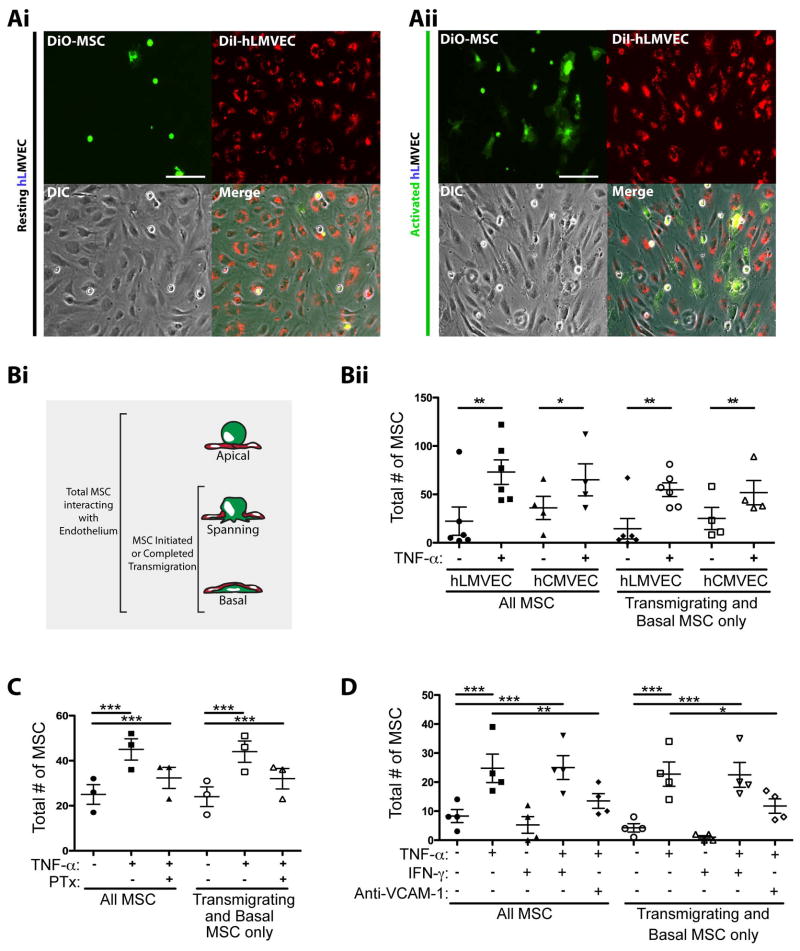
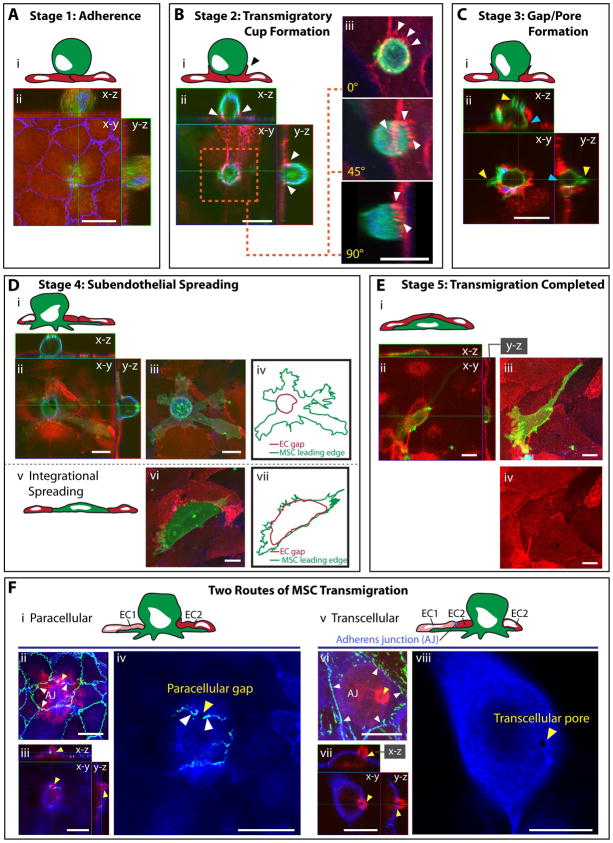
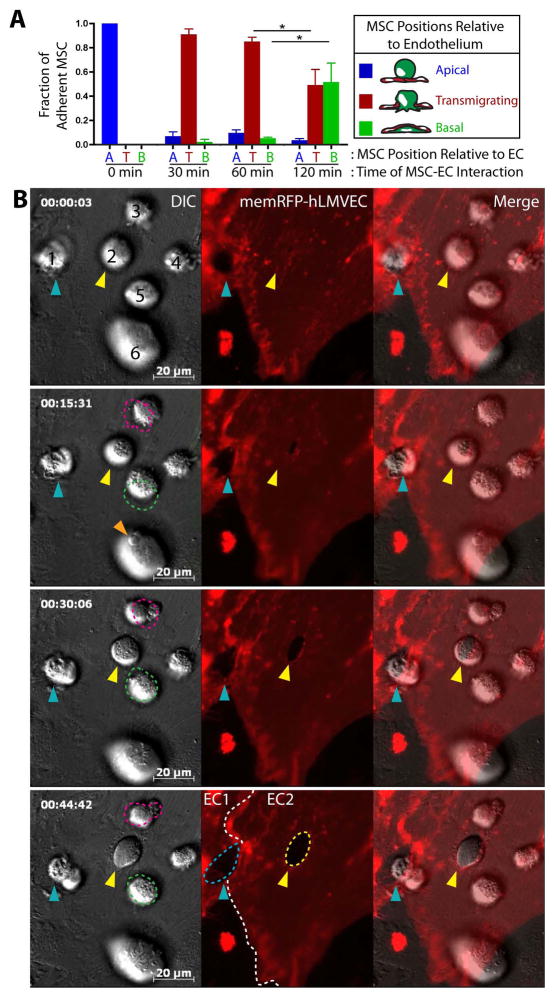
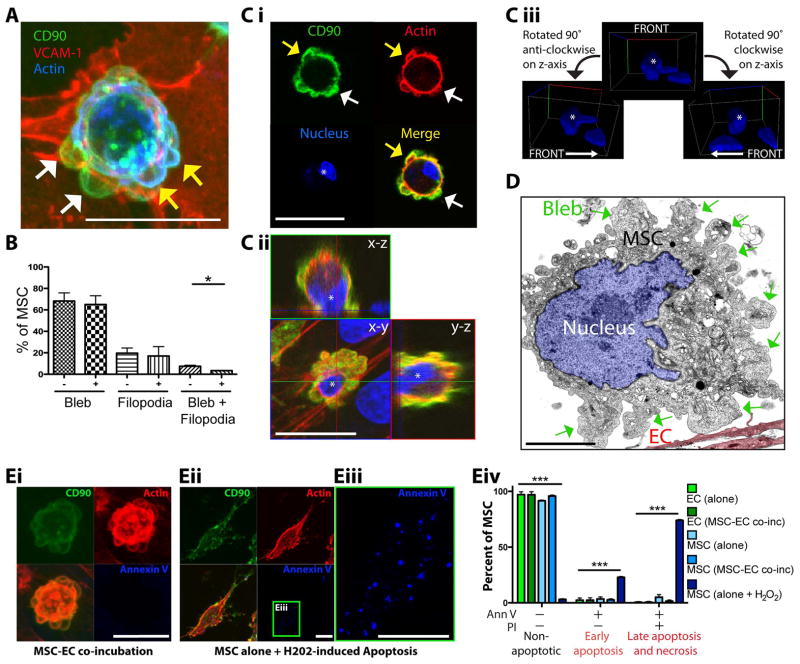
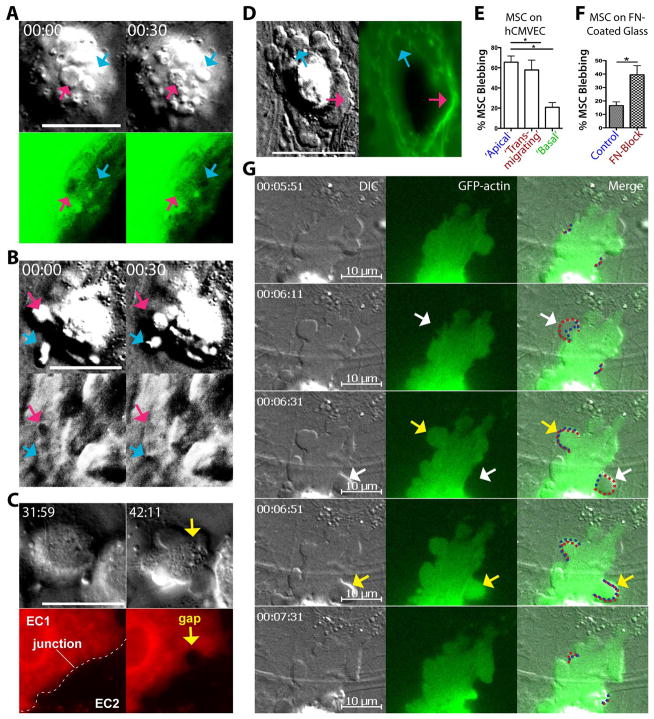
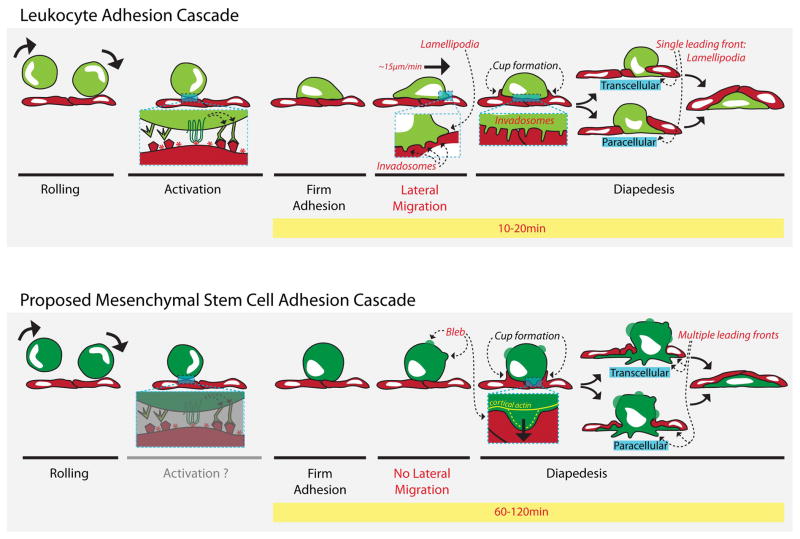
Systemically administered adult mesenchymal stem cells (MSCs), which are being explored in clinical trials to treat inflammatory disease, exhibit the critical ability to extravasate at sites of inflammation. We aimed to characterize the basic cellular processes mediating this extravasation and compare them to those involved in leukocyte transmigration. Using high-resolution confocal and dynamic microscopy, we show that, like leukocytes, human bone marrow-derived MSC preferentially adhere to and migrate across tumor necrosis factor-α-activated endothelium in a vascular cell adhesion molecule-1 (VCAM-1) and G-protein-coupled receptor signaling-dependent manner. As several studies have suggested, we observed that a fraction of MSC was integrated into endothelium. In addition, we observed two modes of transmigration not previously observed for MSC: Paracellular (between endothelial cells) and transcellular (directly through individual endothelial cells) diapedesis through discrete gaps and pores in the endothelial monolayer, in association with VCAM-1-enriched "transmigratory cups". Contrasting leukocytes, MSC transmigration was not preceded by significant lateral migration and occurred on the time scale of hours rather than minutes. Interestingly, rather than lamellipodia and invadosomes, MSC exhibited nonapoptotic membrane blebbing activity that was similar to activities previously described for metastatic tumor and embryonic germ cells. Our studies suggest that low avidity binding between endothelium and MSC may grant a permissive environment for MSC blebbing. MSC blebbing was associated with early stages of transmigration, in which blebs could exert forces on underlying endothelial cells indicating potential functioning in breaching the endothelium. Collectively, our data suggest that MSC transmigrate actively into inflamed tissues via both leukocyte-like and novel mechanisms.


Figures

Figure 1
Figure 1. MSC preferentially transmigrate through TNF-α activated lung and cardiac endothelium
(A) DiO-labeled MSC (green) were incubated on resting (i) or TNF-α activated (ii) DiI-labeled human lung microvascular endothelium (hLMVEC; red) for 60 min, followed by fixation and imaging by fluorescent and phase-contrast microscopy. Representative micrographs are shown. Scale bars represent 100 μm. (B) MSC were incubated on resting or TNF-α activated hLMVEC and hCMVEC for 60 min, followed by fixation, staining and imaging by fluorescent confocal microscopy. (i) MSC were counted and classified according to their positions relative to endothelium: Apical, Spanning or Basal. (ii) Both the total number of MSC, and the number of MSC in only the transmigrating or basal positions were compared on TNF-α activated and resting endothelium for both hLMVEC and hCMVEC. (C) MSC were incubated on resting or TNF-α activated hCMVEC for 60 min. In some cases, MSC were incubated with 100 ng/ml of pertussis toxin (PTX) for 2 h prior to be added to endothelium. As in B, both the total number of MSC, and the number of MSC in only the transmigrating positions were compared for all conditions. (D) MSC were incubated on resting, or TNF-α activated and/or IFN-γ activated hCMVEC for 60 min. In some cases, TNF-α activated endothelium was incubated with 20 μg/ml blocking antibodies against VCAM-1 for 30 min prior to the addition of MSC. Samples were fixed, stained and imaged by fluorescent confocal microscopy. As in B, both the total number of MSC, and the number of MSC in only the transmigrating or basal positions were compared for all conditions. For Bii, C and D, data were collected from at least 6 microscopic fields for each experimental condition. Values represent mean ± s.e.m.. 1, 2, or 3 asterisks indicate 3 levels statistically significant differences (p<0.05, p<0.01, and p<0.0001 respectively). For B, this was assessed by a two-tailed, paired Student’s t-test. For C and D, this was assessed by a one-way ANOVA test with a Tukey post-hoc test.
Figure 2
Figure 2. The 5 stages and 2 routes of MSC transmigration
Five distinct stages (A–E) of transmigration were consistently observed for MSC, based on previously established leukocyte morphological analysis , presented as both schematics (Ai; Bi; Ci; Di, iv, v, vii; Ei; Fi, v; see also Fig. S1) and confocal projections (Aii, Bii–iii, Cii, Dii, iii, vi; Eii–iv; Fii–iv, vi–viii). Confocal projections include top (x–y) and orthogonal (x–z and y–z) cross-sections. (A) Stage 1: Adherence. A relatively spherical MSC (CTx-B; green) is adherent to the apical surface of an intact GPNT monolayer as seen by ICAM-1(EC surface; red) and VE-cadherin (EC junctions; blue) staining. (B) Stage 2: Transmigratory Cup Formation. VCAM-1-enriched microvilli-like vertical projections (white arrows) that extend up from hLMVEC endothelium (VCAM-1; red) and form a ‘cup-like’ structure around the base of the MSC (CD90; green) at 60 min. Actin is stained in blue. 3D projections (rotated 0°, 45° and 90° about y and z axes) are shown in (iii). See also Video 1. (C) Stage 3: Gap/Pore Formation. A discrete hCMVEC endothelial discontinuity is occupied by the basal portion of an MSC in contact with the substrate (blue arrows) indicating initiation of transmigration at 60 min. Sample stained as in B. Note blebs extending from the MSC surface (yellow arrows). (D) Stage 4: Subendothelial Spreading. A representative MSC is shown spreading beneath intact hLMVEC endothelium via a discrete gap. Orthogonal projections (ii) and a merged image (iii) is shown. This is in contrast to integration (schematic, v; orthogonal projection, vi), where MSC displace endothelial cells by spreading between adjacent EC. MSC leading edges and gaps in the EC are outlined in iv and vi to highlight the distinct endothelial gaps which are typically formed during transmigration through endothelium versus integration within an endothelial monolayer. Samples stained as in B. (E) Stage 5: Transmigration Completed. Representative orthogonal views (ii) indicate an MSC completely under the endothelium at 60 min. Top view projections, with (iii) or without (iv) MSC shown, demonstrating intact endothelium. (F) Two Routes of MSC Transmigration, paracellular and transcellular, are shown. MSC incubated on GPNT ECs for 60 min were fixed and stained for VE-cadherin (green), CTx-B (MSC; red) and ICAM-1 (blue). Representative images of MSC at similar late stages in diapedesis migrating either through a paracellular gap between two endothelial cells (i–iv) or through a transcellular pore across a single endothelial cell (v–viii). Images are either top view projections of entire z-stacks (ii, vi) or single sections alone (iv, viii) or together with orthogonal projections (iii and vii). The red MSC (CTx-B) signal was omitted for panels iv and viii to enhance visualization of the transmigration passageway. Note that in both events, only a small rounded portion of the MSC still remains above the endothelium. In ii–iv the MSC migrates through a small (~2 μm in diameter) paracellular gap (iii, yellow arrows) between two cells where the adherens junction (AJ, white arrows) has been disrupted. In vi–viii the MSC passes through a small (~1 μm in diameter) transcellular pore (vi, yellow arrow) distinct from intact adherens junctions (white arrows). Scale bars represent 20 μm.
Figure 3
Figure 3. MSC transmigration kinetics and absence of lateral migration
(A) MSC were incubated on hLMVEC for 30, 60 or 120 min, then fixed, stained and imaged as in Fig. 2. As in Fig. 1B, MSC were counted and classified according to their positions relative to endothelium: Apical, Spanning or Basal. Values represent mean ± s.e.m.. Asterisks indicate a statistically significant difference (p<0.05) as assessed by a one-way ANOVA test with a Tukey post-hoc test, n=3. (B) MSC were subjected to live cell DIC (left panels) and fluorescence (middle panels) imaging during interaction with activated memDsRed-transfected hLMVEC (red). Still frames from the video at 0, 15, 30 and 45 min are shown. Numbers identify 6 separate MSC. Blue and yellow arrows indicate 2 MSC (#1 and #2) in the active process of transmigration as indicated in part by the expanding transmigration passageways in the endothelium; White dashed lines (middle panels, bottom row) indicate intercellular junctions between two ECs (‘EC1’ and ‘EC2’), blue dashed line indicates a paracellular gap for migration of MSC #1, yellow dashed line indicates a transcellular pore for transmigration of MSC #2. Pink and green dashed lines (left frames; MSC #3 and #5) represent the location of 2 different apical MSC in the preceding panel (i.e., lines at 15 min panel show the MSC positions in 0 min panel, etc.) and highlight a lack of significant lateral migration. Orange arrow, MSC #6 (15 min time point) indicates the protrusion of an MSC bleb against the endothelial surface. See also Video 2. Scale bars represent 20 μm.
Figure 4
Figure 4. MSC exhibit extensive non-apoptotic blebbing on endothelium
(A) MSC were incubated for 60 min on activated hLMVEC, then fixed and stained for CD90 (green), VCAM-1 (red) and actin (blue). A representative top view confocal projection of a MSC at an early stage of transcellular diapedesis is shown. Multiple highly rounded, bleb-like structures can be seen protruding from the MSC surface, which are both negative (white arrows) and positive (yellow arrows) for cortical F-actin (blue). See also Video 3. (B) MSC were incubated on resting or TNF-α activated hCMVEC for 60 min. At least 30 MSC were counted for each condition per experiment (n =3). The fraction of MSC exhibiting either blebs, filopodia or both were quantified as shown. Values represent mean ± s.e.m., p<0.05, as assessed by paired Student’s t test. See also related Video 4. (C) MSC were incubated for 60 min on activated hLMVEC and then fixed. To ascertain whether or not blebbing reflected MSC apoptosis, samples stained for CD90 (green), actin (red) and nuclear morphology (ToPro3; blue). A representative example of early stage diapedesis is shown. Both single top view (x–y plane) confocal sections (i), and top view projections/orthogonal cross-sections (ii) show clearly presents of F-actin negative (white arrows) and positive (yellow arrows) and blebs over all MSC surfaces, including those in direct contact with the endothelium. The MSC nucleus (distinguished from neighboring endothelial nuclei with an asterisk) shows normal intact morphology (rather than the canonical fragmented morphology seen during apoptosis) as seen by confocal cross-section (i), orthogonal view (ii) and 3D volumetric rendering (iii). (D) MSC were incubated for 30 min on GPNTs, fixed and then processed for, and imaged by, transmission electron microscopy. Micrograph depicts a representative MSC on endothelium (EC, 10% opacity red overlay) with clearly evident micron-scale cell surface blebs (green arrows) and an intact nucleus (highlighted with a 10% opacity blue overlay). (E) (i–iii) MSC were either incubated on hLMVEC for 30 min or on tissue culture plastic in the presence of 5 mM hydrogen peroxide for 2 h, followed by fixation and staining for CD90 (green), F-actin (red) and annexin V (blue). Representative images show confocal projections of annexin V-negative blebbing MSC on hLMVEC (i) and annexin V-positive MSC exhibiting hydrogen peroxide-induced apoptosis (ii, iii). (iv) Flow cytometric analysis of annexin V- and propidium iodide (PI)-stained EC (shades of green) and MSC (shades of blue) following separate culture (with or without 2 h treatment with 5 mM hydrogen peroxide for MSC) or 1 h EC-MSC co-incubation. Percentage of cells in each condition that were non-apototic (annexin V and PI negative), in early apoptosis (annexin V positive, PI negative) and late apoptosis/necrosis (annexin V and PI positive) are shown. Values are mean ± s.e.m, n = 3.. Asterisks indicate a statistically significant difference as assessed by a one-way ANOVA test with a Tukey post-hoc test. Scale bars represent 20 μm for A, C and E and 5 μm for D.
Figure 5
Figure 5. MSC use non-apoptotic blebs to exert force on surroundings
(A) MSC were imaged live on TNF-α-activated hCMVEC transfected with soluble GFP (sGFP). We previously established that sGFP serves as a sensitive readout for local cytoplasmic volume and, indirectly, surface topology of endothelial cells . Images show sequential still frames of a single MSC on an sGFP-expressing hCMVEC at 30 sec intervals. By DIC blebs can be seen protruding from the basal surface of the MSC against the endothelial cell surface (arrows). Note that at t = 0 sec one bleb (pink arrow) has formed that corresponds to a decrease in local sGFP signal indicating an endothelial cell surface depression/invagination and consequent displacement of cytoplasm. In the subsequent frame that bleb has partially retracted and the endothelial depression has disappeared. At the same time a distinct bleb and endothelial depression (blue arrow) form de novo. (B) MSC were imaged live on TNF-α activated hCMVEC with both DIC (top row) and interference reflection (bottom row; IRM) microscopy. Images are sequential still frames of a single MSC on hCMVEC at 30 sec intervals. At t = 0 sec one bleb (pink arrow) has generated a dark area in the corresponding IRM image indicating that the basal surface of the endothelial cell has been locally depressed and forced into close opposition with the underlying glass substrate. In the subsequent frame this bleb retracts and the endothelial depression (i.e., IRM dark spot) disappears. At the same time a distinct bleb and endothelial cell depression (blue arrow) form de novo. See also similar experiment in Video 5 ‘Example 2’. (C) MSC were imaged live on TNF-α activated, mem-RFP transfected hLMVEC with both DIC (top row) and fluorescence (bottom row) microscopy. Images are still frames separated by a ~10 min interval. Left panels show an MSC adherent over an intact intercellular junction (dashed line) formed between a positive mem-RFP transfected (‘EC1’, red) and a non-transfected (‘EC2’, black) hLMVEC. Right panels show that commensurate with the onset of blebbing, a large (~5 μm) rounded intercellular gap forms under the MSC. See also corresponding Video 5, ‘Example 4’. (D) MSC were imaged live on mem-GFP transfected hLMVEC with both DIC (left) and fluorescence (right) microscopy. Images are still frames of a single MSC migrating through a transcellular pore in a mem-GFP positive endothelial cell. For this ‘fried egg-shaped’ MSC the peripheral blebbing regions of the MSC have already spread beneath the endothelium (See Fig. S1, bottom, right ‘multiple leading fronts’), where the central ‘yolk’ region is spanning across and partially above the endothelium. Arrows indicate dynamic MSC blebs expanding and apparently exerting force on the endothelium as seen by corresponding distortions in the endothelial cell topology. See the corresponding dynamics in Video 5, ‘Example 5’. (E) The extent to which ‘non-apoptotic migratory blebbing’ was associated with MSC at different stages of transmigration was quantified. MSC were incubated on TNF-α activated hCMVEC for 30, 60 or 120 min. Individual MSC were classified according to their position (as in Fig. 1B) relative to endothelium and of the percentage of blebbing MSC in each position is shown. Five independent experiments were performed, and a total of 85, 133 and 45 apical, transmigrating and basal MSC, respectively were counted. Values represent mean ± s.e.m.. p<0.05, as assessed by unpaired Student’s t test. (F) The association between MSC blebbing and avidity for a rigid substrate was explored. MSC were incubated in either serum-free media (‘Control’), or serum-free media containing 240 μg/ml of the α-chymotryptic fragment (cell attachment region) of fibronectin (‘FN-Block’) for 30 min, before being transferred to a fibronectin-coated glass dish. Three consecutive 6 minute videos of MSC were captured for each experimental condition, and the percentage of MSC which exhibited blebbing (described in Materials and Methods) is shown. Values represent mean ± s.e.m. p<0.05, as assessed by paired Student’s t test. (G) GFP-actin (green; central and right panels) transfected MSC were imaged live during transmigration across activated hLMVEC via both DIC and fluorescence microscopy. The depicted example shows a relatively late stage diapedesis event (i.e., slightly advanced stage compared to Fig. 5D) in which the MCS is advancing part of its membrane under the endothelium through cycles of bleb expansion and retraction. Images are sequential still frames at 20 or 40 sec intervals. Consistent with the fixed cell imaging in Fig. 4A,C, blebs can be seen (via the DIC imaging; left and right panels) protruding from the MSC that are both negative (white arrows) and positive (yellow arrows) for GFP-actin. Red dashed lines (right panels) delineate the edge of MSC membrane during bleb formation, whereas blue dashed line indicates the ‘edge’ GFP-actin signal. Note that cycles of actin-negative bleb formation, followed by actin recruitment to the bleb and subsequent bleb retraction occur as the cell advances, features are highly similar to non-apoptotic migratory blebbing activities exhibited by some tumor and embryonic cell types –, . See also Video 7. Scale bars represent 20 μm.
Figure 6
Figure 6. Comparison between the leukocyte transmigration cascade and the proposed MSC transmigration cascade
Discrete steps in the leukocyte adhesion cascade (top panel) and the proposed MSC adhesion cascade (bottom panel). Labels in red indicate key differences between the 2 processes, while labels in black indicate similarities. Leukocytes (light green) roll on activated endothelium (red) via selectins, which are upregulated on the endothelial surface during inflammation. MSC (dark green) also roll on endothelium . Rolling brings leukocytes in closer proximity to the endothelial surface where chemokines (red asterisks) are presented. GPCR receptors on the leukocyte (top left inset) recognize the chemokines, leading to conformational rearrangement of leukocyte surface integrins adhesion receptors that are coupled increased ligand binding affinity. This allows high affinity binding to complementary ligands such as ICAM-1 and VCAM-1 on the endothelial cell surface endothelial surface thereby inducing firm adhesion of the leukocyte. Although firm adhesion of MSC occurs it is currently unknown if this occurs through a similar activation step (bottom left inset). For leukocytes, adhesion is followed by an important phase of polarization and lateral migration, during which they employ actin-dependent protrusions, including lamellipodia, pseudopodia and invadosomes, for motility (top middle inset) and migratory pathfinding (top middle and right inset). In contrast MSC do not exhibit significant polarization or lateral migration on the apical surface of the endothelium. Moreover, there is no evidence that MSC utilize lamellipodia, pseudopodia or invadosomes during initiation of diapedesis. Intriguingly, however, they do display distinct and highly dynamics non-apoptotic blebbing protrusions. These form initially without cortical actin (bottom right inset, yellow line), but subsequently become enriched in actin (dashed yellow line), which is followed by bleb retraction. In some tumor and embryonic cell types such non-apoptotic blebbing serves as mechanistic basis for motility and invasion –, . Blebs are proposed here as putative mechanisms by which MSC exert force on the endothelial surface (bottom right inset, black arrow), or search for adhesion points and sites permissive for transmigration. Though they appear to initiate transmigration through different protrusive activities, leukocytes and MSC both trigger proactive endothelial extension of microvilli-like, actin, ICAM-1 and VCAM-1 endothelial projections that form ‘transmigratory cups’, which are thought to facilitate diapedesis. Additionally, both cell types exhibit the ability to employ transcellular (directly through an endothelial cell) and paracellular (between endothelial cells) routes of transmigration. However, leukocytes invade the subendothelial space typically with a single lamellipodial leading edge and complete the entire transmigration process in several minutes, while MSC initially spread beneath the endothelium in a starburst fashion with multiple leading fronts and require one to two hours to completely transmigrate.

References

    1. Ankrum J, Karp JM. Mesenchymal stem cell therapy: Two steps forward, one step back. Trends in Molecular Medicine. 2009;16:203–209. - PMC - PubMed
    1. Karp JM, Teo GSL. Mesenchymal Stem Cell Homing: The Devil is in the Details. Cell Stem Cell. 2009;4:206–216. - PubMed
    1. Kawada H, Fujita J, Kinjo K, et al. Nonhematopoietic mesenchymal stem cells can be mobilized and differentiate into cardiomyocytes after myocardial infarction. Blood. 2004;104:3581–3587. - PubMed
    1. Quante M, Tu SP, Tomita H, et al. Bone Marrow-Derived Myofibroblasts Contribute to the Mesenchymal Stem Cell Niche and Promote Tumor Growth. Cancer Cell. 2011;19:257–272. - PMC - PubMed
    1. Taylor HS. Endometrial Cells Derived From Donor Stem Cells in Bone Marrow Transplant Recipients. JAMA: The Journal of the American Medical Association. 2004;292:81–85. - PubMed

Publication types

MeSH terms

Substances