. 2012 Oct 5;287(41):34569-82.
doi: 10.1074/jbc.M112.399261. Epub 2012 Aug 10.

The apo-structure of the low molecular weight protein-tyrosine phosphatase A (MptpA) from Mycobacterium tuberculosis allows for better target-specific drug development

Affiliations

The apo-structure of the low molecular weight protein-tyrosine phosphatase A (MptpA) from Mycobacterium tuberculosis allows for better target-specific drug development

Tanja Stehle et al. J Biol Chem. .

Abstract

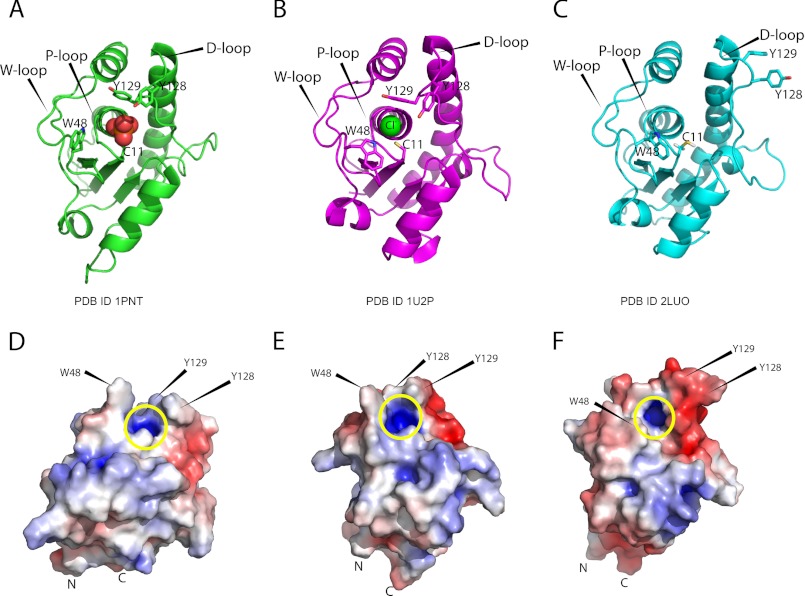
Protein-tyrosine phosphatases (PTPs) and protein-tyrosine kinases co-regulate cellular processes. In pathogenic bacteria, they are frequently exploited to act as key virulence factors for human diseases. Mycobacterium tuberculosis, the causative organism of tuberculosis, secretes a low molecular weight PTP (LMW-PTP), MptpA, which is required for its survival upon infection of host macrophages. Although there is otherwise no sequence similarity of LMW-PTPs to other classes of PTPs, the phosphate binding loop (P-loop) CX(5)R and the loop containing a critical aspartic acid residue (D-loop), required for the catalytic activity, are well conserved. In most high molecular weight PTPs, ligand binding to the P-loop triggers a large conformational reorientation of the D-loop, in which it moves ∼10 Å, from an "open" to a "closed" conformation. Until now, there have been no ligand-free structures of LMW-PTPs described, and hence the dynamics of the D-loop have remained largely unknown for these PTPs. Here, we present a high resolution solution NMR structure of the free form of the MptpA LMW-PTP. In the absence of ligand and phosphate ions, the D-loop adopts an open conformation. Furthermore, we characterized the binding site of phosphate, a competitive inhibitor of LMW-PTPs, on MptpA and elucidated the involvement of both the P- and D-loop in phosphate binding. Notably, in LMW-PTPs, the phosphorylation status of two well conserved tyrosine residues, typically located in the D-loop, regulates the enzyme activity. PtkA, the kinase complementary to MptpA, phosphorylates these two tyrosine residues in MptpA. We characterized the MptpA-PtkA interaction by NMR spectroscopy to show that both the P- and D-loop form part of the binding interface.


Figures

FIGURE 1.
FIGURE 1.
A, full-length MptpA amino acid sequence construct (Rv2234, Met1–Ser163). Additional residues G(−3)–G(0) originate from subcloning. B, 1H,15N TROSY-HSQC spectrum of MptpA at 900 MHz. The inset shows the enlargement of the region between 7.4 and 9.0 ppm in 1H and between 117.6 and 124.2 ppm in the 15N dimension. Amide protons of side chain resonances are indicated by horizontal lines. The spectrum was recorded at T = 303 K in the following buffer: 1.2 mm MptpA, 50 mm arginine/glutamate, 25 mm HEPES (pH 7.0), 10 mm DTT, 10% D2O, and 150 μm 2,2-dimethyl-2-silapentane-5-sulfonic acid. Additional peaks seen in the TROSY-HSQC spectrum with low intensities possibly arose from sample heterogeneity.
FIGURE 2.
FIGURE 2.
Solution structure of apo-MptpA. A, superposition of the backbone traces showing the bundle of the 20 lowest energy structures and rotated by 180°. B, ribbon representation of the lowest energy structure. The loop regions involved in substrate binding are highlighted. Blue, P-loop (Cys11–Arg17) connecting β11; green, W-loop (Ser44–Glu55) connecting β22; magenta, D-loop (Arg111–Asp131). The side chain residues crucial for the catalytic activity (Cys11 (P-loop) and Asp126 (D-loop)) and substrate specificity (Trp48 (W-loop)) are shown as sticks. The overall structure of MptpA consists of a four-stranded parallel folded β-sheet (β1(Leu5–Cys11), β2(Ala37–Ala43), β3(Leu85–Leu89), β4(Arg106–Leu110)) connected via five α-helices (α1(Cys16-Arg32), α2(Asp55–His65), α3(Gly77–Ala82), α4(Asp90–Leu100), α5(His132-Asn160)) also known as the Rossmann fold. The P-loop is flanked by the W- and D-loop. C, backbone dynamics of MptpA measured at 600 MHz and T = 303 K. Mapping the S2 values on the backbone bundle of 20 lowest energy structures. Colors range from blue (S2 = 1) to red (S2 = 0) to gray (no data/no reliable fit). The very low order parameters for the N and C terminus (white, Met1, Ser2, Gly161, and Ser163) are not shown. The figure was generated by PyMOL.
FIGURE 3.
FIGURE 3.
D-loop movement reveals open and closed conformation. A, D-loop distance measurements reveal closed conformation of MptpA x-ray structure (PDB entry 1U2P) in the chloride-bound state. The distance between Trp48 Nϵ1 and Tyr128 Oη of 7.2 Å reveals a more closed binding pocket compared with the apo-state of MptpA, as well as the Cα distances between Arg17 and Tyr128/Tyr129 of 8.9 and 12.5 Å, respectively. B, open conformation of binding pocket observed in apo-MptpA (PDB entry 2LUO) due to a distance of 19.8 ± 3.5 Å between Trp48 Nϵ1 and Tyr128 Oη. The dashed lines indicate the Cα distances between Arg17 and Tyr128/Tyr129 of 14.0 ± 1.3 and 15.9 ± 0.8 Å, respectively. C and D, the following PDB entries are used: MptpA NMR structure (PDB entry 2LUO) (cyan), MptpA x-ray structure (PDB entry 1U2P) (magenta), and bovine BPTP (PDB entry 1PNT) (green). C, superposition of the P-loop surrounding area observed in solution (cyan) and x-ray structure (magenta) of MptpA in complex with chloride. Representation of the P-loop electrostatic surface with charge distribution. Secondary structure elements are depicted in white. D, same scheme as in C, replacing the x-ray structure of MptpA with the x-ray structure of bovine BPTP (green) in complex with phosphate. All images were generated in PyMOL. The solvent-accessible electrostatic surface was calculated using APBS Tools version 2.1.
FIGURE 4.
FIGURE 4.
Structural changes observed upon ligand binding in LMW-PTPs. The following PDB entries are used: bovine BPTP (PDB entry 1PNT, x-ray) (A and D), MptpA x-ray structure (PDB entry 1U2P) (B and E), and MptpA NMR structure (PDB entry 2LUO) (C and F). A–C, comparison of secondary structure elements of bovine BPTP (A), MptpA x-ray structure (B), and MptpA solution structure (C). D–F, solvent-accessible surface mapped on bovine BPTP (D), MptpA x-ray structure (E), and MptpA solution structure (F). Yellow circle, positively charged binding pocket. The locations of hydrophobic residues (Trp48, Tyr128, and Tyr129) flanking the active site are highlighted. The solvent-accessible electrostatic surface was calculated using APBS Tools version 2.1.
FIGURE 5.
FIGURE 5.
Multiple sequence alignment. Shown is a sequence alignment of LMW-PTPs, with the secondary structure elements of MptpA shown on top. The figure was prepared using ESPript2.2 (67) by applying the BLOSUM62 scoring matrix. The P-, W-, and D-loop are colored in blue, green, and magenta, respectively.
FIGURE 6.
FIGURE 6.
Autophosphorylation activity monitored by Luciferase assay. Different enzyme concentrations (500 nm and 1 and 50 μm) were added to the assay buffer (300 mm NaCl, 50 mm Tris-HCl (pH 8.0), 10 mm DTT, and 10 mm MgCl2) containing 1, 5, 10, and 100 μm ATP. A, in the autophosphorylation assay for MptpA, no decrease in the amount of emitted light (relative light units; RLU) is observed. The comparison of the negative control (−MptpA; red line) with varying enzyme concentrations does not show the deviation associated with autophosphorylation. B, in the autophosphorylation assay for PtkA, the decrease in the amount of emitted light is associated with autophosphorylation activity of PtkA.
FIGURE 7.
FIGURE 7.
MptpA-PtkA interaction studied by NMR spectroscopy. A, NMR spectroscopy of complex titration. Overlay of two-dimensional 1H,15N TROSY spectrum of MptpA with and without PtkA. Blue, apo-MptpA; orange, MptpA-PtkA (end point of the titration experiment with ratio 1:2). The arrows highlight the trajectory of chemical shift changes. B, combined CSPs of backbone amide residues in ppm as a function of the MptpA residue number obtained via titration of MptpA with PtkA (1:2). Due to a loss of intensities, values of Cys16 and Trp48 are missing, as indicated by vertical dashed lines. C, mapping of CSPs on the MptpA solution structure. CSPs ≥ 0.015 ppm (orange) are taken into account for the mapping of the binding site of PtkA on the NMR solution structure of MptpA. Important motifs (P-, W-, and D-loop) are labeled.

Similar articles

Cited by

References

    1. World Health Organization (2012) 2011/2012 Tuberculosis Global Facts, World Health Organization, Geneva
    1. De Cock K. M., Chaisson R. E. (1999) Will DOTS do it? A reappraisal of tuberculosis control in countries with high rates of HIV infection. Int. J. Tuberc. Lung Dis. 3, 457–465 - PubMed
    1. Koul A., Arnoult E., Lounis N., Guillemont J., Andries K. (2011) The challenge of new drug discovery for tuberculosis. Nature 469, 483–490 - PubMed
    1. Clatworthy A. E., Pierson E., Hung D. T. (2007) Targeting virulence. A new paradigm for antimicrobial therapy. Nat. Chem. Biol. 3, 541–548 - PubMed
    1. Cozzone A. J., Grangeasse C., Doublet P., Duclos B. (2004) Protein phosphorylation on tyrosine in bacteria. Arch. Microbiol. 181, 171–181 - PubMed

Publication types

MeSH terms

Substances

LinkOut - more resources