. 2013 Apr;39(2):338-47.
doi: 10.1037/a0029717. Epub 2012 Aug 13.

Collective enumeration

Affiliations
Free PMC article

Collective enumeration

Bahador Bahrami et al. J Exp Psychol Hum Percept Perform. 2013 Apr.
Free PMC article

Abstract

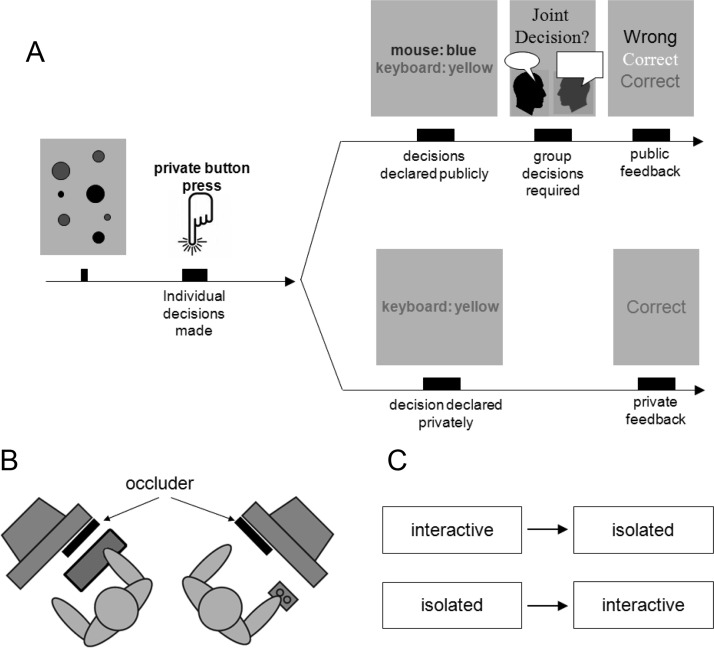
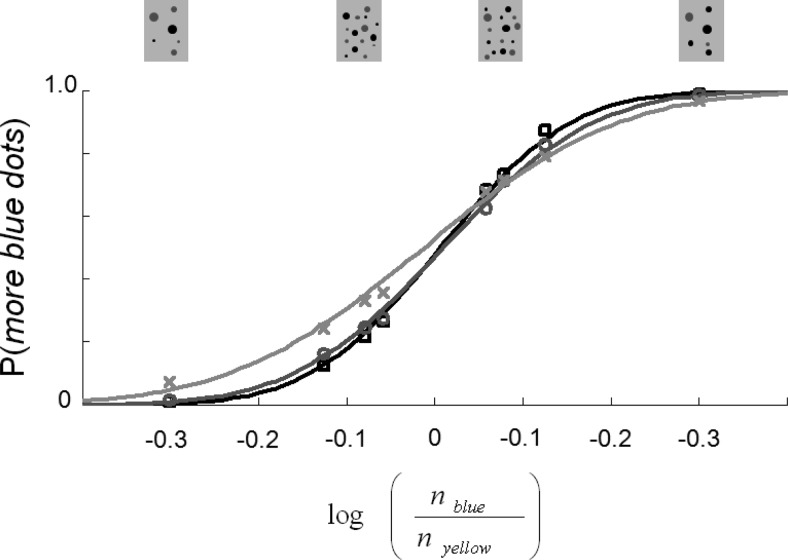
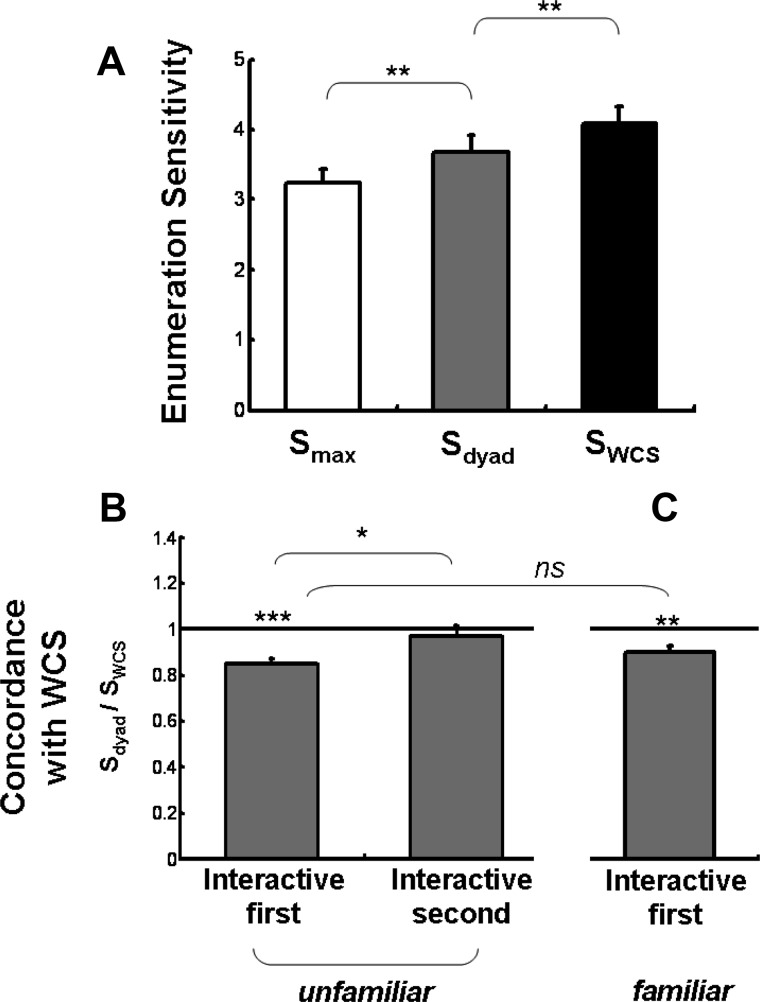
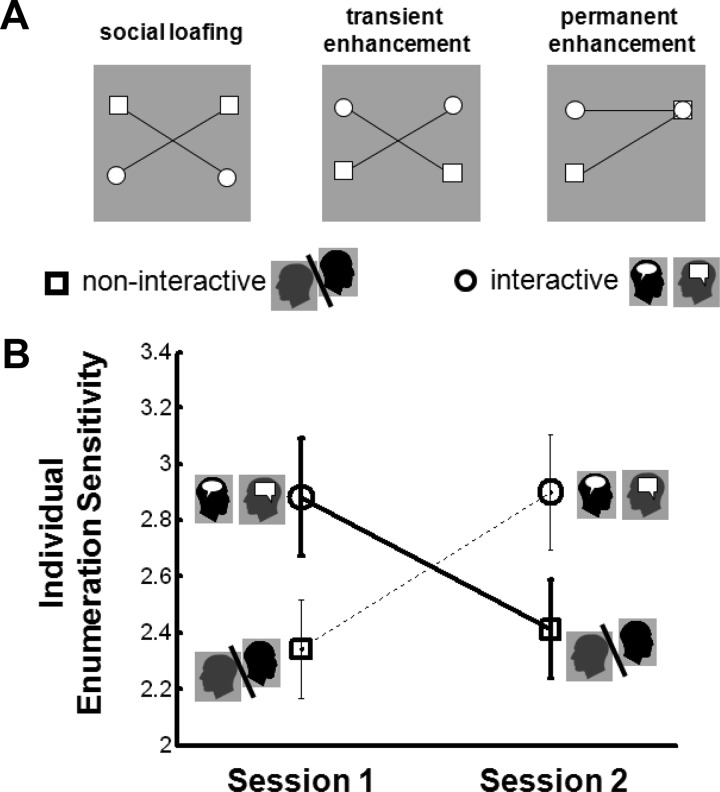
Many joint decisions in everyday life (e.g., Which bar is less crowded?) depend on approximate enumeration, but very little is known about the psychological characteristics of counting together. Here we systematically investigated collective approximate enumeration. Pairs of participants made individual and collective enumeration judgments in a 2-alternative forced-choice task and when in disagreement, they negotiated joint decisions via verbal communication and received feedback about accuracy at the end of each trial. The results showed that two people could collectively count better than either one alone, but not as well as expected by previous models of collective sensory decision making in more basic perceptual domains (e.g., luminance contrast). Moreover, such collective enumeration benefited from prior, noninteractive practice showing that social learning of how to combine shared information about enumeration required substantial individual experience. Finally, the collective context had a positive but transient impact on an individual's enumeration sensitivity. This transient social influence may be explained as a motivational factor arising from the fact that members of a collective must take responsibility for their individual decisions and face the consequences of their judgments.


Figures

Figure 1
Figure 1. Experimental setup and design. (A) Sequence of events in a trial: Each trial started with a visual stimulus (gray and black dots are used here to represent yellow and blue, respectively). Participants then indicated their private decision by a button press without any communication. In the interactive condition (top panel), decisions were then publically shared and if there was a disagreement, participants negotiated a joint decision. The trial ended with public announcement of the decision outcomes (here the white color refers to group decision outcome). In the noninteractive condition (lower panel), decision and outcome were kept private and no communication was permitted. (B) Spatial organization of the participants, display, the occluder and the response instruments. (C) Experimental design. Dyads were randomly assigned to one of two orders.
Figure 2
Figure 2. The psychometric function relating the choice of “more blue dots” to the log of the ratio of number of blue to yellow dots (gray and black dots are used here to represent yellow and blue, respectively). Data points are the average across dyads (black, N = 15), the more sensitive members of dyads (dark gray curve and circles, N = 15) and less sensitive member members of dyads (light gray curve and circles, N = 15). The curves are best the fitting cumulative normal.
Figure 3
Figure 3. The results of collective enumeration. (A) Average enumeration sensitivity (the slope of the psychometric function) is plotted for the best members of the dyads (white), as well as for the dyads (gray) and the corresponding sensitivity expected by the WCS model (black). Error bars = 1 SE. (B) Concordance with the WCS model is plotted for dyads who took the interactive session first (see Figure 1C) versus those who took the non-interactive session first. Horizontal line indicates agreement with the model. Values below the line indicate that the empirical performance was inferior to model prediction. ** p < .01. Error bars = 1 SE. (C) Familiarity control experiment: conventions are the same as panel B but the members of each dyad were familiar with one another.
Figure 4
Figure 4. The impact of collective context on individual performance. (A) Graphical representation of 3 different predictions. (B) Enumeration sensitivity (slope of psychometric function) for individuals are plotted for when they undertook the task in isolation (squares) and when shared opinions and made collective decisions together (circles). Error bar = 1 SE.

References

    1. Abrams D., & Hogg M. A. (1988). Comments on the motivational status of self-esteem in social identity and intergroup discrimination. European Journal of Social Psychology, 18, 317–334. doi:10.1002/ejsp.2420180403
    1. Bahrami B., Olsen K., Bang D., Roepstorff A., Rees G., & Frith C. (2012a). Together, slowly but surely: The role of social interaction and feedback on the build-up of benefit in collective decision-making. Journal of Experimental Psychology: Human Perception and Performance, 38, 3–8. doi:10.1037/a0025708 - PMC - PubMed
    1. Bahrami B., Olsen K., Bang D., Roepstorff A., Rees G., & Frith C. (2012b). What failure in collective decision-making tells us about metacognition. Philosophical Transactions of the Royal Society, B, 367, 1350–1365. doi:10.1098/rstb.2011.0420 - PMC - PubMed
    1. Bahrami B., Olsen K., Latham P. E., Roepstorff A., Rees G., & Frith C. D. (2010). Optimally interacting minds. Science, 329, 1081–1085. doi:10.1126/science.1185718 - PMC - PubMed
    1. Behrens T. E., Hunt L. T., & Rushworth M. F. (2009). The computation of social behavior. Science, 324, 1160–1164. doi:10.1126/science.1169694 - PubMed

Publication types