. 2013 Jan;168(2):375-88.
doi: 10.1111/j.1476-5381.2012.02139.x.

Differential activation of the μ-opioid receptor by oxycodone and morphine in pain-related brain regions in a bone cancer pain model

Affiliations

Differential activation of the μ-opioid receptor by oxycodone and morphine in pain-related brain regions in a bone cancer pain model

Atsushi Nakamura et al. Br J Pharmacol. 2013 Jan.

Abstract

Background and purpose: Bone cancer pain is chronic and often difficult to control with opioids. However, recent studies have shown that several opioids have distinct analgesic profiles in chronic pain.

Experimental approach: To clarify the mechanisms underlying these distinct analgesic profiles, functional changes in the μ-opioid receptor were examined using a mouse femur bone cancer (FBC) model.

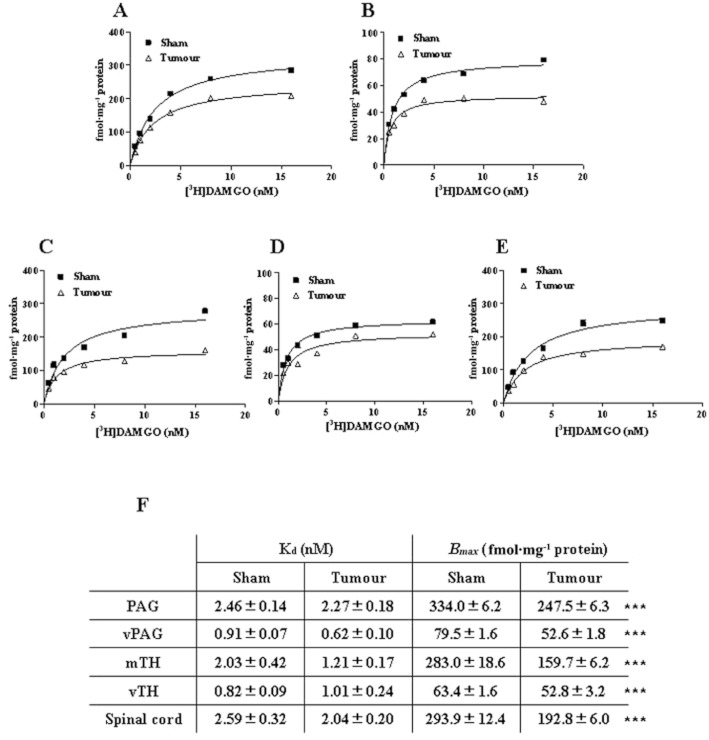
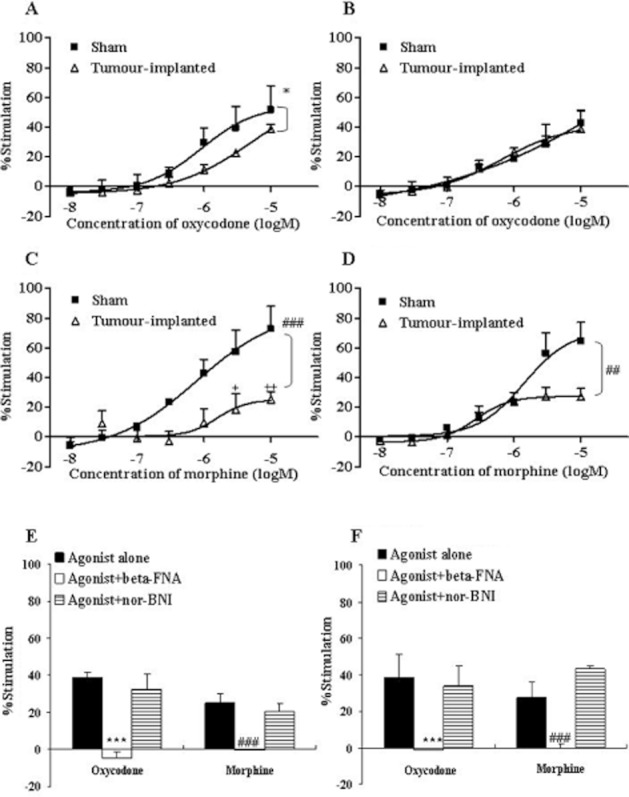
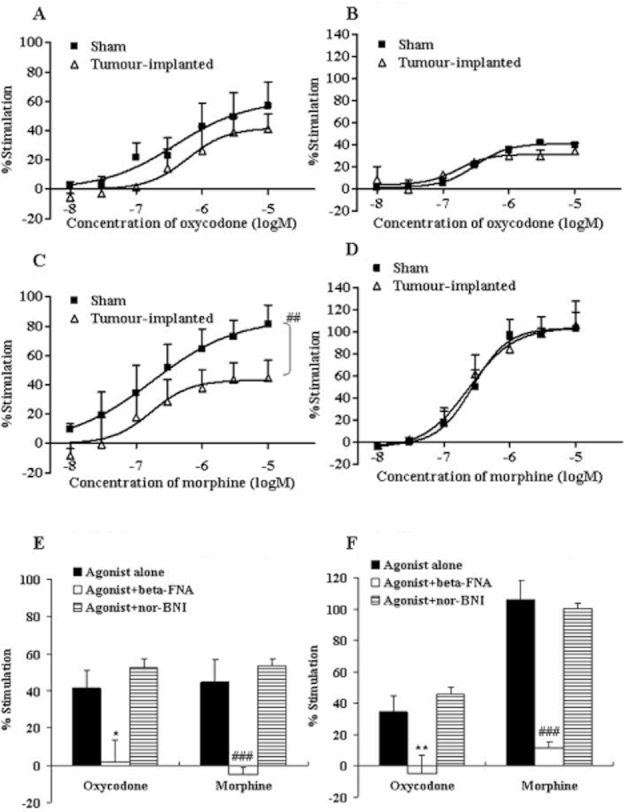
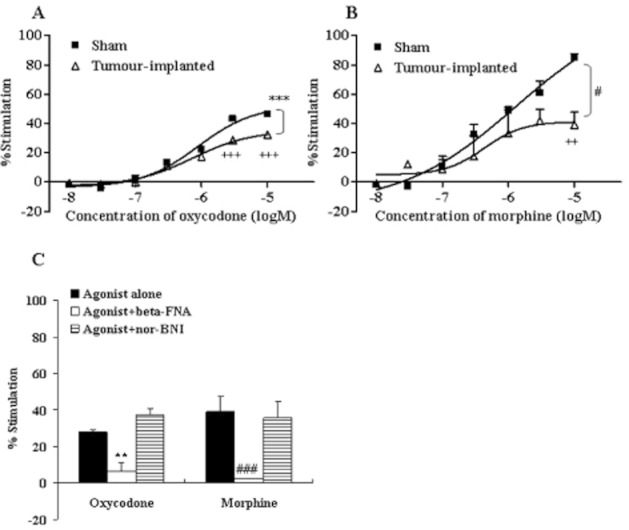
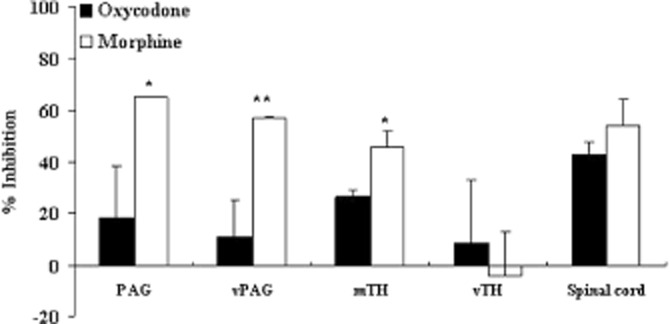
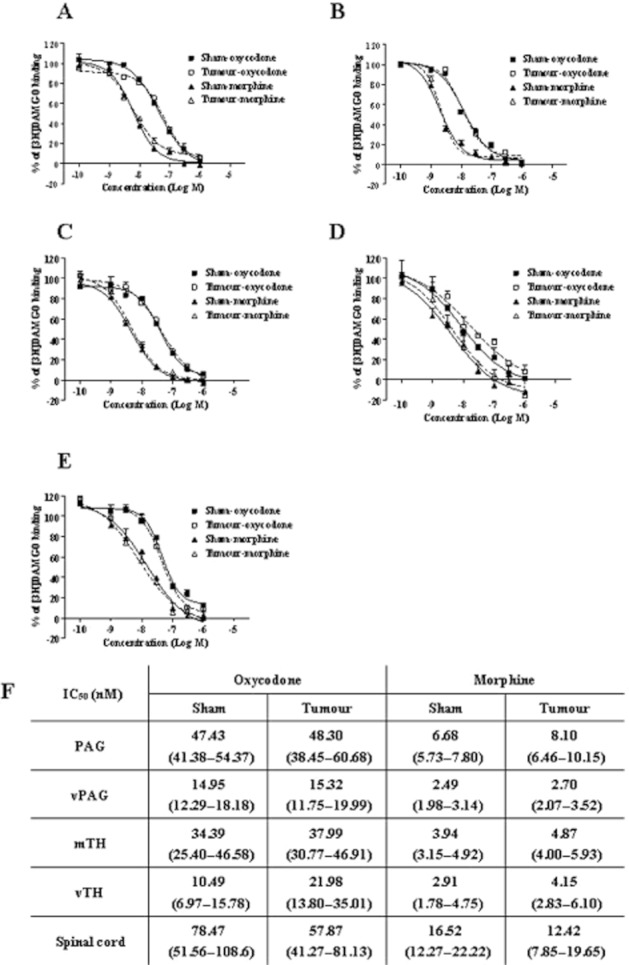
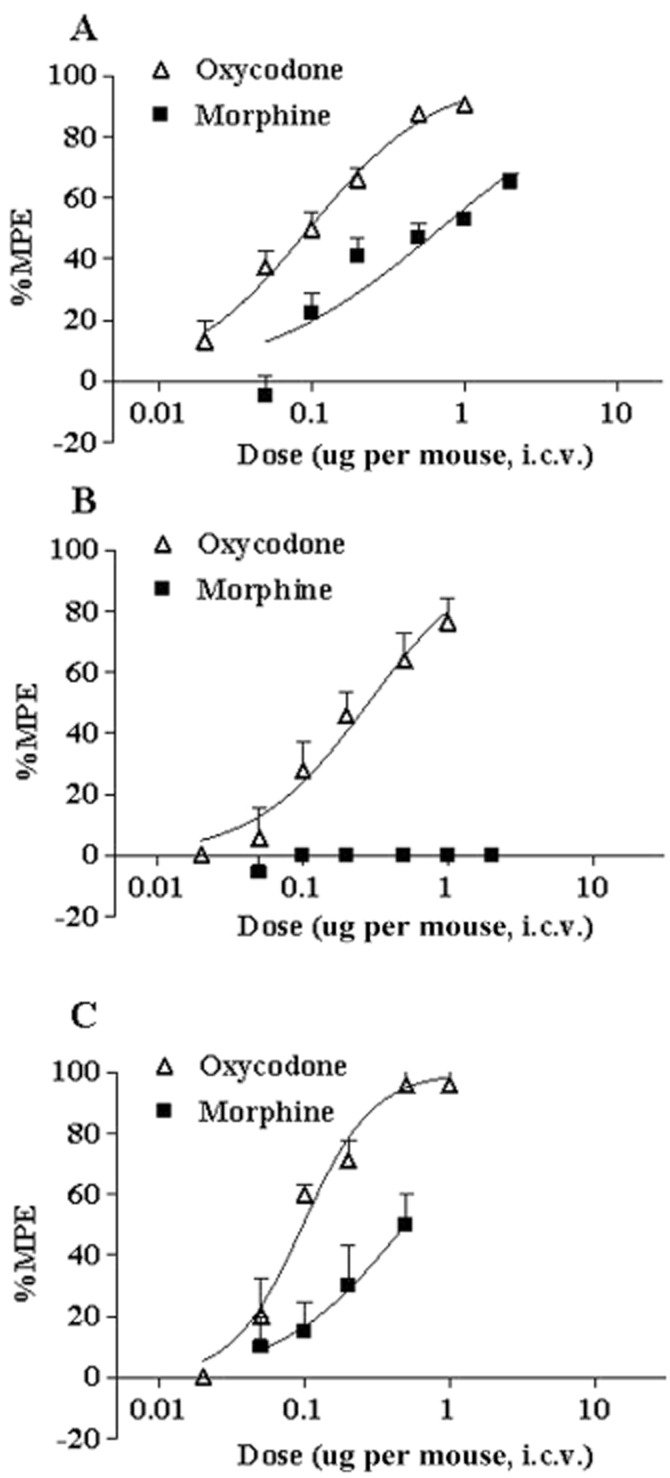
Key results: In the FBC model, the B(max) of [(3) H]-DAMGO binding was reduced by 15-45% in the periaqueductal grey matter (PAG), region ventral to the PAG (vPAG), mediodorsal thalamus (mTH), ventral thalamus and spinal cord. Oxycodone (10(-8) -10(-5) M) and morphine (10(-8) -10(-5) M) activated [(35) S]-GTPγS binding, but the activation was significantly attenuated in the PAG, vPAG, mTH and spinal cord in the FBC model. Interestingly, the attenuation of oxycodone-induced [(35) S]-GTPγS binding was quite limited (9-26%) in comparison with that of morphine (46-65%) in the PAG, vPAG and mTH, but not in the spinal cord. Furthermore, i.c.v. oxycodone at doses of 0.02-1.0 μg per mouse clearly inhibited pain-related behaviours, such as guarding, limb-use abnormalities and allodynia-like behaviour in the FBC model mice, while i.c.v. morphine (0.05-2.0 μg per mouse) had only partial or little analgesic effect on limb-use abnormalities and allodynia-like behaviour.

Conclusion and implications: These results show that μ-opioid receptor functions are attenuated in several pain-related regions in bone cancer in an agonist-dependent manner, and suggest that modification of the μ-opioid receptor is responsible for the distinct analgesic effect of oxycodone and morphine.


Figures

Figure 1
Figure 1
Saturation curves for the specific binding of [3H]-DAMGO on cell membranes of PAG, vPAG, mTH, vTH and spinal cord prepared from sham-operated and FBC model mice. Tissue samples were collected 14 days after the sham operation (Sham) or tumour implantation (tumour-implanted), and membranes prepared from the PAG (A), vPAG (B), mTH (C), vTH (D) and spinal cord (E) were used for the binding assay. [3H]-DAMGO binding was examined using concentrations from 0.5 to 16 nM. Specific binding was defined as the difference in binding observed in the absence and presence of 10 μM unlabelled DAMGO. Each value represents the mean ± SD of two independent experiments (eight mice per sample in each experiment). The Kd and Bmax of [3H]-DAMGO in those regions are shown in (F). The values were determined from the saturation curves and Scatchard plots analysis, and at least six concentrations were used for each analysis. ***P < 0.001 versus sham group (two-way ANOVA, Dunnett's multiple comparison test).
Figure 2
Figure 2
Concentration–response curves of oxycodone and morphine for [35S]-GTPγS binding to cell membranes of PAG and vPAG. The cell membranes of PAG (A, C) and vPAG (B, D) were prepared 14 days after the sham operation (Sham) or tumour implantation (tumour-implanted) and incubated in the presence of different concentrations of oxycodone (10−8–10−5 M) (A, B) or morphine (10−8–10−5 M) (C, D). The membrane-bound [35S]-GTPγS was measured and expressed as % stimulation relative to the basal level. Each symbol represents the mean ± SEM of three independent samples (four mice per sample). The effects of the μ-opioid receptor antagonist β-FNA (10−6 M) and κ-opioid receptor antagonist nor-BNI (10−6 M) on oxycodone- (10−5 M) or morphine- (10−5 M) induced [35S]-GTPγS binding in the PAG (E) and vPAG (F) of tumour-implanted mice are also shown. Each column represents the mean ± SEM of three independent samples (four mice per sample). In each graph, the y-axis indicates % of G-protein activation by each agonist. F(1,28) = 4.822; *P < 0.05 versus sham oxycodone group, F(1,28) = 9.203; ##P < 0.01 or F(1,28) = 18.94; ###P < 0.001 versus sham morphine group (two-way ANOVA; A, C or D). +P < 0.05 or ++P < 0.01 versus sham morphine group (Bonferroni multiple comparison post test; C). ***P < 0.001 versus oxycodone alone group, ###P < 0.001 versus morphine alone group (two-way ANOVA, Dunnett's multiple comparison test; E or F).
Figure 3
Figure 3
Concentration–response curves of oxycodone and morphine for [35S]-GTPγS binding to cell membranes from the mTH (A, C) and vTH (B, D). The membranes were prepared 14 days after the sham operation (Sham) or tumour implantation (tumour-implanted) and incubated in the presence of different concentrations of oxycodone (10−8–10−5 M) (A, B) or morphine (10−8–10−5 M) (C, D). The membrane-bound [35S]-GTPγS was measured and expressed as % stimulation relative to the basal level. Each symbol represents the mean ± SEM of three independent samples (four mice per sample). The effects of β-FNA (10−6 M) and nor-BNI (10−6 M) on oxycodone- (10−5 M) or morphine- (10−5 M) induced [35S]-GTPγS binding in the mTH (E) and vTH (F) of tumour-implanted mice are also shown. Each column represents the mean ± SEM of three independent samples (four mice per sample). In each graph, the y-axis indicates % of G-protein activation by each agonist. F(1,28) = 10.71; ##P < 0.01 versus sham morphine group (two-way ANOVA; C). *P < 0.05 or **P < 0.01 versus oxycodone alone group, ###P < 0.001 versus morphine alone group (two-way ANOVA, Dunnett's multiple comparison test; E or F).
Figure 4
Figure 4
Concentration–response curves of oxycodone and morphine for [35S]-GTPγS binding to cell membranes of the ipsilateral spinal cord. Spinal cord cell membranes (A, B) were prepared 14 days after the sham operation (Sham) or tumour implantation (tumour-implanted) and incubated in the presence of different concentrations of oxycodone (10−8–10−5 M) (A) or morphine (10−8–10−5 M) (B). The membrane-bound [35S]-GTPγS was measured and expressed as % stimulation from the basal level. Each symbol represents the mean ± SEM of three independent samples (four mice per sample). The effects of β-FNA (10−6 M) and nor-BNI (10−6 M) on oxycodone (10−5 M)- or morphine (10−5 M)-induced [35S]-GTPγS binding in the spinal cord (C) of tumour-implanted mice are also shown. Each column represents the mean ± SEM of three independent samples (four mice per sample). In each graph, the y-axis indicates % G-protein activation by each agonist. F(1,28) = 34.41; ***P < 0.001 versus sham oxycodone group, F(1,28) = 8.252; #P < 0.05 versus sham morphine group (two-way ANOVA; A or B). +++P < 0.001 versus sham oxycodone group or ++P < 0.01 versus sham morphine group (Bonferroni multiple comparison post test; A or B). **P < 0.01 versus oxycodone alone group, ###P < 0.001 versus morphine alone group (two-way ANOVA, Dunnett's multiple comparison test; C).
Figure 5
Figure 5
Change in the maximum activation of μ-opioid receptors by oxycodone and morphine in the FBC model. Activation of the μ-opioid receptor was determined by the [35S]-GTPγS assay, and the levels stimulated by oxycodone (10−5 M) or morphine (10−5 M) were compared between the sham and tumour-implanted groups. The y-axis represents the inhibition ratio of G-protein activation in the samples from the tumour-implanted mice as compared with those from the sham-operated mice. Each column represents the mean ± SEM of three independent experiments. The inhibition ratio of G-protein activation between samples from the tumour-implanted and sham-operated mice was calculated as % inhibition for each opioid as described in the text. The variability of the inhibition ratio was determined by the variability of the ratio of the GTP activation between the tumour-implanted and sham-operated group among the three experiments, and therefore, the SEM values in this figure are different from those in Figures 4. *P < 0.05, **P < 0.01 versus oxycodone group (two-way ANOVA, Dunnett's multiple comparison test).
Figure 6
Figure 6
Displacement of [3H]-DAMGO binding on membranes of PAG, vPAG, mTH, vTH and spinal cord by oxycodone or morphine. Tissue samples were collected 14 days after sham operation (sham) or tumour implantation (tumour-implanted), and membranes prepared from PAG (A), vPAG (B), mTH (C), vTH (D) and spinal cord (E) were used for the displacement assay. Experiments were performed in the presence of [3H]-DAMGO (2 nM) and increasing concentrations of oxycodone (10−10–10−6 M) or morphine (10−10–10−6 M). The specific binding was defined as the difference in bindings observed in the absence and presence of 10 μM unlabelled DAMGO. Each column represents the mean ± SEM of three independent samples (eight mice per sample). The IC50 values for oxycodone and morphine are shown in (F). The IC50 values were determined by ANOVA and linear regression techniques, and at least nine concentrations were used for each analysis. Values in parentheses indicate the 95% confidence range.
Figure 7
Figure 7
Dose–response curves for the analgesic effects induced by i.c.v. oxycodone and morphine in the FBC model. The analgesic effects of oxycodone (0.02–1 μg per mouse, i.c.v.) and morphine (0.05–2 μg per mouse, i.c.v.) on ongoing pain, ambulatory pain and the allodynia-like response were evaluated based on guarding behaviour (A), limb-use abnormalities (B) and the von Frey test (C), respectively. FBC model mice were used 14 days after tumour implantation, and the analgesic effects were determined 10 min after opioid administration. The y-axes represent % MPE of the analgesic effect. Data plotted are the mean ± SEM of 6–8 mice.

Similar articles

Cited by

References

    1. Alexander SPH, Mathie A, Peters JA. Guide to Receptors and Channels (GRAC), 5th edition. Br J Pharmacol. 2011;164(Suppl. 1):S1–S324. - PMC - PubMed
    1. Basbaum AI, Fields HL. Endogenous pain control systems: brainstem spinal pathways and endorphin circuitry. Annu Rev Neurosci. 1984;7:309–338. - PubMed
    1. Basbaum AI, Jessell TM. The perception of pain. In: Kandel ER, Schwartz JH, Jessell TM, editors. Principles of Neural Science. New York: McGraw-Hill; 2000. pp. 472–491.
    1. Becker R, Jakob D, Uhle EI, Riegel T, Bertalanffy H. The significance of intrathecal opioid therapy for the treatment of neuropathic cancer pain conditions. Stereotact Funct Neurosug. 2000;75:16–26. - PubMed
    1. Bercovitch M, Adunsky A. High dose controlled-release oxycodone in hospice care. J Pain Palliat Care Pharmacother. 2006;20:33–39. - PubMed

MeSH terms