. 2012 Nov;13(11):1466-80.
doi: 10.1111/j.1600-0854.2012.01407.x. Epub 2012 Sep 13.

Cholesterol accumulation increases insulin granule size and impairs membrane trafficking

Affiliations

Cholesterol accumulation increases insulin granule size and impairs membrane trafficking

Jonathan S Bogan et al. Traffic. 2012 Nov.

Abstract

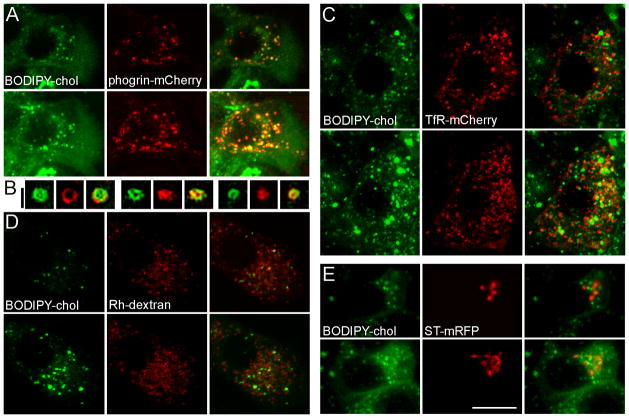
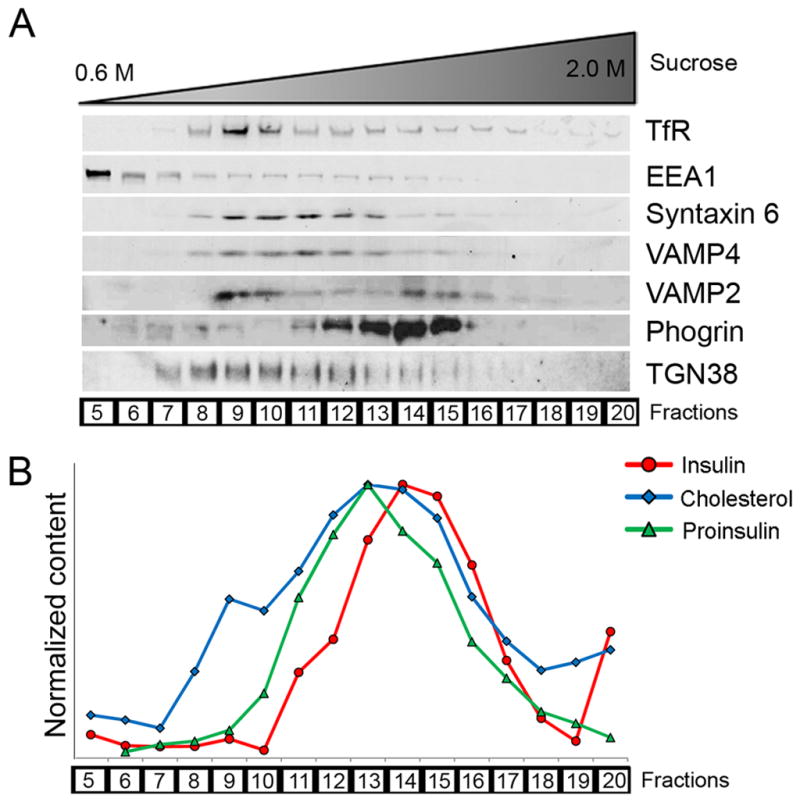
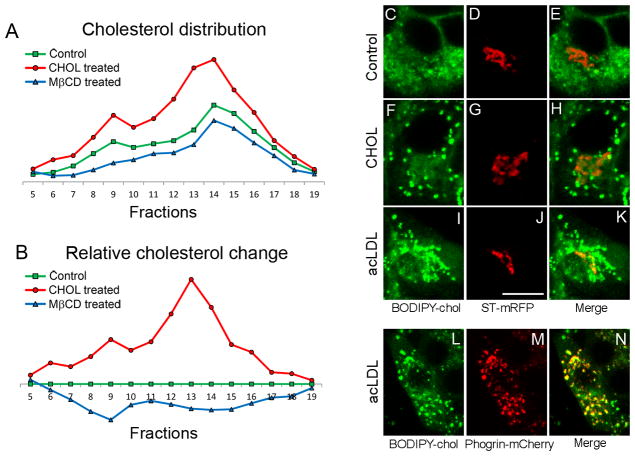
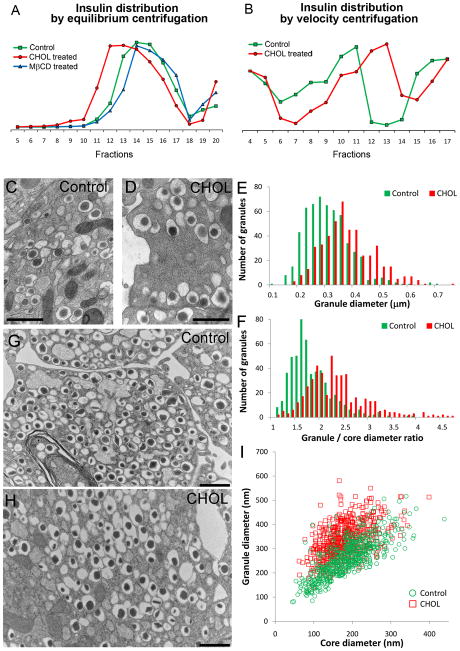
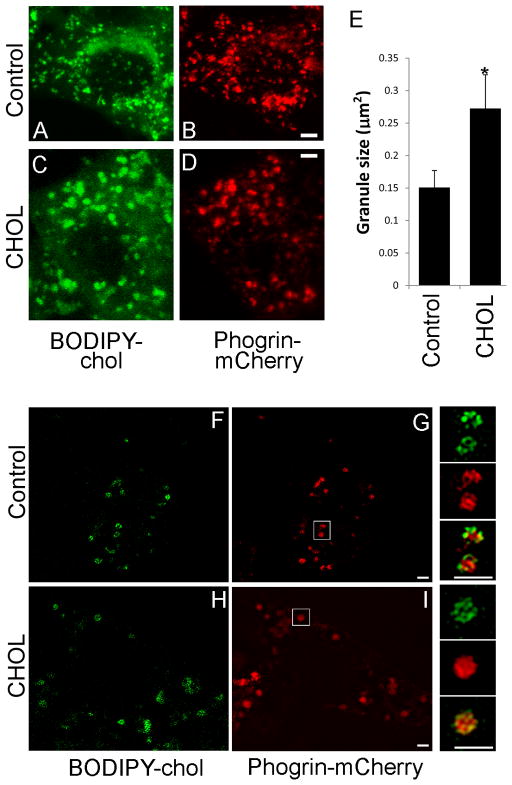
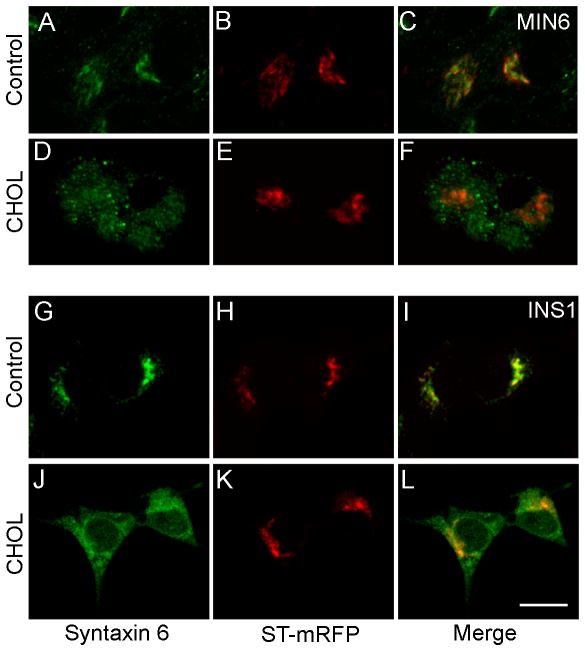
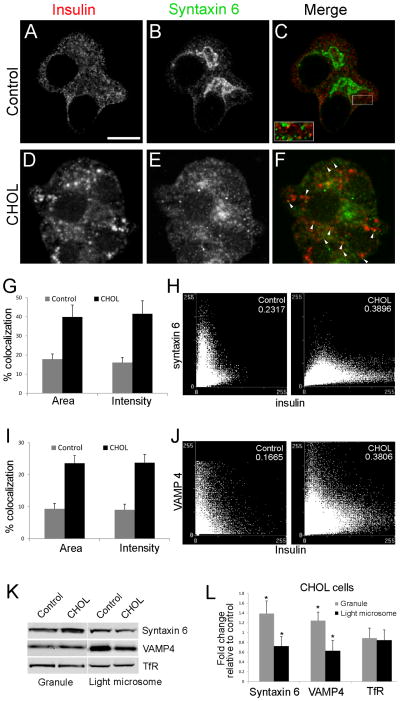
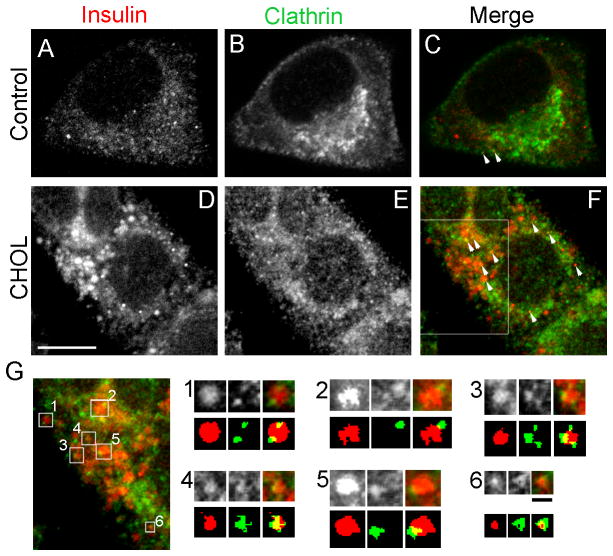
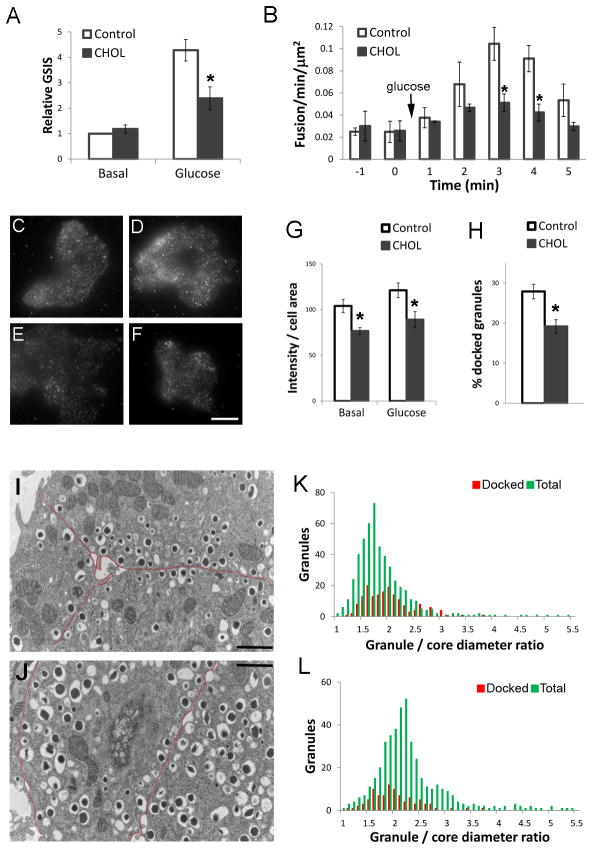
The formation of mature secretory granules is essential for proper storage and regulated release of hormones and neuropeptides. In pancreatic β cells, cholesterol accumulation causes defects in insulin secretion and may participate in the pathogenesis of type 2 diabetes. Using a novel cholesterol analog, we show for the first time that insulin granules are the major sites of intracellular cholesterol accumulation in live β cells. This is distinct from other, non-secretory cell types, in which cholesterol is concentrated in the recycling endosomes and the trans-Golgi network. Excess cholesterol was delivered specifically to insulin granules, which caused granule enlargement and retention of syntaxin 6 and VAMP4 in granule membranes, with concurrent depletion of these proteins from the trans-Golgi network. Clathrin also accumulated in the granules of cholesterol-overloaded cells, consistent with a possible defect in the last stage of granule maturation, during which clathrin-coated vesicles bud from the immature granules. Excess cholesterol also reduced the docking and fusion of insulin granules at the plasma membrane. Together, the data support a model in which cholesterol accumulation in insulin secretory granules impairs the ability of these vesicles to respond to stimuli, and thus reduces insulin secretion.


Figures

Figure 1
Figure 1
BODIPY-chol is localized to insulin granules in live β-cells. MIN6 cells were transfected with phogrin-mCherry to label insulin granules (A and B, red), TfR-mCherry to label the recycling endosomes (C, red), ST-mRFP to label the TGN (E, red), or incubated overnight with rhodamine (Rh)-dextran to label the lysosomes (D, red). Cells were then labeled with BODIPY-chol (green in all panels) for 3 h at 37 °C and imaged live by confocal microscopy. The top row in each panel shows individual confocal planes; the bottom row shows projections of all confocal planes in a z-stack. (B) Three examples of super-resolution SIM images of phogrin-mCherry and BODIPY-chol localized to the same granule. The white scale bar, 10 μm, applies to A, C, D, E; Black scale bar for B: 0.5 μm.
Figure 2
Figure 2
Endogenous cholesterol is enriched in insulin granules. Subcellular fractionation was used to determine intracellular distribution of endogenous cholesterol. Postnuclear MIN6 homogenates were subjected to equilibrium centrifugation on sucrose gradients, which separated intracellular organelles according to density. Sucrose density increased with fraction numbers. Equal volume aliquots were taken from each fraction, and immunoblotted for intracellular markers (A) or measured for insulin, proinsulin, and cholesterol contents (B). Insulin and proinsulin were quantified by ELISA; cholesterol was extracted with organic solvents and measured by a fluorometric assay. For display purposes, all values were normalized to the highest value in each type of measurement. The results presented in this figure were obtained from the same experiment for internal comparison, and are representative of four independent experiments.
Figure 3
Figure 3
Excess extracellular cholesterol is delivered to insulin granules. (A and B) Cholesterol distribution in cells with altered cholesterol levels. MIN6 cells were incubated in KRBH buffer alone (“control”), 5 mM MβCD or 5 mM CHOL for 1 h at 37 °C. (A) Cholesterol content was measured in fractions from subcellular fractionation of postnuclear supernatant by equilibrium centrifugation and normalized to protein content. Sucrose density increased with fraction numbers. (B) Data points from (A) expressed as the difference relative to the control. (C–N) MIN6 cells were transfected with either ST-mRFP to label the TGN (C–K) or phogrin-mCherry to label insulin granules (L–N), and imaged live by confocal microscopy. (F–H) Cells incubated with BODIPY-chol for 3 h had 5 mM CHOL added during the last 60 min. (I–N) Cells were cultured in lipoprotein deficient serum containing acLDL and 58035 for 48 h prior to being labeled with BODIPY-chol for 3 h. Bar, 10 μm, applies to all images.
Figure 4
Figure 4
Excess cholesterol alters insulin granule properties. Insulin distribution upon subcellular fractionation by equilibrium (A, separation by density) and velocity (B, separation by size) centrifugation on sucrose gradients. Sucrose density increased with fraction numbers. (A) CHOL treatment caused a shift of insulin granules toward lighter sucrose fractions, indicating a decrease in granule density. (B) CHOL treatment caused a shift of insulin granules toward heavier sucrose fractions, indicating an increase in granule size. (C–I) TEM analysis of control and cholesterol-overloaded (“CHOL”) insulin granules in MIN6 cells (C–F) and mouse islets (G–I). (E) Histogram of granules according to granule diameter. (F) Histogram of granules according to the ratio of granule diameter to dense core diameter. (I) Granule diameters plotted against dense core diameters for control and CHOL granules from mouse islets. Bar, 1 μm.
Figure 5
Figure 5
Cholesterol overloading increases granule size in live β-cells. MIN6 cells were transfected with phogrin-mCherry (red) and labeled with BODIPY-chol (green). Control (A, B and F, G) and CHOL-treated (C, D and H, I) cells were imaged live by confocal microscopy (A–D, projections) or super-resolution SIM (F–I, single planes). (E) Area measurement of BODIPY-chol clusters after image thresholding. Data are mean ± SEM. * p<0.05 by student t-test. Smaller panels to the right of (F–I) are enlarged images of granules taken from the white boxes shown in (G and I). Bar, 1 μm.
Figure 6
Figure 6
Excess cholesterol affects the steady state distribution of an immature granule marker, syntaxin 6. Control (A–C, G–I) and CHOL-treated (D–F, J–L) MIN6 (A–F) and INS1 (G–L) cells transfected with ST-mRFP (red) were immunostained with syntaxin 6 antibody (green). Bar, 10 μm, applies to all images.
Figure 7
Figure 7
Retention of syntaxin 6 and VAMP4 is increased in cholesterol-overloaded (“CHOL”) insulin granules. Control and CHOL MIN6 cells were stained with insulin (A and D, red) and syntaxin 6 (B and E, green) antibodies. (C insets) Enlarged images of distinctly separated insulin and syntaxin 6 puncta. (F) Structures positive for both insulin and syntaxin 6 are highlighted by white arrowheads. Bar, 10 μm. (G–J) The extent of colocalization was quantified between insulin and syntaxin 6 (G, H), or insulin and VAMP4 (I, J). Details of image analysis are included in the Methods. Percent of colocalization was measured by area and by intensity. All values of CHOL vs. control cells showed p<0.05 by student t-test. n=6 pairs of images. Correlation scatterplots show corresponding pixel intensities from the two probes plotted against each other. A correlation coefficient, which measures the strength of association between the two probes, was generated for each pair of images and shown in the upper right corner. Values of 1 and 0 represent perfect colocalization and random distribution, respectively. (K, L) Granule-enriched and light-microsomal fractions from control and CHOL cells were obtained by sequential centrifugation steps. Each fraction was blotted for TfR, syntaxin 6 and VAMP4 (K), and quantified in (L). (L) Values from CHOL cells were normalized to those from the control (control = 1). * p<0.05 by student t-test against control cells, n=4. All data are mean ± SEM.
Figure 8
Figure 8
More clathrin is associated with cholesterol-overloaded insulin granules. Control and cholesterol-overloaded (“CHOL”) MIN6 cells were immunostained with insulin (A and D, red) and clathrin (B and E, green) antibodies. (C, F) Structures positive for both insulin and clathrin are highlighted by white arrowheads. White bar, 5 μm. (G) A region of the cell marked by the white box in (F). The top row of the panels in (G) shows enlarged images of insulin granules displaying regions overlapping with clathrin. The numbers correspond to the squares in (G). The bottom row outlines the relevant structures labeled by each antibody, with background fluorescence removed by thresholding. Black bar, 0.5 μm.
Figure 9
Figure 9
Excess cholesterol accumulation impairs insulin granule docking and fusion. For all experiments, 20 mM glucose was used for stimulation. (A) Glucose-stimulated insulin secretion (GSIS) was measured in control and CHOL INS1 cells. Basal secretion in control cells was set to 1. n=4. (B) Glucose-stimulated fusion events were measured by TIRFM in control and CHOL INS1 cells transfected with VAMP2-pHluorin. n=548 events from 7 cells. (C–G) Basal (C,E) and glucose-stimulated (15 min, D, F) control (C, D) and CHOL (E, F) MIN6 cells were fixed and stained with insulin antibody and imaged by TIRFM. Bar, 10 μm. (G) Quantification of background corrected fluorescence intensity normalized to cell area from experiments shown in (C–G). n=40 cells. (H–L) MIN6 cells or isolated islets cultured in 11 mM glucose were used. Granules having centers within 200 nm of the plasma membrane were defined as docked. (H) Fraction of docked granules in TEM images of control and CHOL MIN6 cells. n=34 cells. (I–L) TEM of control (I, K) and CHOL (J, L) mouse islets with the plasma membrane marked by red lines in (I, J). Bar, 1 μm. (K, L) Distribution profiles of docked (red) vs. total (green) granules. n=941 from 18 images. All panels, data are mean ± SEM; *, p<0.05 by student t-test against control cells.

References

    1. Unger RH. Lipotoxicity in the pathogenesis of obesity-dependent NIDDM. Genetic and clinical implications. Diabetes. 1995;44(8):863–870. - PubMed
    1. Brunham LR, Kruit JK, Pape TD, Timmins JM, Reuwer AQ, Vasanji Z, Marsh BJ, Rodrigues B, Johnson JD, Parks JS, Verchere CB, Hayden MR. Beta-cell ABCA1 influences insulin secretion, glucose homeostasis and response to thiazolidinedione treatment. Nat Med. 2007;13(3):340–347. - PubMed
    1. Hao M, Head WS, Gunawardana SC, Hasty AH, Piston DW. Direct effect of cholesterol on insulin secretion: a novel mechanism for pancreatic beta-cell dysfunction. Diabetes. 2007;56(9):2328–2338. - PubMed
    1. Fryirs M, Barter PJ, Rye KA. Cholesterol metabolism and pancreatic beta-cell function. Curr Opin Lipidol. 2009;20(3):159–164. - PubMed
    1. Maxfield FR, Tabas I. Role of cholesterol and lipid organization in disease. Nature. 2005;438(7068):612–621. - PubMed

Publication types