. 2013 Feb 1;22(3):397-411.
doi: 10.1089/scd.2012.0238. Epub 2012 Sep 20.

Expression of early developmental markers predicts the efficiency of embryonic stem cell differentiation into midbrain dopaminergic neurons

Affiliations

Expression of early developmental markers predicts the efficiency of embryonic stem cell differentiation into midbrain dopaminergic neurons

Ahmad Salti et al. Stem Cells Dev. .

Abstract

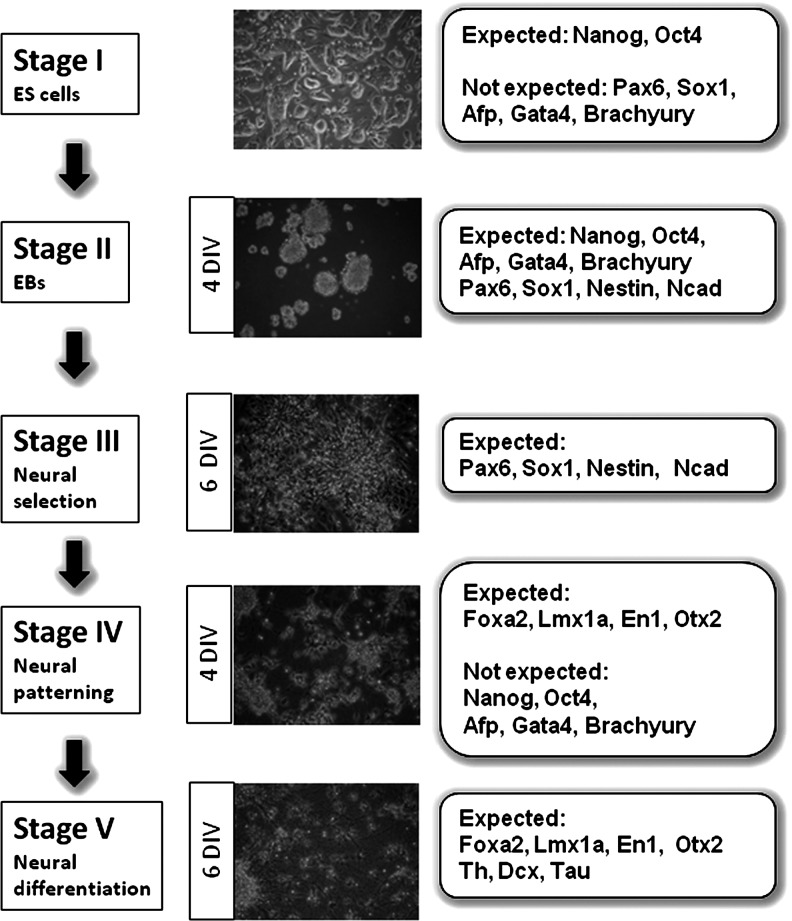
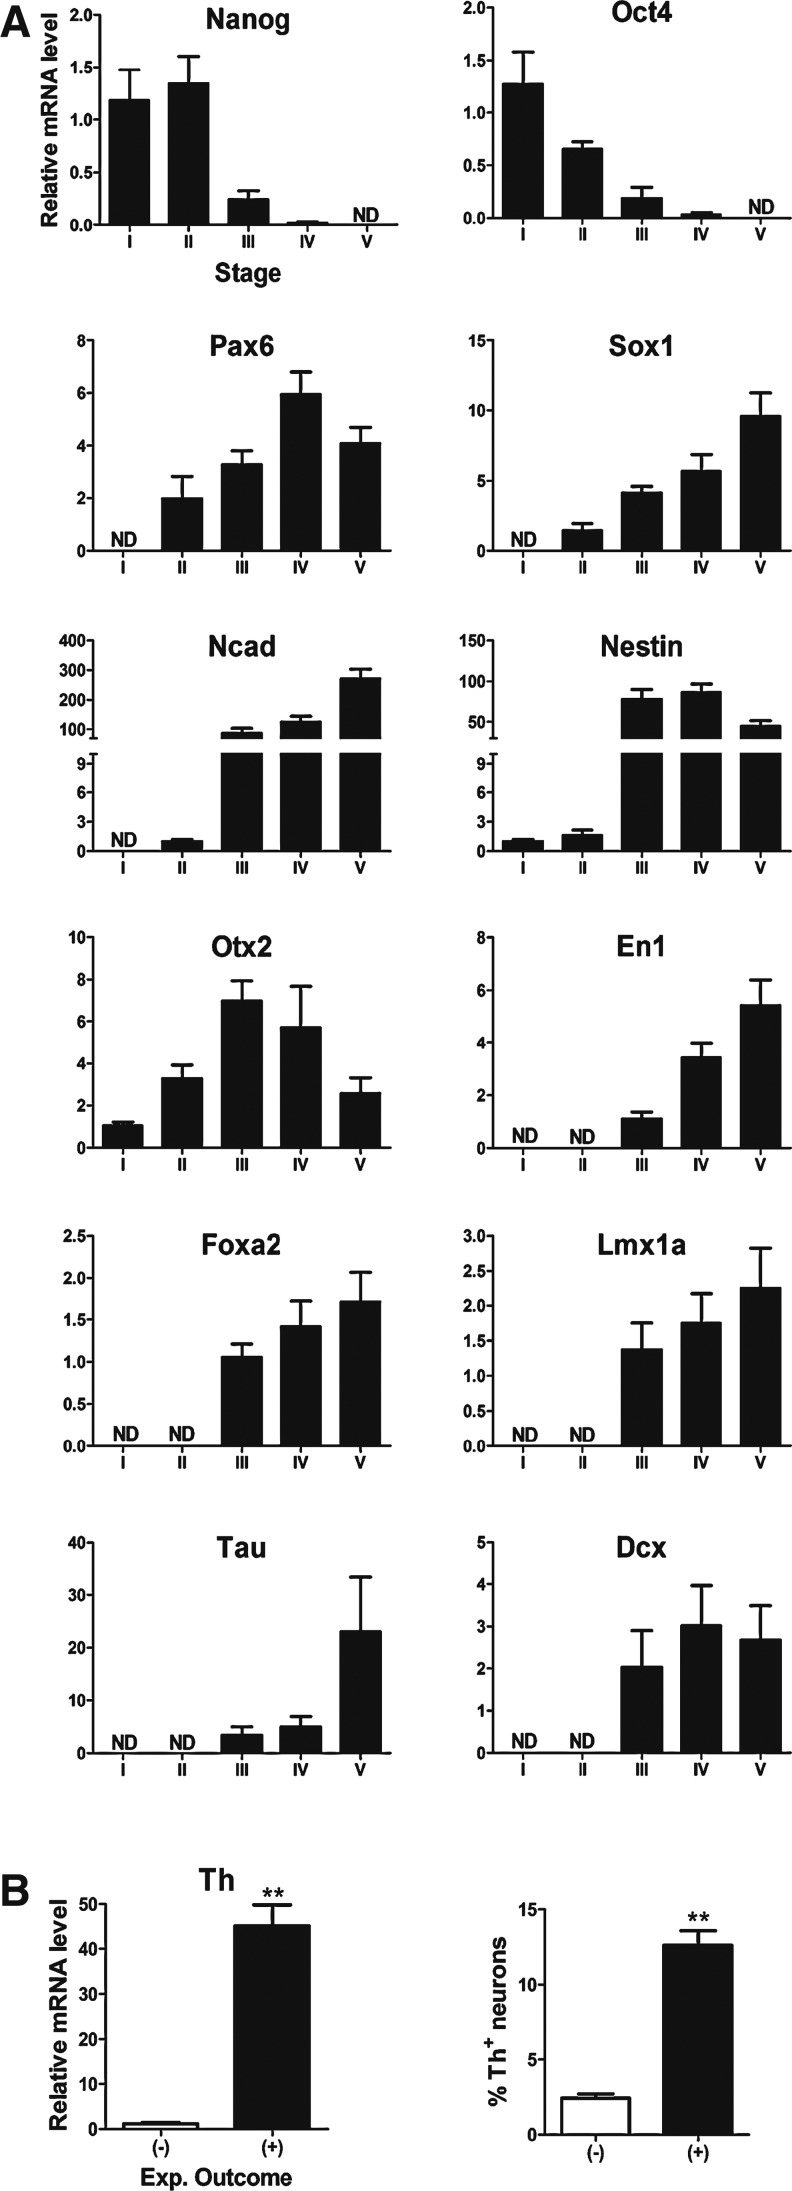
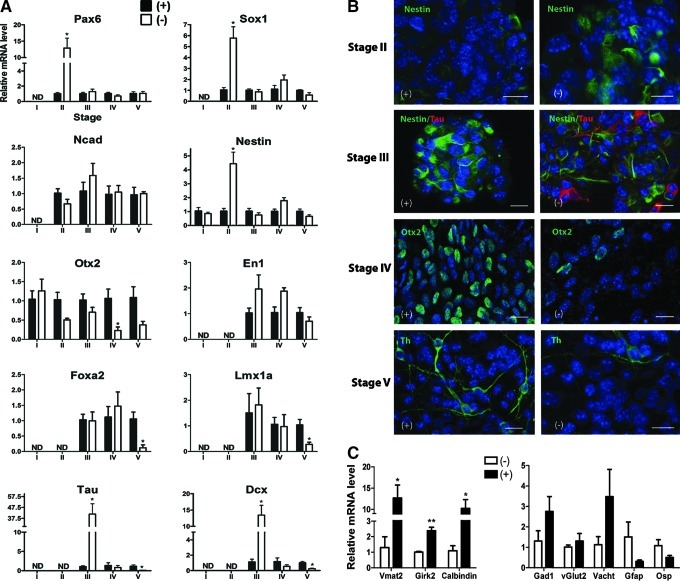
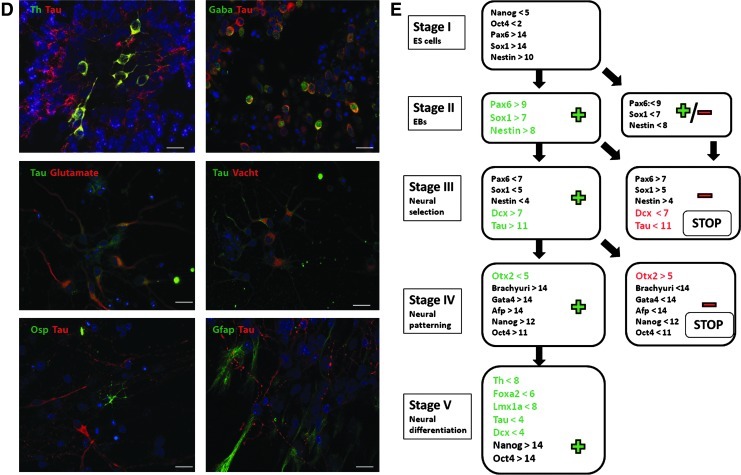
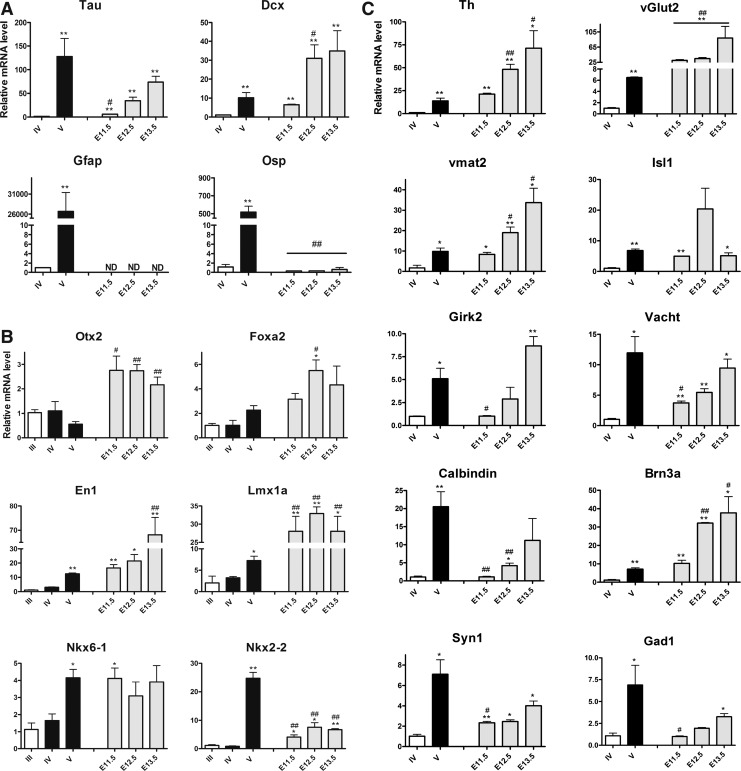
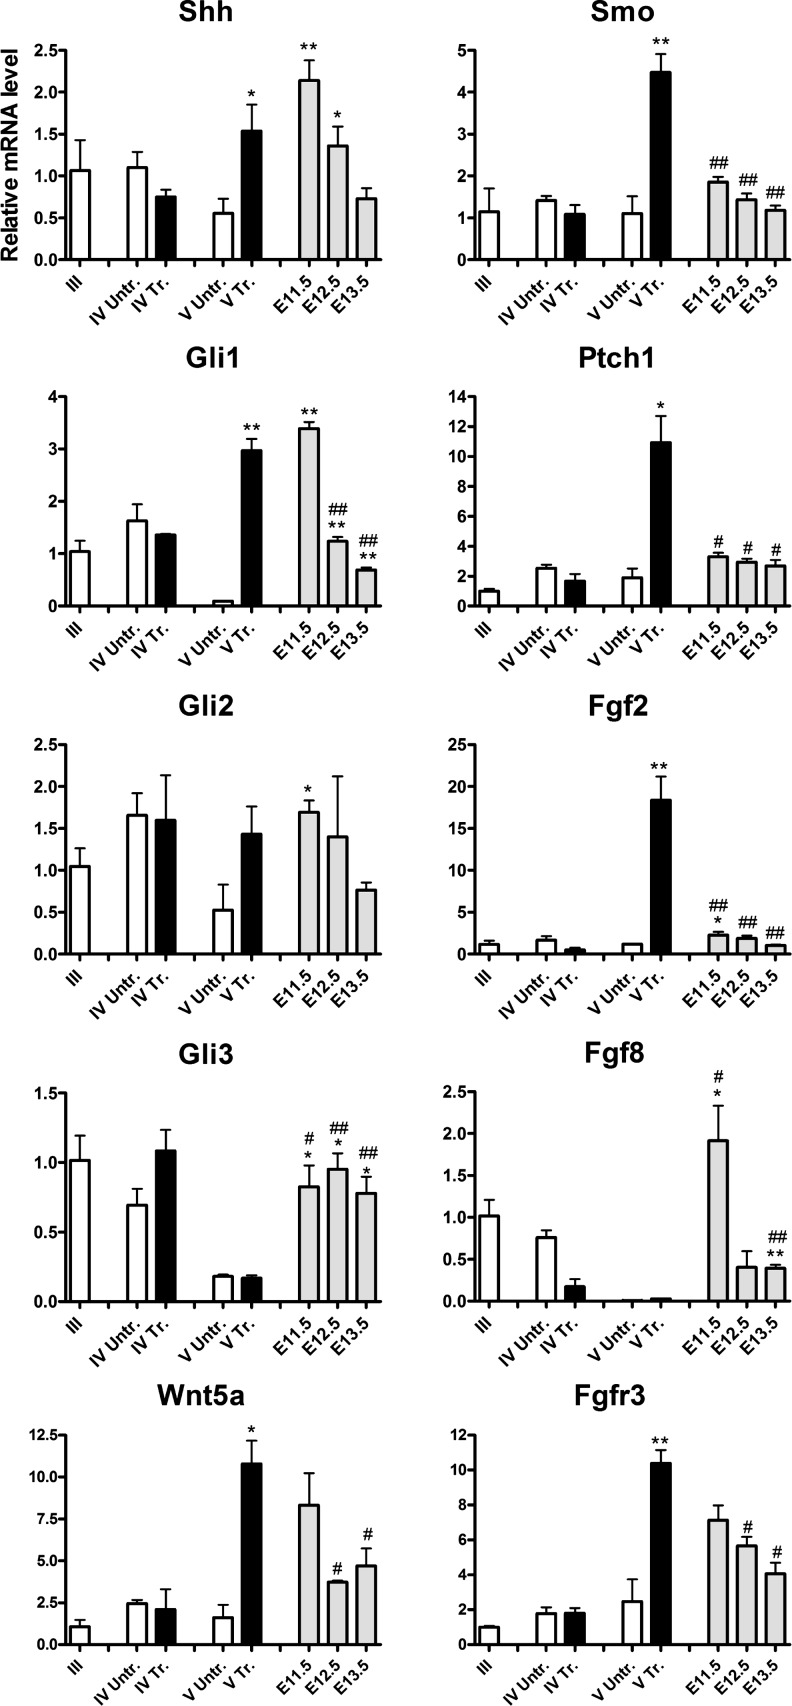
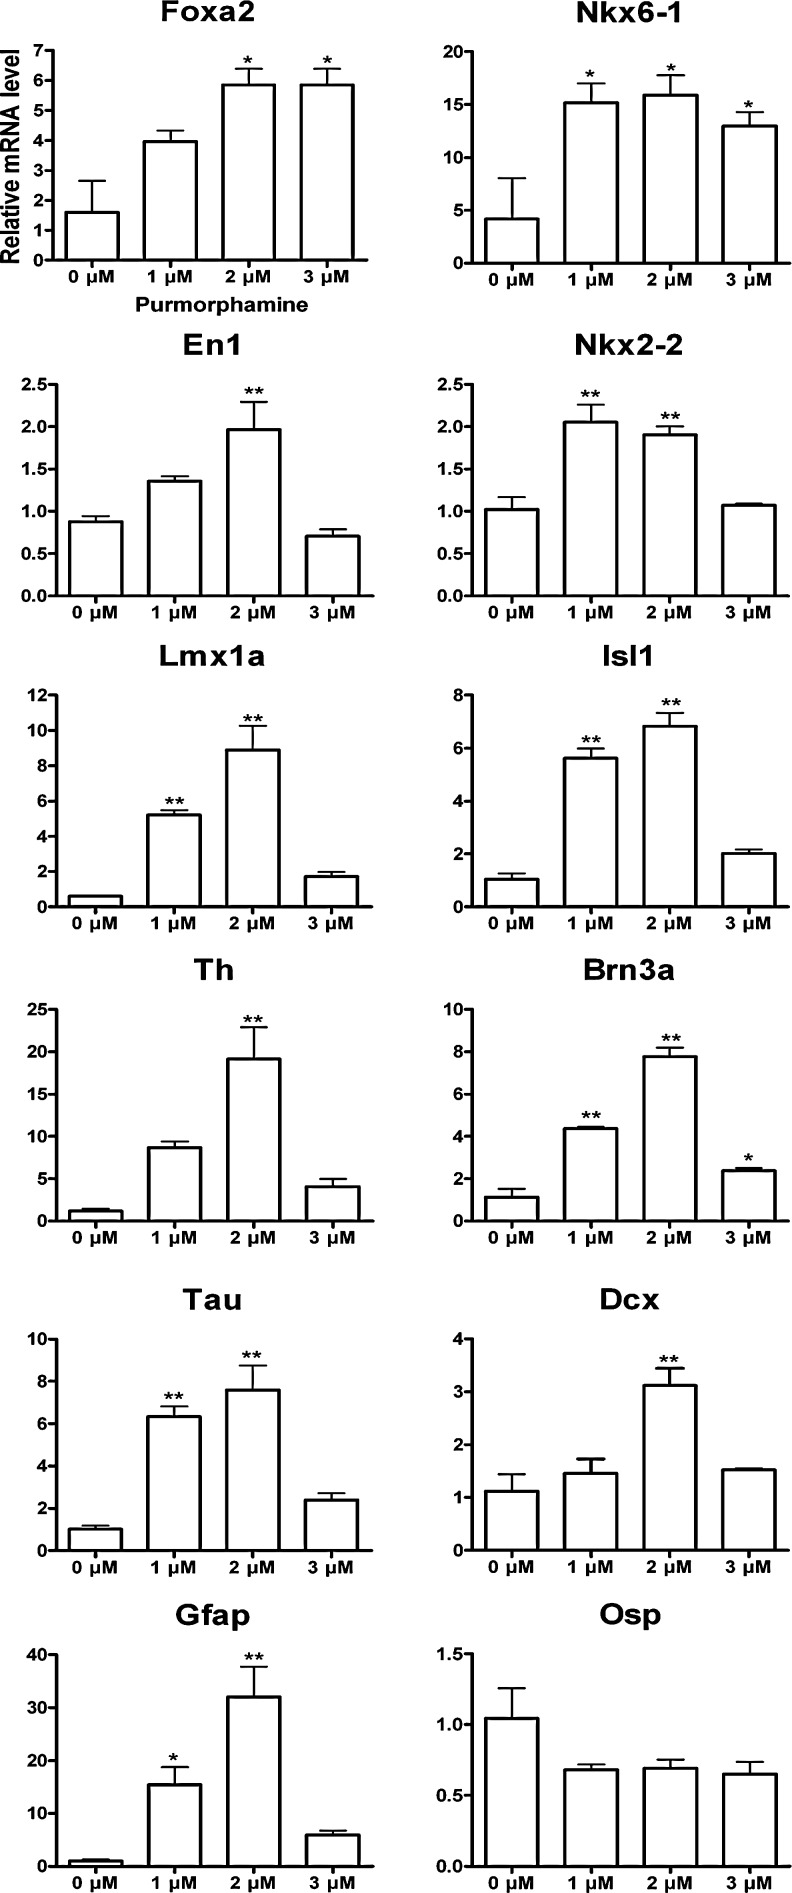
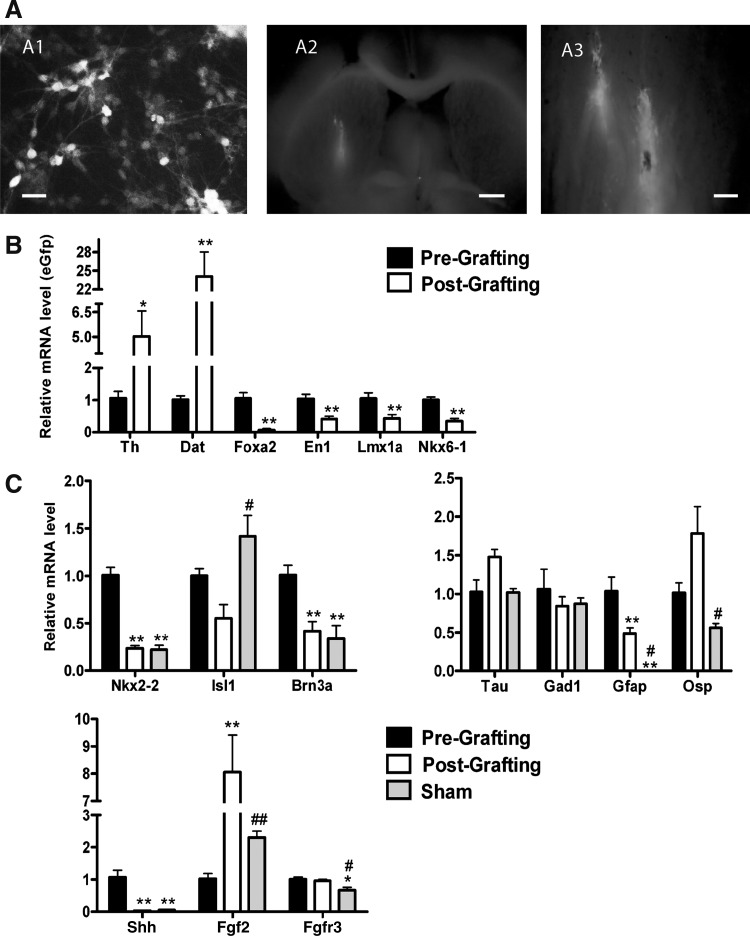
Dopaminergic neurons derived from pluripotent stem cells are among the best investigated products of in vitro stem cell differentiation owing to their potential use for neurorestorative therapy of Parkinson's disease. However, the classical differentiation protocols for both mouse and human pluripotent stem cells generate a limited percentage of dopaminergic neurons and yield a considerable cellular heterogeneity comprising numerous scarcely characterized cell populations. To improve pluripotent stem cell differentiation protocols for midbrain dopaminergic neurons, we established extensive and strictly quantitative gene expression profiles, including markers for pluripotent cells, neural progenitors, non-neural cells, pan-neuronal and glial cells, neurotransmitter phenotypes, midbrain and nonmidbrain populations, floor plate and basal plate populations, as well as for Hedgehog, Fgf, and Wnt signaling pathways. The profiles were applied to discrete stages of in vitro differentiation of mouse embryonic stem cells toward the dopaminergic lineage and after transplantation into the striatum of 6-hydroxy-dopamine-lesioned rats. The comparison of gene expression in vitro with stages in the developing ventral midbrain between embryonic day 11.5 and 13.5 ex vivo revealed dynamic changes in the expression of transcription factors and signaling molecules. Based on these profiles, we propose quantitative gene expression milestones that predict the efficiency of dopaminergic differentiation achieved at the end point of the protocol, already at earlier stages of differentiation.


Figures

FIG. 1.
FIG. 1.
Schematic representation of the 5-stage protocol of mouse ES cell differentiation toward mDAergic neurons. Expected and not expected patterns of gene expression in each stage. ES, embryonic stem; mDAergic, midbrain dopaminergic; DIV, days in vitro.
FIG. 2.
FIG. 2.
Molecular profiling of the temporal expression of expected genes in the 5-stage of mouse ES cell differentiation toward mDAergic neurons. (A) Relative mRNA expression levels for pluripotent markers, Nanog and Oct4, neural progenitor markers, Pax6, Sox1, Nestin, and Ncad, ventral midbrain (VM) markers, En1, Otx2, Foxa2, and Lmx1a as well as pan-neuronal markers, Tau and Dcx. Mean±SEM; n=6. All markers were compared to the stage, where the expression was first detected by real-time PCR. Gene expression was considered as not detected (ND) when ΔCt >14 cycles. (B) Relative mRNA levels and percentage of Th+neurons in stage V show 2 different experimental outcomes: one positive (+), where Th+ neurons were found, and another negative (−), where very few Th+ neurons were counted (see also Supplementary Table S2). Mean±SEM; n=3. **P<0.01 significantly different from (−) experimental outcome by Student t-test. Th, tyrosine hydroxylase; SEM, standard error of the mean; PCR, polymerase chain reaction.
FIG. 3.
FIG. 3.
A stage-related comparison of gene expression between the experiments with (+) and (−) outcome regarding the Th expression revealed milestones with predictive potential. (A) mRNA expression levels of neural progenitor markers, Pax6, Sox1, Nestin, and Ncad, VM markers, En1, Otx2, Foxa2, and Lmx1a as well as pan-neuronal markers, Tau and Dcx, in negative (−) experiments, relative to positive (+) experiments. Mean±SEM; n=3. *P<0.05 (Student t-test). (B) Immunostaining for Nestin in stage II, Tau and Nestin in stage III, Otx2 in stage IV, and Th in stage V in 2 representative (+) and (−) experiments. (C) Relative mRNA levels in stage V of the (+) experiments as compared to the (−) ones for the dopaminergic (Vmat2, Girk2, and Calbindin), GABAergic (Gad1), glutamatergic (vGlut2), cholinergic (Vacht), and glial (Gfap and Osp) markers. Mean±SEM; n=3. *P<0.05, **P<0.01 (Student t-test). (D) Immunostaining for Tau, Th, Gfap, Osp, GABA, Glutamate, and Vacht confirmed their expression in stage V in one representative (+) experiment. (E) Schematic representation of 5-stage protocol showing the gene expression levels in each stage that predict positive (+, green) and negative (−, red) end point outcome regarding the Th expression. The milestones are represented as mean ΔCt values (related to GAPDH). When a milestone is not reached, the prediction for a (−) outcome is followed by stopping the experiment (STOP). (B, D) Nuclear staining with DAPI (blue); scale bar: 20 μm. GAPDH, glyceraldehyde-3-phosphate dehydrogenase; DAPI, 4′, 6-diamidino-2-phenylindole. Color images available online at www.liebertpub.com/scd
FIG. 3.
FIG. 3.
A stage-related comparison of gene expression between the experiments with (+) and (−) outcome regarding the Th expression revealed milestones with predictive potential. (A) mRNA expression levels of neural progenitor markers, Pax6, Sox1, Nestin, and Ncad, VM markers, En1, Otx2, Foxa2, and Lmx1a as well as pan-neuronal markers, Tau and Dcx, in negative (−) experiments, relative to positive (+) experiments. Mean±SEM; n=3. *P<0.05 (Student t-test). (B) Immunostaining for Nestin in stage II, Tau and Nestin in stage III, Otx2 in stage IV, and Th in stage V in 2 representative (+) and (−) experiments. (C) Relative mRNA levels in stage V of the (+) experiments as compared to the (−) ones for the dopaminergic (Vmat2, Girk2, and Calbindin), GABAergic (Gad1), glutamatergic (vGlut2), cholinergic (Vacht), and glial (Gfap and Osp) markers. Mean±SEM; n=3. *P<0.05, **P<0.01 (Student t-test). (D) Immunostaining for Tau, Th, Gfap, Osp, GABA, Glutamate, and Vacht confirmed their expression in stage V in one representative (+) experiment. (E) Schematic representation of 5-stage protocol showing the gene expression levels in each stage that predict positive (+, green) and negative (−, red) end point outcome regarding the Th expression. The milestones are represented as mean ΔCt values (related to GAPDH). When a milestone is not reached, the prediction for a (−) outcome is followed by stopping the experiment (STOP). (B, D) Nuclear staining with DAPI (blue); scale bar: 20 μm. GAPDH, glyceraldehyde-3-phosphate dehydrogenase; DAPI, 4′, 6-diamidino-2-phenylindole. Color images available online at www.liebertpub.com/scd
FIG. 4.
FIG. 4.
Molecular profiling for the neural patterning and differentiation markers in vitro and in vivo. (A) Neuronal and glial differentiation. Relative mRNA expression levels of the neuronal (Tau and Dcx) and the glial (Gfap and Osp) markers after neural patterning and differentiation in all experiments presenting (+) milestones and in the mouse embryonic VM at embryonic (E) day 11.5, E12.5, and E13.5. Levels of expression are compared with stage IV and presented as mean±SEM; n=3–4. (B) VM patterning in vitro and in vivo. Relative mRNA expression levels of the midbrain (Otx2 and En1), floor plate (Foxa2 and Lmx1a), and basal plate (Nkx6-1 and Nkx2-2) markers after neural patterning and differentiation in all experiments with (+) milestones and in the mouse VM at E11.5, E12.5, and E13.5. Levels of expression are compared with stage III and presented as mean±SEM; n=3–4. (C) Neuronal specification in vitro and in vivo. Relative mRNA expression levels of the dopaminergic markers (Th, Vmat2, Girk2, and Calbindin), the glutamatergic marker (vGlut2), and the GABAergic markers (Gad1 and Brn3a) as well as the cholinergic markers (Vacht and Isl1) and the synaptic marker (Syn1) after neural differentiation in the 5-stage protocol experiments with (+) milestones and in the mouse VM at E11.5, E12.5, and E13.5. Mean±SEM; n=3–4; *P<0.05; **P<0.01 significantly different from stage IV by Student t-test. #P<0.05; ##P<0.01 significantly different from stage V by Student t-test. ND, not detected.
FIG. 5.
FIG. 5.
Molecular profiling for the Hh, Fgf, and Wnt pathways in vitro versus in vivo. Relative mRNA expression levels of the Hh pathway (Shh, Gli1, Gli2, and Gli3) and receptors (Smo and Ptch1), Fgf signaling (Fgf2, Fgf8, and Fgfr3) and Wnt signaling (Wnt1 and Wnt5a) in protocol of mouse ES differentiation toward dopaminergic neurons in treated (Tr., purmorphamine+Fgf2+Fgf8) and untreated (Untr.) experimental conditions of mouse ES differentiation and in the mouse VM at embryonic (E) day 11.5, E12.5, and E13.5. Mean±SEM; n=3–4; *P<0.05; **P<0.01 significantly different from stage V untreated by Student t-test. #P<0.05; ##P<0.01 significantly different from stage V treated by Student t-test. Hh, Hedgehog.
FIG. 6.
FIG. 6.
Molecular profiling for the VM patterning, neuronal and glial specification related to Hh modulation in vitro. Relative mRNA expression levels of the floor plate markers Th, Foxa2, En1, and Lmx1a, and the basal plate markers Nkx6-1, Nkx2-2, Isl1, and Brn3a, the neuronal markers Tau and Dcx and the glial markers Gfap and Osp at the end point of the 5-stage protocol treated with purmorphamine concentrations of 1, 2, and 3 μM, as compared to untreated controls (0 μM). Mean±SEM; n=3; *P<0.05; **P<0.01 significantly different from 0 μM purmorphamine by Student-Newman-Keul's post hoc test.
FIG. 7.
FIG. 7.
Molecular profiling for the neural, midbrain, and signaling pathway markers in the cells grafted in an animal model of Parkinson's disease. (A) Fluorescent cells detected before transplantation (A1) and in the striatum (A2, A3) of a 6-hydroxy-dopamine-lesioned rat model. Scale bars: 20 μm (A1), 1 mm (A2), 200 μm (A3). (B) Relative mRNA expression levels of Th, Dat, Foxa2, En1, Lmx1a, and Nkx6-1 of the mouse eGfp-ES cell-derived grafts 6 weeks after transplantation, as compared to pregrafted cells at the end point of the 5-stage protocol. Levels of expression are normalized to eGfp and presented as mean±SEM; n=6 at 6 weeks after grafting; *P<0.05; **P<0.01 significantly different from pregrafting by Student t-test. (C) Relative mRNA expression levels of Nkx2-2, Isl1, and Brn3a as well as Tau, Gad1, Gfap, Osp and Shh, Fgf2 and Fgfr3. Levels of expression are normalized to Gapdh, compared to the levels in the striatum of sham animals and presented as mean±SEM; n=6; *P<0.05; **P<0.01 significantly different from pregrafting by Student-Newman-Keul's post hoc test. #P<0.05, ##P<0.01 significantly different from postgrafting by Student-Newman-Keul's post hoc test. eGfp, enhanced green fluorescent protein.

Similar articles

Cited by

References

    1. Lee SH. Lumelsky N. Studer L. Auerbach JM. McKay RD. Efficient generation of midbrain and hindbrain neurons from mouse embryonic stem cells. Nat Biotechnol. 2000;18:675–679. - PubMed
    1. Barberi T. Klivenyi P. Calingasan NY. Lee H. Kawamata H, et al. Neural subtype specification of fertilization and nuclear transfer embryonic stem cells and application in parkinsonian mice. Nat Biotechnol. 2003;21:1200–1207. - PubMed
    1. Kim JH. Auerbach JM. Rodriguez-Gómez JA. Velasco I. Gavin D, et al. Dopamine neurons derived from embryonic stem cells function in an animal model of Parkinson's disease. Nature. 2002;418:50–56. - PubMed
    1. Cho MS. Lee Y-E. Kim JY. Chung S. Cho YH, et al. Highly efficient and large-scale generation of functional dopamine neurons from human embryonic stem cells. Proc Natl Acad Sci U S A. 2008;105:3392–3397. - PMC - PubMed
    1. Yan Y. Yang D. Zarnowska ED. Du Z. Werbel B, et al. Directed differentiation of dopaminergic neuronal subtypes from human embryonic stem cells. Stem cells. 2005;23:781–790. - PMC - PubMed

Publication types

MeSH terms

Substances