Cerebrospinal fluid biomarkers of neuropathologically diagnosed Parkinson's disease subjects
- PMID: 22889670
- PMCID: PMC3681206
- DOI: 10.1179/1743132812Y.0000000063
Cerebrospinal fluid biomarkers of neuropathologically diagnosed Parkinson's disease subjects
Abstract
Objectives: Parkinson's disease (PD) afflicts approximately 1-2% of the population over 50 years of age. No cures or effective modifying treatments exist and clinical diagnosis is currently confounded by a lack of definitive biomarkers. We sought to discover potential biomarkers in the cerebrospinal fluid (CSF) of neuropathologically confirmed PD cases.
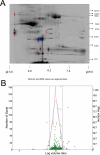
Methods: We compared postmortem ventricular CSF (V-CSF) from PD and normal control (NC) subjects using two-dimensional difference gel electrophoresis (2D-DIGE). Spots exhibiting a 1·5-fold or greater difference in volume between PD patients and controls were excised from the two-dimensional gels, subjected to tryptic digestion and identification of peptides assigned using mass spectrometric/data bank correlation methods.
Results: Employing this strategy six molecules: fibrinogen, transthyretin, apolipoprotein E, clusterin, apolipoprotein A-1, and glutathione-S-transferase-Pi, were found to be different between PD and NC populations.
Discussion: These molecules have been implicated in PD pathogenesis. Combining biomarker data from multiple laboratories may create a consensus panel of proteins that may serve as a diagnostic tool for this neurodegenerative disorder.
Figures

References
-
- Thomas B, Beal MF. Parkinson's disease. Hum Mol Genet. 2007;16:R183–R194. Spec No. 2. - PubMed
-
- Wirdefeldt K, Adami HO, Cole P, et al. Epidemiology and etiology of Parkinson's disease: a review of the evidence. Eur J Epidemiol. 2011;26(Suppl 1):S1–58. - PubMed
-
- Rajput AH, Rozdilsky B, Rajput A. Accuracy of clinical diagnosis in parkinsonism--a prospective study. Can J Neurol Sci. 1991;18:275–78. - PubMed
-
- Hughes AJ, Daniel SE, Lees AJ. Improved accuracy of clinical diagnosis of Lewy body Parkinson's disease. Neurology. 2001;57:1497–99. - PubMed
Publication types
MeSH terms
Substances
Grants and funding
LinkOut - more resources
Full Text Sources
Medical
Research Materials
Miscellaneous
