

Spatiotemporal autophagic degradation of oxidatively damaged organelles after photodynamic stress is amplified by mitochondrial reactive oxygen species
- PMID: 22889744
- PMCID: PMC3442878
- DOI: 10.4161/auto.20763
Spatiotemporal autophagic degradation of oxidatively damaged organelles after photodynamic stress is amplified by mitochondrial reactive oxygen species
Abstract
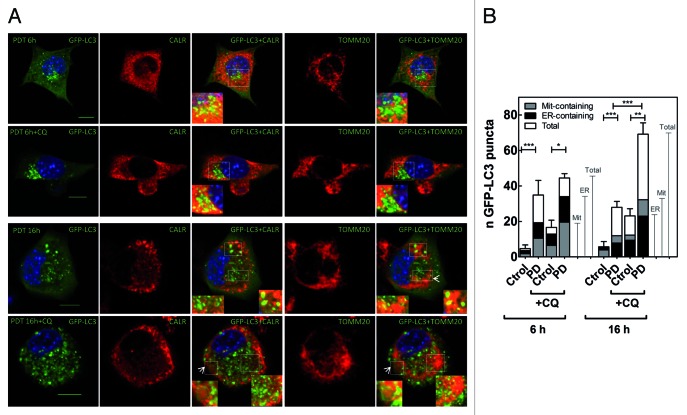
Although reactive oxygen species (ROS) have been reported to evoke different autophagic pathways, how ROS or their secondary products modulate the selective clearance of oxidatively damaged organelles is less explored. To investigate the signaling role of ROS and the impact of their compartmentalization in autophagy pathways, we used murine fibrosarcoma L929 cells overexpressing different antioxidant enzymes targeted to the cytosol or mitochondria and subjected them to photodynamic (PD) stress with the endoplasmic reticulum (ER)-associated photosensitizer hypericin. We show that following apical ROS-mediated damage to the ER, predominantly cells overexpressing mitochondria-associated glutathione peroxidase 4 (GPX4) and manganese superoxide dismutase (SOD2) displayed attenuated kinetics of autophagosome formation and overall cell death, as detected by computerized time-lapse microscopy. Consistent with a primary ER photodamage, kinetics and colocalization studies revealed that photogenerated ROS induced an initial reticulophagy, followed by morphological changes in the mitochondrial network that preceded clearance of mitochondria by mitophagy. Overexpression of cytosolic and mitochondria-associated GPX4 retained the tubular mitochondrial network in response to PD stress and concomitantly blocked the progression toward mitophagy. Preventing the formation of phospholipid hydroperoxides and H(2)O(2) in the cytosol as well as in the mitochondria significantly reduced cardiolipin peroxidation and apoptosis. All together, these results show that in response to apical ER photodamage ROS propagate to mitochondria, which in turn amplify ROS production, thereby contributing to two antagonizing processes, mitophagy and apoptosis.
Figures


Similar articles
-
Endoplasmic reticulum-targeting photosensitizer Hypericin confers chemo-sensitization towards oxaliplatin through inducing pro-death autophagy.Int J Biochem Cell Biol. 2017 Jun;87:54-68. doi: 10.1016/j.biocel.2017.04.001. Epub 2017 Apr 6. Int J Biochem Cell Biol. 2017. PMID: 28392376
-
Photodynamic therapy: autophagy and mitophagy, apoptosis and paraptosis.Autophagy. 2020 Nov;16(11):2098-2101. doi: 10.1080/15548627.2020.1783823. Epub 2020 Jun 25. Autophagy. 2020. PMID: 32584644 Free PMC article.
-
Autophagy pathways activated in response to PDT contribute to cell resistance against ROS damage.J Cell Mol Med. 2011 Jun;15(6):1402-14. doi: 10.1111/j.1582-4934.2010.01118.x. Epub 2010 Jul 7. J Cell Mol Med. 2011. PMID: 20626525 Free PMC article.
-
Autophagic death probed by photodynamic therapy.Autophagy. 2015;11(10):1941-3. doi: 10.1080/15548627.2015.1078960. Autophagy. 2015. PMID: 26313747 Free PMC article. Review.
-
Pathological and Pharmacological Roles of Mitochondrial Reactive Oxygen Species in Malignant Neoplasms: Therapies Involving Chemical Compounds, Natural Products, and Photosensitizers.Molecules. 2020 Nov 11;25(22):5252. doi: 10.3390/molecules25225252. Molecules. 2020. PMID: 33187225 Free PMC article. Review.
Cited by
-
Antioxidant network-based signatures cluster glioblastoma into distinct redox-resistant phenotypes.Front Immunol. 2024 Apr 18;15:1342977. doi: 10.3389/fimmu.2024.1342977. eCollection 2024. Front Immunol. 2024. PMID: 38698847 Free PMC article.
-
Inhibition of autophagy sensitizes cancer cells to Photofrin-based photodynamic therapy.BMC Cancer. 2018 Feb 20;18(1):210. doi: 10.1186/s12885-018-4126-y. BMC Cancer. 2018. PMID: 29463237 Free PMC article.
-
GPX4 in cell death, autophagy, and disease.Autophagy. 2023 Oct;19(10):2621-2638. doi: 10.1080/15548627.2023.2218764. Epub 2023 Jun 4. Autophagy. 2023. PMID: 37272058 Free PMC article. Review.
-
NEAT1 Confers Radioresistance to Hepatocellular Carcinoma Cells by Inducing PINK1/Parkin-Mediated Mitophagy.Int J Mol Sci. 2022 Nov 19;23(22):14397. doi: 10.3390/ijms232214397. Int J Mol Sci. 2022. PMID: 36430876 Free PMC article.
-
CO/light dual-activatable Ru(ii)-conjugated oligomer agent for lysosome-targeted multimodal cancer therapeutics.Chem Sci. 2021 Jul 21;12(34):11515-11524. doi: 10.1039/d1sc01317c. eCollection 2021 Sep 1. Chem Sci. 2021. PMID: 34667555 Free PMC article.
References
Publication types
MeSH terms
Substances
LinkOut - more resources
Full Text Sources