

Genome-wide association study of obsessive-compulsive disorder
- PMID: 22889921
- PMCID: PMC4218751
- DOI: 10.1038/mp.2012.85
Genome-wide association study of obsessive-compulsive disorder
Erratum in
- Mol Psychiatry. 2013 Jul;18(7):843. Davis, L K [added]
Abstract
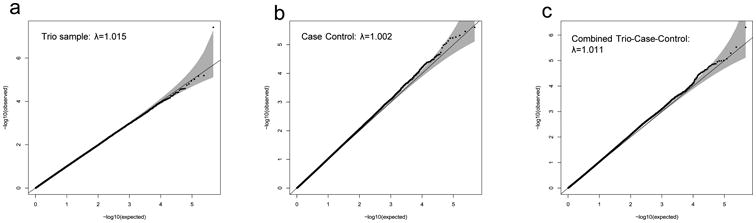
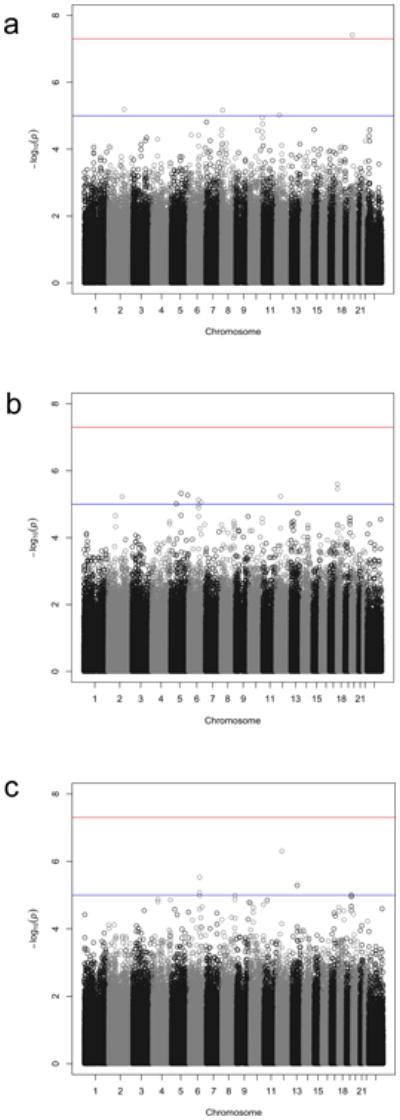
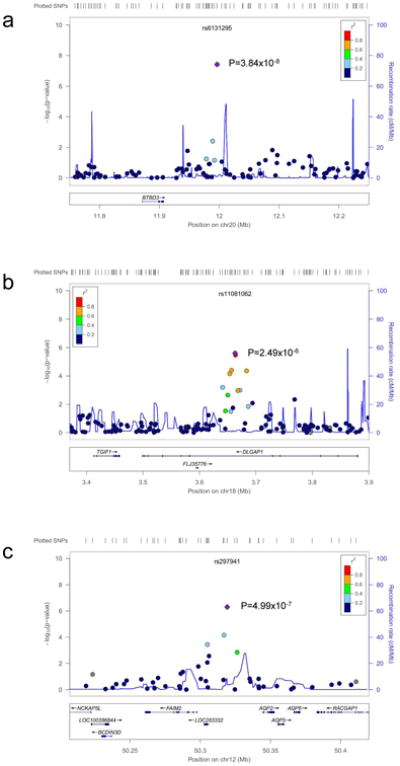
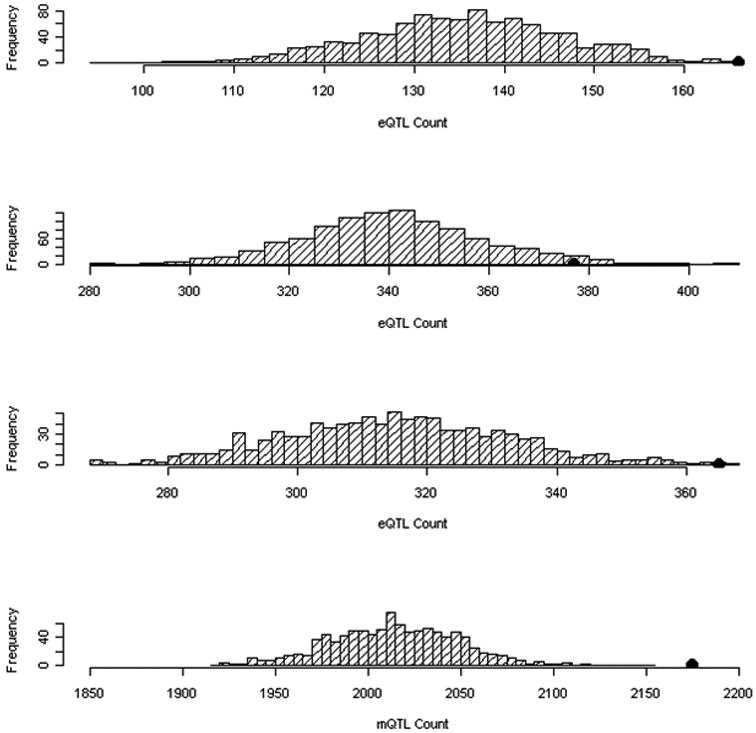
Obsessive-compulsive disorder (OCD) is a common, debilitating neuropsychiatric illness with complex genetic etiology. The International OCD Foundation Genetics Collaborative (IOCDF-GC) is a multi-national collaboration established to discover the genetic variation predisposing to OCD. A set of individuals affected with DSM-IV OCD, a subset of their parents, and unselected controls, were genotyped with several different Illumina SNP microarrays. After extensive data cleaning, 1465 cases, 5557 ancestry-matched controls and 400 complete trios remained, with a common set of 469,410 autosomal and 9657 X-chromosome single nucleotide polymorphisms (SNPs). Ancestry-stratified case-control association analyses were conducted for three genetically-defined subpopulations and combined in two meta-analyses, with and without the trio-based analysis. In the case-control analysis, the lowest two P-values were located within DLGAP1 (P=2.49 × 10(-6) and P=3.44 × 10(-6)), a member of the neuronal postsynaptic density complex. In the trio analysis, rs6131295, near BTBD3, exceeded the genome-wide significance threshold with a P-value=3.84 × 10(-8). However, when trios were meta-analyzed with the case-control samples, the P-value for this variant was 3.62 × 10(-5), losing genome-wide significance. Although no SNPs were identified to be associated with OCD at a genome-wide significant level in the combined trio-case-control sample, a significant enrichment of methylation QTLs (P<0.001) and frontal lobe expression quantitative trait loci (eQTLs) (P=0.001) was observed within the top-ranked SNPs (P<0.01) from the trio-case-control analysis, suggesting these top signals may have a broad role in gene expression in the brain, and possibly in the etiology of OCD.
Figures
References
-
- Kaplan HI, Sadock BJ. Study guide and self-examination review for Kaplan and Sadock's synopsis of psychiatry. 6th. Williams & Wilkins; Baltimore: 1998. p. 541.
-
- Karno M, Golding JM, Sorenson SB, Burnam MA. The epidemiology of obsessive-compulsive disorder in five US communities. Arch Gen Psychiatry. 1988;45(12):1094–1099. - PubMed
-
- Blazer DG, Kessler RC, McGonagle KA, Swartz MS. The prevalence and distribution of major depression in a national community sample: the National Comorbidity Survey. Am J Psychiatry. 1994;151(7):979–986. - PubMed
-
- Ayuso-Mateos J. Global Burden of obsessive-compulsive disorder in the year 2000. World Health Organization; 2006.
Publication types
MeSH terms
Substances
Grants and funding
- K23 MH085057/MH/NIMH NIH HHS/United States
- MR/K01417X/1/MRC_/Medical Research Council/United Kingdom
- P01 CA089392/CA/NCI NIH HHS/United States
- U01 NS040024/NS/NINDS NIH HHS/United States
- MR/J006742/1/MRC_/Medical Research Council/United Kingdom
- R01 NS016648/NS/NINDS NIH HHS/United States
- MH085057/MH/NIMH NIH HHS/United States
- R01 MH079489/MH/NIMH NIH HHS/United States
- U01 HG004422/HG/NHGRI NIH HHS/United States
- R01 DA013423/DA/NIDA NIH HHS/United States
- R01 NS040024/NS/NINDS NIH HHS/United States
- NS16648-29S1/NS/NINDS NIH HHS/United States
- U10 AA008401/AA/NIAAA NIH HHS/United States
- U54 RR020278/RR/NCRR NIH HHS/United States
- R13 MH073250/MH/NIMH NIH HHS/United States
- MH073250/MH/NIMH NIH HHS/United States
- U01HG004438/HG/NHGRI NIH HHS/United States
- Z01 AG000932/ImNIH/Intramural NIH HHS/United States
- U01 HG004438/HG/NHGRI NIH HHS/United States
- G0802462/MRC_/Medical Research Council/United Kingdom
- U01 HG004446/HG/NHGRI NIH HHS/United States
- Z01 AG000932-02/AG/NIA NIH HHS/United States
- G0701075/MRC_/Medical Research Council/United Kingdom
- NS40024-07S1/NS/NINDS NIH HHS/United States
- MH079489/MH/NIMH NIH HHS/United States
- G0901254/MRC_/Medical Research Council/United Kingdom
LinkOut - more resources
Full Text Sources
Medical
Molecular Biology Databases
Miscellaneous
