. 2012 Oct;40(10):2850-7.
doi: 10.1097/CCM.0b013e31825b91ef.

Ventilation with "clinically relevant" high tidal volumes does not promote stretch-induced injury in the lungs of healthy mice

Affiliations

Ventilation with "clinically relevant" high tidal volumes does not promote stretch-induced injury in the lungs of healthy mice

Michael R Wilson et al. Crit Care Med. 2012 Oct.

Abstract

Objective: Ventilator-induced lung injury is a crucial determinant of the outcome of mechanically ventilated patients. Increasing numbers of mouse studies have identified numerous pathways and mediators that are modulated by ventilation, but it is conceptually difficult to reconcile these into a single paradigm. There is substantial variability in tidal volumes used in these studies and no certainty about the pathophysiology that such varied models actually represent. This study was designed to investigate whether ventilation strategies ranging from "very high" to more "clinically relevant" tidal volumes induce similar pathophysiologies in healthy mice or represent distinct entities.

Design: In vivo study.

Setting: University research laboratory.

Subjects: C57/Bl6 mice.

Interventions: Anesthetized mice were ventilated with various tidal volumes up to 40 mL/kg.

Measurements and main results: Respiratory system compliance and arterial blood gases were used to evaluate physiological variables of injury. Lung wet:dry weight ratio, lavage fluid protein, and cytokines were used to assess pulmonary edema and inflammation. All ventilation strategies induced changes in respiratory system compliance, although the pattern of change was unique for each strategy. Ventilation with 10 mL/kg and 40 mL/kg also induced decreases in arterial PO2 and blood pressure. Any physiological changes induced during the 10, 20, and 30 mL/kg strategies were largely reversed by recruitment maneuvers at the end of the protocol. Markers of pulmonary edema and inflammation indicated that only 40 mL/kg induced substantial increases in both, consistent with development of lung injury.

Conclusions: Tidal volumes up to 20 mL/kg are unlikely to induce substantial lung overstretch in models using healthy, young mice. Signs of injury/inflammation using such models are likely to result from other factors, particularly alveolar derecruitment and atelectasis. The results of such studies may need to be reevaluated before clinical relevance can be accurately determined.


Figures

Figure 1
Figure 1
A) Time course of change in arterial blood pressure during ventilation. B) Kaplan-Meier analysis, using 50mmHg as a surrogate for death, indicated that 40ml/kg VT induced significantly higher ‘mortality’ than all other ventilation strategies (*p<0.05 by Log-rank test). C) Change in peak inspiratory pressure, and D) change in respiratory system compliance during ventilation. Each VT strategy induced distinct patterns of changes in peak inspiratory pressure (PIP) and compliance (Crs). 10ml/kg, 20ml/kg and 30ml/kg all induced increased PIP and decreased Crs which started immediately, but were largely reversible by recruitment maneuvers (RM) carried out at the end. The changes observed during 10ml/kg VT were effectively prevented by RM throughout the protocol (10ml/kg + RM group). In contrast, 40ml/kg induced an initial decrease in PIP and increase in Crs (presumably a result of continuous alveolar recruitment), which only deteriorated towards the end of the protocol, and were not reversible by RM. The variability in PIP and Crs apparent towards the end of the 40ml/kg protocol was primarily due to loss of animals as they became hemodynamically unstable at different times. Data are presented as mean with error bars representing upper or lower limit of 95% confidence interval. N=4-6 / group (at the start of experiments).
Figure 2
Figure 2
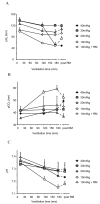
Time course of change in arterial oxygenation (A), carbon dioxide (B) and pH (C) during ventilation. Blood gases were well maintained in most of the groups throughout 3 hours. The exceptions were 10ml/kg (without RM) and 40ml/kg, which showed substantial deteriorations. Changes in parameters were substantially reversed by recruitment maneuvers at the end of the 10ml/kg but not the 40ml/kg strategy, although it should be noted that post-RM blood gases could only be evaluated in a very small number of 40ml/kg animals due to their extremely low blood pressure at this point. Data are presented as mean with error bars representing upper or lower limit of 95% confidence interval. N=4-6 / group (at the start of experiments).
Figure 3
Figure 3
Alveolar-epithelial barrier permeability assessed by lung wet:dry weight ratio (A) and lavage fluid protein (B) following ventilation. Both 10 and 20ml/kg VT marginally increased wet:dry ratio and lavage fluid protein compared to non-ventilated control (NVC) mice. The addition of RM throughout (10ml/kg + RM) attenuated any changes induced by 10ml/kg ventilation, while 30ml/kg VT did not lead to any further increases in markers of permeability. In contrast, 40ml/kg VT induced substantial changes in both markers compared to all other groups. For wet:dry ratio (A), data were log-transformed for analysis and back-transformed for display. Confidence intervals are therefore not symmetrical around the mean, so data are presented as (geometric) mean with error bars representing upper and lower limit of 95% confidence interval. For lavage protein (B), data are presented as (arithmetic) mean with error bars representing upper and lower limit of 95% confidence interval. N=4-5 / group. *p<0.05, **p<0.01, ***p<0.001 by ANOVA with Tukey’s post test.
Figure 4
Figure 4
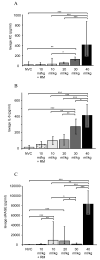
Intra-alveolar inflammation evaluated by lavage fluid levels of KC (A), IL-6 (B) and soluble RAGE (C). KC and IL-6 levels were only increased following 30 or 40ml/kg VT compared to untreated NVC animals. In contrast, both 10ml/kg (without RM) and 20ml/kg somewhat increased sRAGE, whilst 30ml/kg did not. The addition of RM throughout the 10ml/kg protocol (10ml/kg + RM) attenuated sRAGE levels virtually back to those observed in NVC. 40ml/kg led to significantly increased sRAGE, compared to all other groups. For KC (A) and sRAGE (C), data were log-transformed for analysis and back-transformed for display. Data are presented as (geometric) mean with error bars representing upper and lower limit of 95% confidence interval. For IL-6 (B), data are presented as (arithmetic) mean with error bars representing upper and lower limit of 95% confidence interval. N=4-5 / group. *p<0.05, **p<0.01, ***p<0.001 by ANOVA with Tukey’s post test.
Figure 5
Figure 5
Histological examination indicated minimal changes between samples from untreated non-ventilated control (NVC) mice and ventilation with 10ml/kg (without RM). In contrast, ventilation with 40ml/kg promoted increased infiltration of neutrophils into the lung tissue (closed arrows), as well as alveolar wall thickening and the presence of proteinaceous material within the alveolar space (open arrows). Magnification x400.
Figure 6
Figure 6
Pressure-volume curve of 5 individual mice (A). Mice were ventilated using positive-pressure ventilation with an increasing inspiratory flow. VT was plotted against plateau pressure (Pplat). There was no flattening of the curves after reaching an inflection point at ~24-28ml/kg, indicating that the lungs continued to expand even up to 50-60ml/kg. Panel B shows real-time recordings of airway flow and peak inspiratory pressure against time during pressure-volume determination experiments. Within 5 minutes of switching from positive pressure ventilation to continuous positive airway pressure (CPAP), all mice began spontaneous breathing, indicating that even inflation up to VT 60ml/kg / ~65 cmH2O Pplat does not cause overt, immediate lung damage.

References

    1. Ventilation with lower tidal volumes as compared with traditional tidal volumes for acute lung injury and the acute respiratory distress syndrome. The Acute Respiratory Distress Syndrome Network. N Engl J Med. 2000;342:1301–8. - PubMed
    1. Belperio JA, Keane MP, Burdick MD, et al. Critical role for CXCR2 and CXCR2 ligands during the pathogenesis of ventilator-induced lung injury. J Clin Invest. 2002;110:1703–16. - PMC - PubMed
    1. Wilson MR, Choudhury S, Goddard ME, et al. High tidal volume upregulates intrapulmonary cytokines in an in vivo mouse model of ventilator-induced lung injury. J Appl Physiol. 2003;95:1385–93. - PubMed
    1. Vaporidi K, Francis RC, Bloch KD, et al. Nitric oxide synthase 3 contributes to ventilator-induced lung injury. Am J Physiol Lung Cell Mol Physiol. 2010;299:L150–9. - PMC - PubMed
    1. Peltekova V, Engelberts D, Otulakowski G, et al. Hypercapnic acidosis in ventilator-induced lung injury. Intensive Care Med. 2010;36:869–78. - PubMed

Publication types