. 2013 Jun 13;32(24):2973-83.
doi: 10.1038/onc.2012.309. Epub 2012 Aug 13.

Plk1 is upregulated in androgen-insensitive prostate cancer cells and its inhibition leads to necroptosis

Affiliations

Plk1 is upregulated in androgen-insensitive prostate cancer cells and its inhibition leads to necroptosis

A Deeraksa et al. Oncogene. .

Abstract

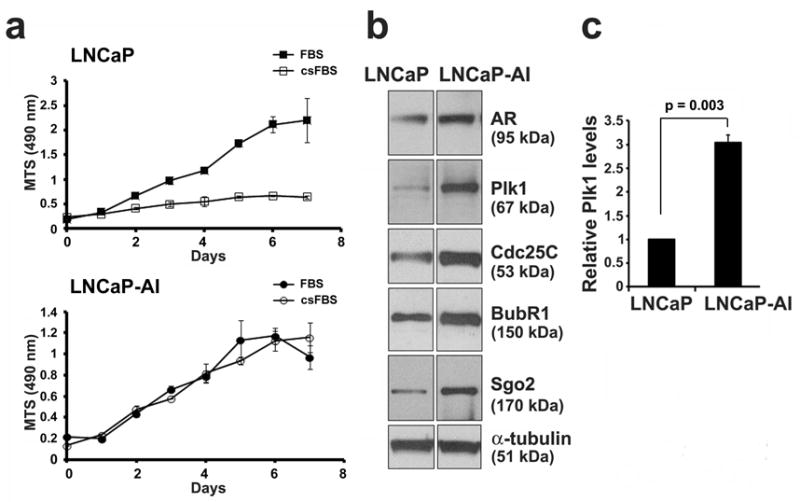
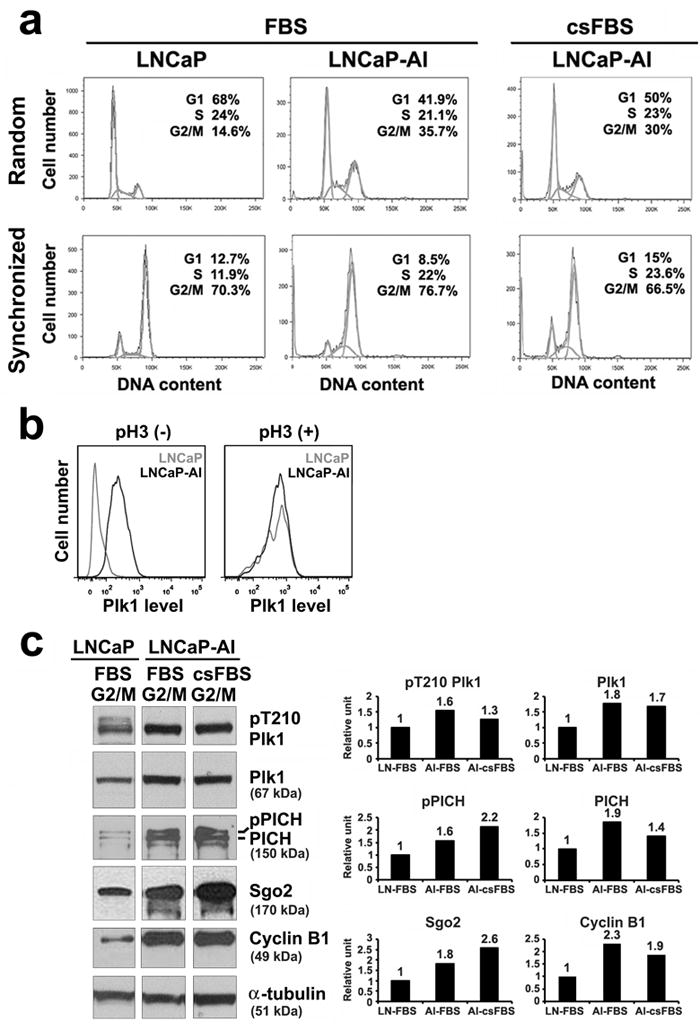
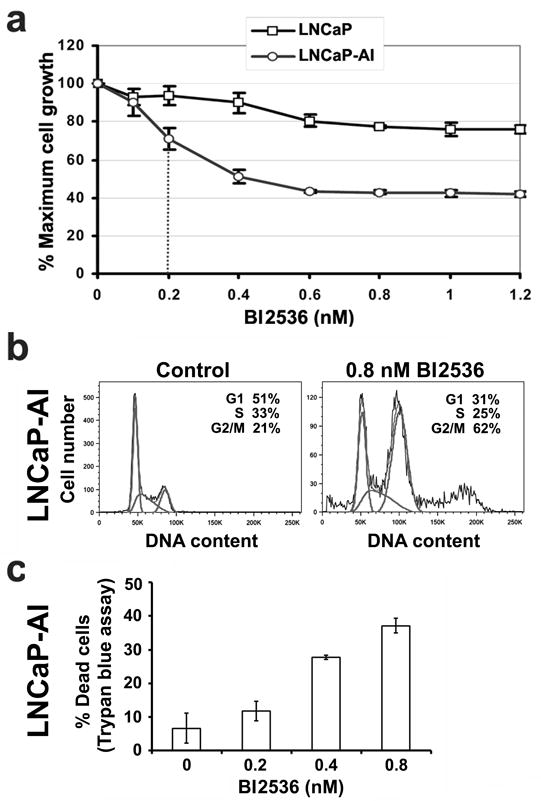
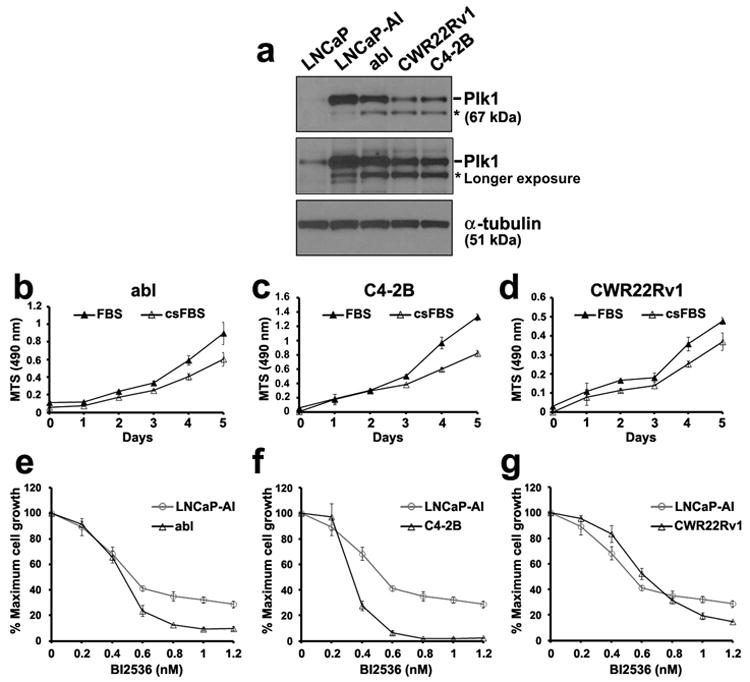
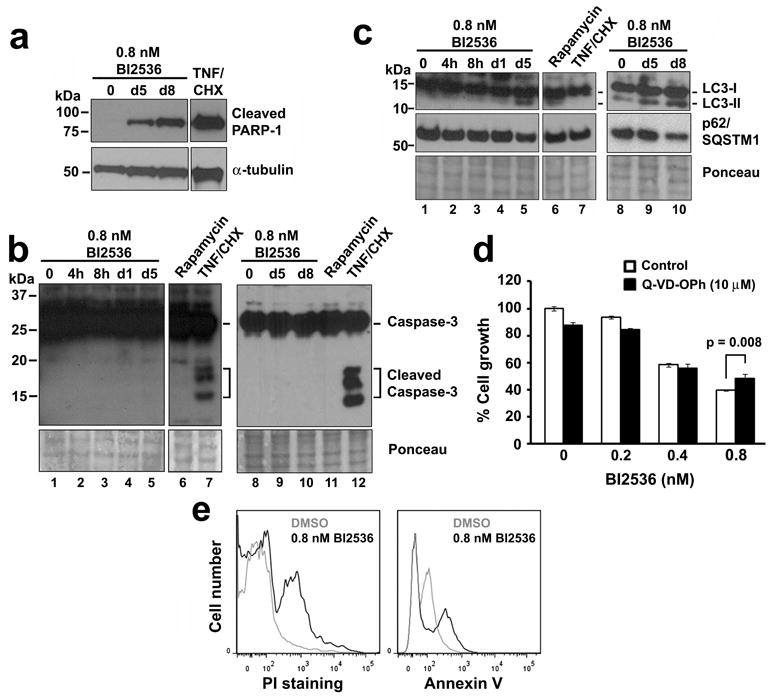
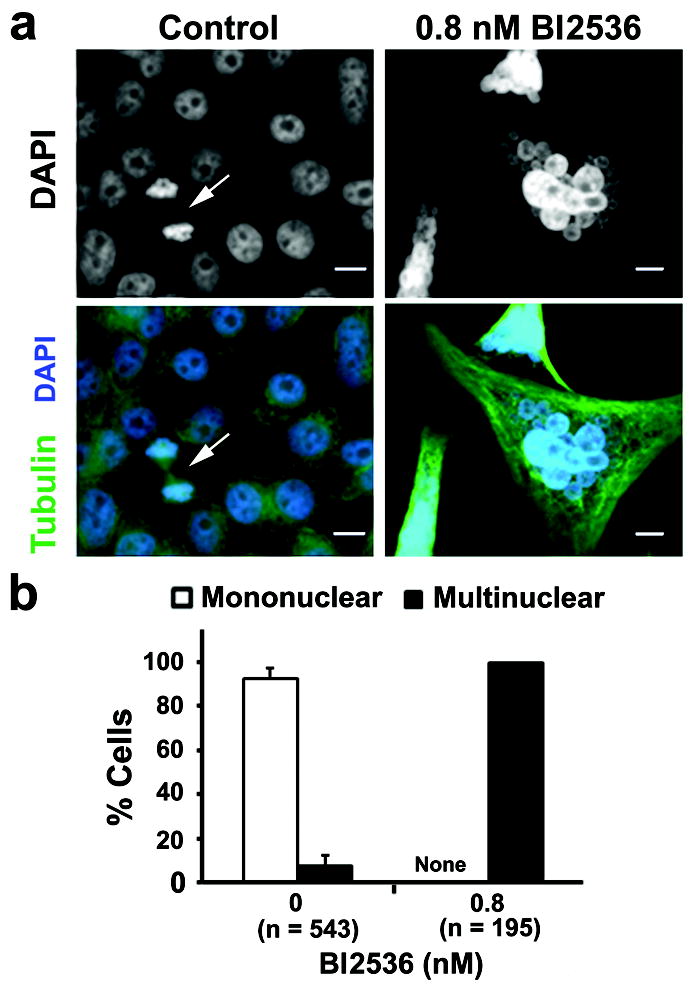
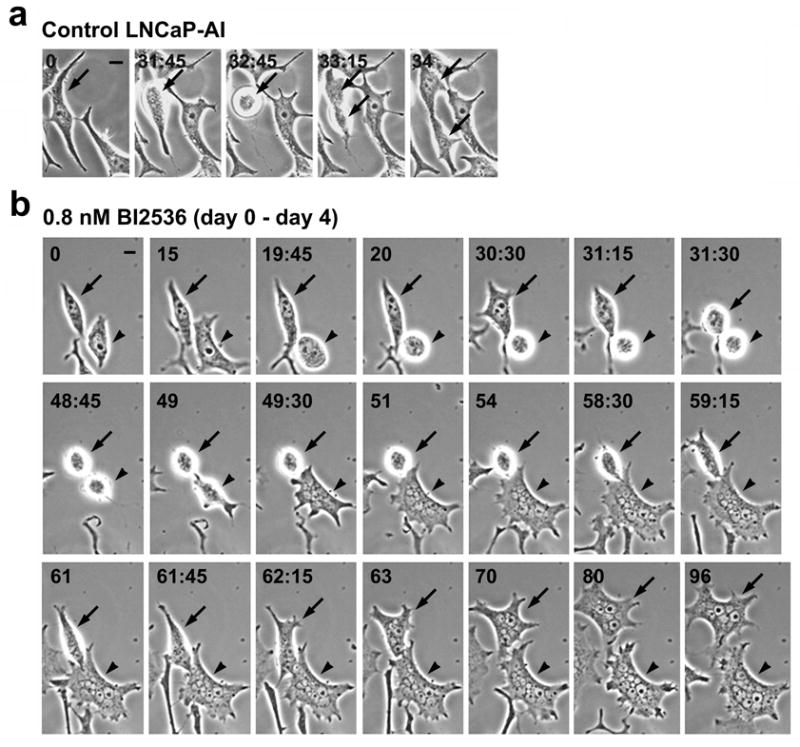
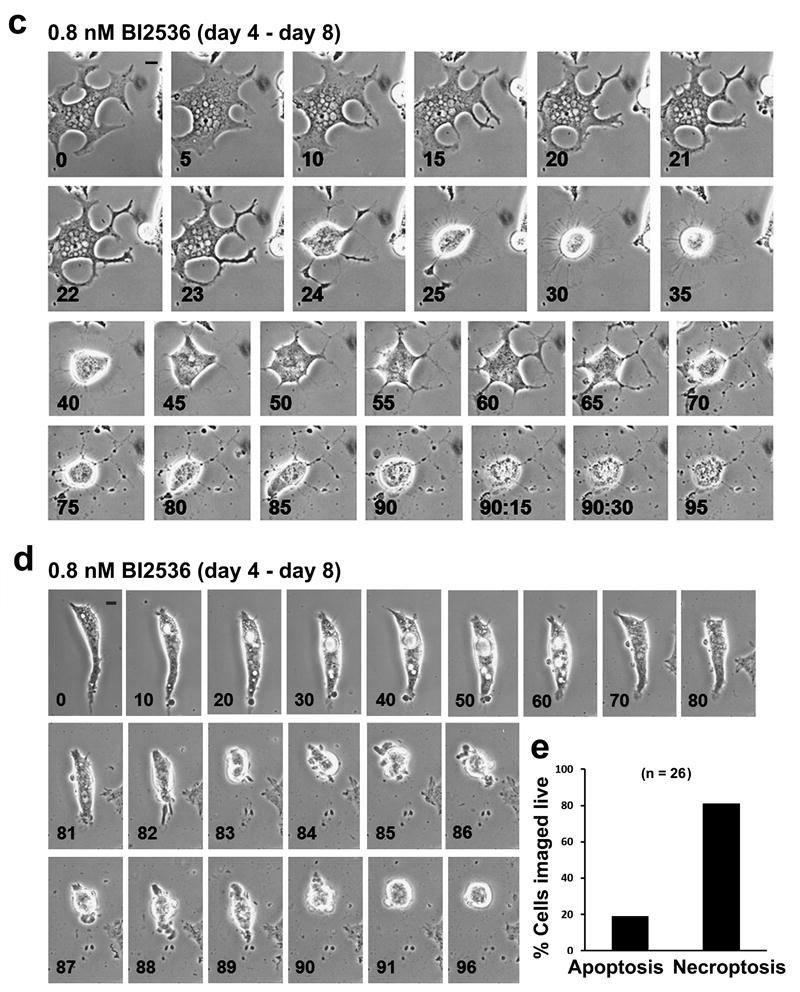
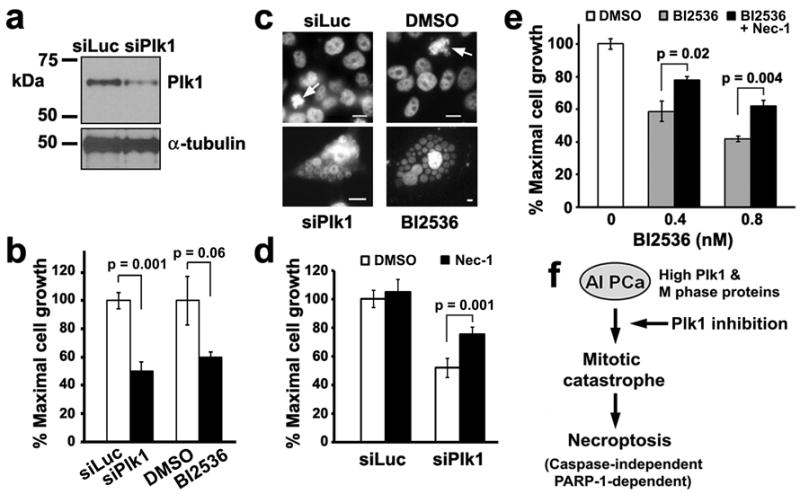
Castration-resistant prostate cancer (PCa) is refractory to hormone therapy and new strategies for treatment are urgently needed. We found that androgen-insensitive (AI) PCa cells, LNCaP-AI, are reprogrammed to upregulate the mitotic kinase Plk1 (Polo-like kinase 1) and other M-phase cell-cycle proteins, which may underlie AI PCa growth. In androgen-depleted media, LNCaP-AI cells showed exquisite sensitivity to growth inhibition by subnanomolar concentrations of a small molecule inhibitor of Plk1, BI2536, suggesting that these cells are dependent on Plk1 for growth. In contrast, the androgen-responsive parental LNCaP cells showed negligible responses to BI2536 treatment under the same condition. BI2536 treatment of LNCaP-AI cells resulted in an increase in cell death marker PARP-1 (polymerase-1) but did not activate caspase-3, an apoptosis marker, suggesting that the observed cell death was caspase-independent. BI2536-treated LNCaP-AI cells formed multinucleated giant cells that contain clusters of nuclear vesicles indicative of mitotic catastrophe. Live-cell time-lapse imaging revealed that BI2536-treated giant LNCaP-AI cells underwent necroptosis, as evidenced by 'explosive' cell death and partial reversal of cell death by a necroptosis inhibitor. Our studies suggest that LNCaP-AI cells underwent reprogramming in both their cell growth and cell death pathways, rendering them highly sensitive to Plk1 inhibition that induces necroptosis. Harnessing necroptosis through Plk1 inhibition may be explored for therapeutic intervention of castration-resistant PCa.


Conflict of interest statement

Conflict of interest

The authors declare no conflict of interest.

Figures

Figure 1
Figure 1
The mitotic kinase Plk1 is overexpressed in LNCaP-AI cells. (a) LNCaP and LNCaP-AI PCa cells were cultured in full media (FBS) or androgen-depleted media (csFBS). Cell growth over 7 days was determined by an MTS (OD 490 nm) growth assay. Results from triplicate samples (mean ± SD) in a representative experiment from n = 3 independent experiments are shown. (b) Lysates (20 μg) from LNCaP and LNCaP-AI cells grown in full media were immunoblotted for the androgen receptor (AR) and mitotic proteins as shown. α-tubulin was used as a loading control. (c) Relative Plk1 protein levels were determined (Plk1/tubulin and normalized against the value in LNCaP cells) (mean ± SD, n = 3 experiments).
Figure 2
Figure 2
Plk1 is elevated and active in LNCaP-AI cells. Cells were cultured in either full media (FBS) or androgen-depleted media (csFBS). (a) FACS analysis of randomly growing cells and cells synchronized by nocodazole treatment to enrich for G2/M phase population. (b) FACS analysis of cells costained with Plk1 and a mitotic marker, phospho-histone H3 (pH3), in randomly cycling cells and in cells synchronized by a nocodazole treatment. pH3(-) represent non-mitotic cells; pH3(+) represent mitotic cells. (c) Lysates (20 μg) from cells enriched in G2/M by nocodazole treatment were analyzed by immunoblotting with antibodies shown. After scanning the blots (NIH ImageJ), protein levels were measured (protein/tubulin and normalized against the value in LNCaP cells). Similar data were obtained in n = 3 experiments.
Figure 3
Figure 3
Differential response of LNCaP-AI cells to the Plk1 inhibitor BI2536. (a) Cells were cultured in androgen-depleted media and treated with increasing concentrations of BI2536 for 5 days. % Maximal growth relative to non-treated control cells (set at 100%) were analyzed in triplicates (mean ± SD) by MTS assays. Dotted line, IC50 of 0.2 nM BI2536 for LNCaP-AI cells. (b) FACS analysis of LNCaP-AI cells treated with or without 0.8 nM BI2536 for 5 days. (c) % Trypan-blue positive dead LNCaP-AI cells in (a) were counted in triplicates (mean ± SD). Similar data were obtained in n = 3 experiments.
Figure 4
Figure 4
Growth inhibition of additional androgen-insensitive prostate cancer cells to the Plk1 inhibitor BI2536. (a) Lysates (20 μg) were analyzed for Plk1 levels by western blot analysis. α-tubulin was used as a loading control. *, nonspecific band. (b - d) abl, C4-2B and CWR22Rv1 cells were culture in full (FBS) or androgen-depleted (csFBS) media. Cell growth over 5 days was determined by an MTS assay. (e - g) Cells were cultured in androgen-depleted media and treated with increasing concentrations of BI2536 for 5 days. % Maximal growth relative to non-treated control cells (set at 100%) were analyzed in triplicates (mean ± SD) by MTS assays. Data in (b – g) are representative of n = 3 experiments.
Figure 5
Figure 5
Effect of BI2536 treatment on apoptosis or autophagy pathways in LNCaP-AI cells. Cells were cultured in androgen-depleted media and treated for 5 or 8 days with 0.8 nM BI2536, 16 h with 10 ng/ml TNFα plus 10 μg/ml cycloheximide, or 24 h with 20 nM rapamycin. Cell lysates were immunoblotted for markers of (a) cell death (PARP-1); (b) apoptosis (cleaved caspase-3); and (c) autophagy (LC3-I/II and p62/sequestosome [SQSTM1]). α-tubulin or Ponceau S staining was used as a loading control. (d) % Cell growth by MTS assays of LNCaP-AI cells treated with increasing concentrations of BI2536 plus 10 μM Q-VD-OPh for 5 days. Triplicate samples were analyzed (mean ± SD). (e) FACS analysis of LNCaP-AI cells treated with or without 0.8 nM BI2536 for 5 days and stained for Annexin-V and counterstained with propidium iodide. Similar results for panels (a – d) and (e) were obtained in n = 3 and 2 experiments, respectively.
Figure 6
Figure 6
Plk1 inhibition by BI2536 resulted in distinct changes in nuclear morphology and an increase in aneuploidy in LNCaP-AI cells. (a) Cells were treated with 0.8 nM BI2536 for 5 days in androgen-depleted media, immunostained for α-tubulin (green) and counterstained with DAPI (blue) for DNA. Arrow, cells in telophase. Bars, 10 μm. (b) Nuclear morphologies for cells in A were quantified as mononuclear (normal) or multinuclear (with nuclear vesicles) (mean ± SD, n = 3 experiments). N, cell number. None, no mononuclear cells were detected.
Figure 7
Figure 7
Live-cell imaging of LNCaP-AI cells in response to BI2536 treatment. Cells cultured in androgen-depleted media were treated with 0.8 nM BI2536 for 8 days. Live-cell time-lapse images were taken at 15 min intervals. (a) Control LNCaP-AI cell undergoing the first cell division (arrows). See Supplementary Figure 2 for the 96 h time course. (b) LNCaP-AI cells during days 0 – 4 of BI2536 treatment. Two cells (arrow and arrowheads) underwent cell rounding, mitotic catastrophe and turned into multinucleated giant cells. n = 83 cells were live-imaged. (c) LNCaP-AI cells during days 4 – 8 of BI2536 treatment. After a change of media on day 4, a parallel batch of cells were imaged from day 4 (T=0h) to day 8 (T=96h) of BI2536 treatment. Giant LNCaP-AI cells underwent necroptosis during this period. See Supplementary Figure 3 for additional images of the necroptotic cell death process. (d) LNCaP-AI cell undergoing apoptosis from days 4 – 8 of BI2536 treatment. All bars, 10 μm. (e) Quantification of cell death modalities in n = 26 live-imaged LNCaP-AI cells after 8 days of BI2536 treatment.
Figure 7
Figure 7
Live-cell imaging of LNCaP-AI cells in response to BI2536 treatment. Cells cultured in androgen-depleted media were treated with 0.8 nM BI2536 for 8 days. Live-cell time-lapse images were taken at 15 min intervals. (a) Control LNCaP-AI cell undergoing the first cell division (arrows). See Supplementary Figure 2 for the 96 h time course. (b) LNCaP-AI cells during days 0 – 4 of BI2536 treatment. Two cells (arrow and arrowheads) underwent cell rounding, mitotic catastrophe and turned into multinucleated giant cells. n = 83 cells were live-imaged. (c) LNCaP-AI cells during days 4 – 8 of BI2536 treatment. After a change of media on day 4, a parallel batch of cells were imaged from day 4 (T=0h) to day 8 (T=96h) of BI2536 treatment. Giant LNCaP-AI cells underwent necroptosis during this period. See Supplementary Figure 3 for additional images of the necroptotic cell death process. (d) LNCaP-AI cell undergoing apoptosis from days 4 – 8 of BI2536 treatment. All bars, 10 μm. (e) Quantification of cell death modalities in n = 26 live-imaged LNCaP-AI cells after 8 days of BI2536 treatment.
Figure 8
Figure 8
Necrostatin-1 attenuates cell death by necroptosis resulting from either Plk1 depletion or Plk1 inhibition in LNCaP-AI cells. (a) LNCaP-AI cells were transfected with either siLuciferase or Plk1 RNAi oligos for 5 days. Cell lysates (20 μg) were analyzed for Plk1 levels. α-tubulin was used as a loading control. (b) Cells prepared as in (a) or treated with 0.8 nM BI2536 were analyzed after 5 days by an MTS assay. Triplicate samples (mean ± SD) from one of n = 2 experiments are shown. (c) Cells were treated as in (b) and counterstained with DAPI to visualize DNA, shown here in black and white for contrast. Arrows, cells in mitosis in control cultures. Single giant cells containing clusters of nuclear vesicles are shown for siPlk1 and BI2536-treated LNCaP-AI cells. Bars, 10 μm. Note differences in scale. (d) Cells were transfected with siPlk1 for 5 days. 7.7 μM Necrostatin-1 (Nec-1), the necroptosis inhibitor, was added 3 h prior to siPlk1 transfection and remained throughout the experiment. Triplicate samples (mean ± SD) from MTS assays from one of n = 2 experiments are shown. (e) Cells were treated with 0.4 or 0.8 nM BI2536 for 5 days. 5 μM Nec-1 was added 3 h prior to BI2536 addition and remained throughout the experiment. Triplicate samples (mean ± SD) from MTS assays from one of n = 3 experiments are shown. (f) Working model of necroptosis induction by Plk1 inhibition in androgen-insensitive PCa cells. See text.

References

    1. Jemal A, Siegel R, Ward E, Murray T, Xu J, Thun MJ. Cancer statistics 2007. CA Cancer J Clin. 2007;57:43–66. - PubMed
    1. Wang Q, Li W, Zhang Y, Yuan X, Xu K, Yu J, et al. Androgen receptor regulates a distinct transcription program in androgen-independent prostate cancer. Cell. 2009;138:245–256. - PMC - PubMed
    1. Barr FA, Sillje HH, Nigg EA. Polo-like kinases and the orchestration of cell division. Nat Rev Mol Cell Biol. 2004;5:429–440. - PubMed
    1. Takaki T, Trenz K, Costanzo V, Petronczki M. Polo-like kinase 1 reaches beyond mitosis - cytokinesis, DNA damage response, and development. Curr Op Cell Biol. 2008;20:650–660. - PubMed
    1. Wang LG, Ossowski L, Ferrari AC. Androgen receptor level controlled by a suppressor complex lost in an androgen-independent prostate cancer cell line. Oncogene. 2004;23:5175–5184. - PubMed

Publication types

MeSH terms