Calcium spike variability in cardiac myocytes results from activation of small cohorts of ryanodine receptor 2 channels
- PMID: 22890710
- PMCID: PMC3497565
- DOI: 10.1113/jphysiol.2012.234823
Calcium spike variability in cardiac myocytes results from activation of small cohorts of ryanodine receptor 2 channels
Abstract
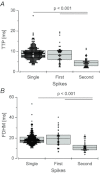
In mammalian cardiac myocytes, the elementary calcium releases triggered by step voltage stimuli manifest either as solitary or as twin spikes that vary widely in kinetics and amplitude for unknown reasons. Here we examined the variability of calcium spikes measured using line-scanning confocal microscopy in patch-clamped rat ventricular myocytes. Amplitude distributions of the single and of the first of twin spikes were broader than those of the second spikes. All could be best approximated by a sum of a few elementary Gaussian probability distribution functions. The latency distributions of the single and the first spikes were identical, much shorter and less variable than those of the second spikes. The multimodal distribution of spike amplitudes and the probability of occurrence of twin spikes were stochastically congruent with activation of only a few of the many RyR2 channels present in the release site cluster. The occurrence of twin release events was rare due to refractoriness of release, induced with a probability proportional to the number of RyR2s activated in the primary release event. We conclude that the variability of the elementary calcium release events supports a calcium signalling mechanism that arises from stochastics of RyR2 gating and from inactivation of local origin.
Figures


Similar articles
-
Kinetics of calcium spikes in rat cardiac myocytes.J Physiol. 2007 Feb 1;578(Pt 3):677-91. doi: 10.1113/jphysiol.2006.117796. Epub 2006 Nov 23. J Physiol. 2007. PMID: 17124272 Free PMC article.
-
Local calcium release activation by DHPR calcium channel openings in rat cardiac myocytes.J Physiol. 2008 Aug 15;586(16):3839-54. doi: 10.1113/jphysiol.2007.149989. Epub 2008 Jun 26. J Physiol. 2008. PMID: 18591191 Free PMC article.
-
Triadin overexpression stimulates excitation-contraction coupling and increases predisposition to cellular arrhythmia in cardiac myocytes.Circ Res. 2005 Apr 1;96(6):651-8. doi: 10.1161/01.RES.0000160609.98948.25. Epub 2005 Feb 24. Circ Res. 2005. PMID: 15731460
-
[Microscopic mechanism of excitation-contraction coupling in cardiac myocytes].Sheng Li Ke Xue Jin Zhan. 2004 Oct;35(4):294-8. Sheng Li Ke Xue Jin Zhan. 2004. PMID: 15727204 Review. Chinese.
-
Imaging microdomain Ca2+ in muscle cells.Circ Res. 2004 Apr 30;94(8):1011-22. doi: 10.1161/01.RES.0000125883.68447.A1. Circ Res. 2004. PMID: 15117829 Review.
Cited by
-
Quantitative analysis of calcium spikes in noisy fluorescent background.PLoS One. 2013 May 31;8(5):e64394. doi: 10.1371/journal.pone.0064394. Print 2013. PLoS One. 2013. PMID: 23741324 Free PMC article.
-
Ryanodine receptor gating controls generation of diastolic calcium waves in cardiac myocytes.J Gen Physiol. 2015 Jun;145(6):489-511. doi: 10.1085/jgp.201411281. J Gen Physiol. 2015. PMID: 26009544 Free PMC article.
-
Magnesium Ions Moderate Calcium-Induced Calcium Release in Cardiac Calcium Release Sites by Binding to Ryanodine Receptor Activation and Inhibition Sites.Front Physiol. 2022 Jan 25;12:805956. doi: 10.3389/fphys.2021.805956. eCollection 2021. Front Physiol. 2022. PMID: 35145426 Free PMC article.
-
Stochastic and deterministic approaches to modelling calcium release in cardiac myocytes at different spatial arrangements of ryanodine receptors.Eur Biophys J. 2019 Sep;48(6):579-584. doi: 10.1007/s00249-019-01378-z. Epub 2019 Jun 24. Eur Biophys J. 2019. PMID: 31236612
-
Calcium Signaling and Contractility in Cardiac Myocyte of Wolframin Deficient Rats.Front Physiol. 2019 Mar 13;10:172. doi: 10.3389/fphys.2019.00172. eCollection 2019. Front Physiol. 2019. PMID: 30930784 Free PMC article.
References
-
- Bers DM. Cardiac excitation-contraction coupling. Nature. 2002;415:198–205. - PubMed
-
- Burnham KP, Anderson DR. Model Selection and Multi-Model Inference. New York: Springer; 2002.
Publication types
MeSH terms
Substances
LinkOut - more resources
Full Text Sources

