. 2012 Dec 1;590(23):5975-92.
doi: 10.1113/jphysiol.2012.228619. Epub 2012 Aug 13.

A new conceptual paradigm for the haemodynamics of salt-sensitive hypertension: a mathematical modelling approach

Affiliations

A new conceptual paradigm for the haemodynamics of salt-sensitive hypertension: a mathematical modelling approach

Viktoria A Averina et al. J Physiol. .

Abstract

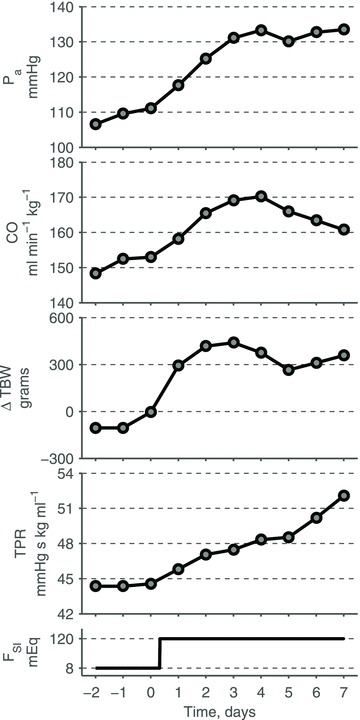
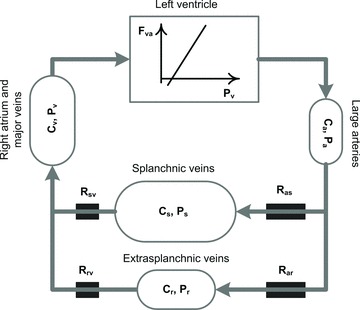
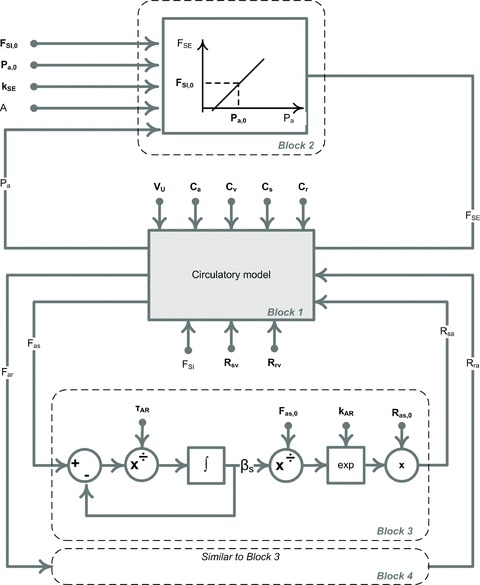
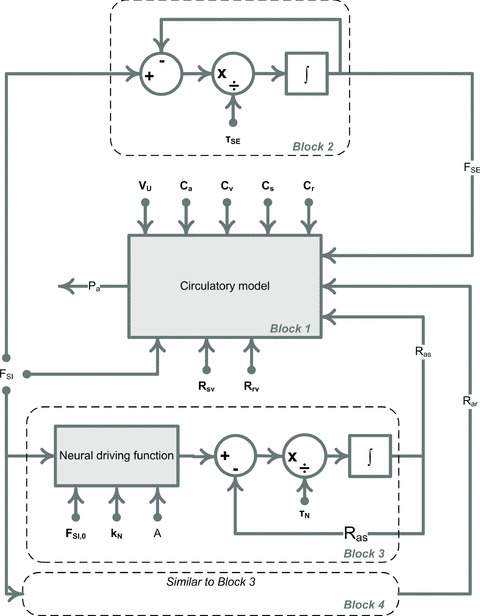
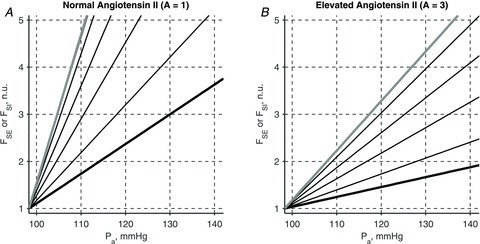
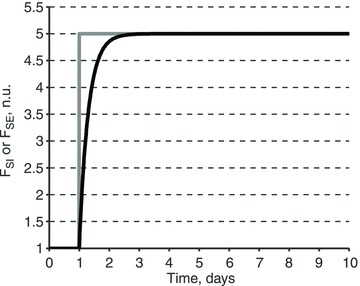
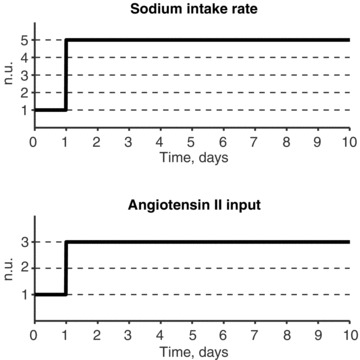
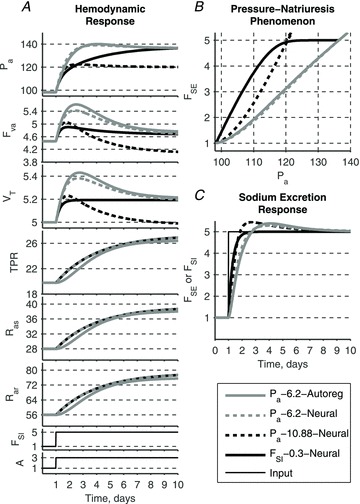
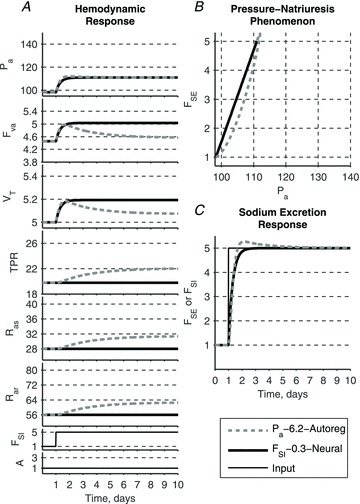
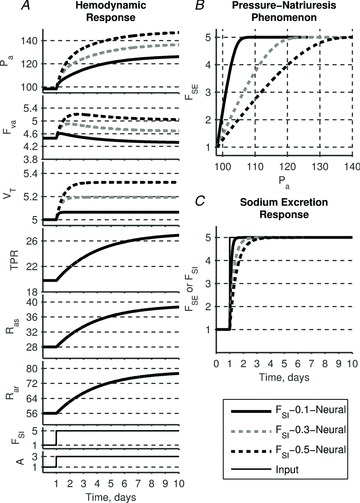
A conceptually novel mathematical model of neurogenic angiotensin II-salt hypertension is developed and analysed. The model consists of a lumped parameter circulatory model with two parallel vascular beds; two distinct control mechanisms for both natriuresis and arterial resistances can be implemented, resulting in four versions of the model. In contrast with the classical Guyton-Coleman model (GC model) of hypertension, in the standard version of our new model natriuresis is assumed to be independent of arterial pressure and instead driven solely by sodium intake; arterial resistances are driven by increased sympathetic nervous system activity in response to the elevated plasma angiotensin II and increased salt intake (AngII-salt). We compare the standard version of our new model against a simplified Guyton-Coleman model in which natriuresis is a function of arterial pressure via the pressure-natriuresis mechanism, and arterial resistances are controlled via the whole-body autoregulation mechanism. We show that the simplified GC model and the new model correctly predict haemodynamic and renal excretory responses to induced changes in angiotensin II and sodium inputs. Importantly, the new model reproduces the pressure-natriuresis relationship--the correlation between arterial pressure and sodium excretion--despite the assumption of pressure-independent natriuresis. These results show that our model provides a conceptually new alternative to Guyton's theory without contradicting observed haemodynamic changes or pressure-natriuresis relationships. Furthermore, the new model supports the view that hypertension need not necessarily have a renal aetiology and that long-term arterial pressure could be determined by sympathetic nervous system activity without involving the renal sympathetic nerves.


Figures

Figure 1
Figure 1. Experimental haemodynamic profile of AngII–salt hypertension in dogs (redrawn from Krieger et al. (1989)) similar to the volume-loading profile of hypertension
Average 24 h mean arterial pressure (Pa), cardiac output (CO), change in total body weights (TBW), and total peripheral resistance (TPR) in response to an increase in salt intake (FSI) on Day 0, while infusion of AngII is maintained at a subpressor dose (∼2.6 ng kg−1 min−1) throughout the entire experiment. Redrawn from Krieger et al. (1989) with permission from the American Physiological Society.
Figure 2
Figure 2. Representation of the circulatory subsystem
Total blood volume is distributed among four systemic vascular reservoirs: large arteries, splanchnic veins, extrasplachnic veins and right atrium. The pulmonary circulation is omitted. Blood is circulated via a cardiac pump modelled as a linear Frank–Starling relationship between filling pressure and cardiac output. P, pressures; R, hydraulic resistances; C, compliances; Fva, cardiac output; a, arterial; v, venous; s, splanchnic; r, extrasplanchnic.
Figure 3
Figure 3. Regulation of total blood volume (VT) via sodium excretion (FSE)
Block diagram representation of the total blood volume regulation (see eqn (1)).
Figure 4
Figure 4. Model ‘PakSE–Autoreg’, the representation of a simplified GC model
The block diagram representation of the mathematical model ‘PakSE–Autoreg’ given by eqns (1), (2), (3) and (5). The circulatory subsystem (Block 1, see Fig. 2 and 3 for details) is paired with the two regulation mechanisms: sodium excretion is controlled by the arterial pressure via the renal function curve (Block 2) and arterial resistances are controlled via the long-term autoregulation mechanism (Block 3 and Block 4). Block 4 is similar to Block 3 and thus is not shown in detail. Parameters are shown in bold.
Figure 5
Figure 5. Model ‘FSI–τSE–Neural’, a new mathematical model with non-renocentric pathway of hypertension
The block diagram representation of the mathematical model ‘FSI–τSE–Neural’ given by equations (1), (4) and (6). The circulatory subsystem (Block 1, see Fig. 2 and Fig. 3 for details) is paired with the two regulation mechanisms: sodium excretion is controlled by the sodium intake (Block 2) and arterial resistances are controlled via the long-term neural drive (Block 3 and Block 4). Block 4 is similar to Block 3 and thus is not shown in detail. The neural driving function is the right hand side of eqn (4), where j = ‘s’ and ‘r’ for Block 3 and 4, respectively. Parameters are shown in bold.
Figure 6
Figure 6. Rotation of pressure–natriuresis curves due to the elevated sodium intake and AngII level
Evolution of an acute renal function curve with kSE = 6.2 (thick black line, A and B) into a chronic renal function curve (thick grey line, A and B) due to a 5-fold increase in sodium intake rate is shown in the presence of normal (A) and elevated (B) levels of circulating AngII. Thin black lines show successive changes in the acute renal curves 1, 6, 12, and 24 h post a step-wise increase in sodium intake. The chronic renal function curve has a nearly vertical slope for normal level of AngII (thick grey line, A). Thus 5-fold increase in sodium intake leads to only about 10 mmHg elevation in mean arterial pressure. If the circulating levels of AngII are elevated 3-fold, the chronic renal function curve has a smaller slope which reflects higher level of renal abnormality (thick grey line, B). A 5-fold increase in sodium intake then leads to over 30 mmHg elevation in mean arterial pressure. Sodium excretion rate is shown as a fraction of the normal sodium intake rate, FSI,0.
Figure 7
Figure 7. Sodium excretion rate response to a step increase in sodium intake rate
Sodium excretion rate (FSE, black) response to a 5-fold step increase in sodium intake rate (FSI, grey). The response is modelled as a first-order response with the time constant τSE = 0.3 days (see eqn (6)). Sodium rates are shown as a fraction of the normal sodium intake rate, FSI,0.
Figure 8
Figure 8. Inputs to simulations
Sodium intake rate is normal on Day 0 and then increased 5-fold on Day 1, AngII input is given on Day 1 at a 3-fold normal endogenous level. Both inputs are maintained at their elevated levels throughout the protocol (Day 1 to Day 10). In some simulations only sodium intake rate is increased.
Figure 9
Figure 9. Effect of different regulation mechanisms on the system's response to the elevated sodium intake and AngII input
All models produce a similar haemodynamic profile and pressure–natriuresis phenomenon whether renal function and long-term autoregulation mechanisms are included or not. Neurally driven resistance responses in three of the four models (TPR, Ras and Rar; all but continuous grey curves) overlap.
Figure 10
Figure 10. Effects of sodium loading alone
Sodium loading alone leads to a small elevation of arterial pressure in both models. While this elevation is associated with the accumulation of total blood volume, its value is determined differently. In GC model (‘Pa–6.2–Autoreg’) arterial pressure for the new level of sodium intake is determined solely by the renal function curve, while total blood volume expansion is modified via autoregulation mechanism. In the model ‘FSI–0.3–Neural’ elevation of blood pressure is driven by the volume expansion alone.
Figure 11
Figure 11. Effect of varying time constant τSE of the sodium intake–natriuresis mechanism on the system's response to the elevated sodium intake and AngII input
Neurally driven resistance responses are independent of renal control and thus TPR, Ras and Rar remain same for any τSE and contribute equally to the rise in arterial pressure. Larger time constants lead to a delay in sodium excretion response and thus additional accumulation of blood volume. Volume expansion leads to an additional elevation in arterial pressure. The slope of the pressure–natriuresis relationship diminishes with increasing τSE which is consistent with experimental observations of volume-loading hypertension.

Comment in

References

    1. Bie P. Blood volume, blood pressure and total body sodium: internal signalling and output control. Exp Physiol. 2009;195:187–196. - PubMed
    1. Caldini P, Permutt S, Waddell JA, Riley RL. Effect of epinephrine on pressure, flow, and volume relationships in the systemic circulation of dogs. Circ Res. 1974;34:606–623. - PubMed
    1. Coleman TG, Granger HJ, Guyton AC. Whole-body circulatory autoregulation and hypertension. Circ Res. 1971;28(Suppl 2):76–87. - PubMed
    1. Dorrington KL, Pandit JJ. The obligatory role of the kidney in long-term arterial blood pressure control: extending Guyton's model of the circulation. Anaesthesia. 2009;64:1218–1228. - PubMed
    1. Fine DM, Ariza-Nieto P, Osborn JW. Does whole body autoregulation mediate the hemodynamic responses to increased dietary salt in rats with clamped angiotensin II. Am J Physiol Heart Circ Physiol. 2003;285:H2670–2678. - PubMed

Publication types