. 2012 Oct;32(20):4141-54.
doi: 10.1128/MCB.00293-12. Epub 2012 Aug 13.

Disruption of the selenocysteine lyase-mediated selenium recycling pathway leads to metabolic syndrome in mice

Affiliations

Disruption of the selenocysteine lyase-mediated selenium recycling pathway leads to metabolic syndrome in mice

Lucia A Seale et al. Mol Cell Biol. 2012 Oct.

Abstract

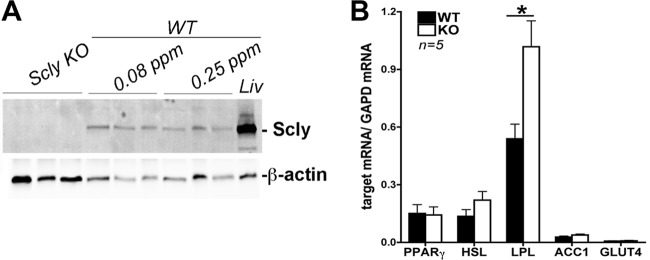
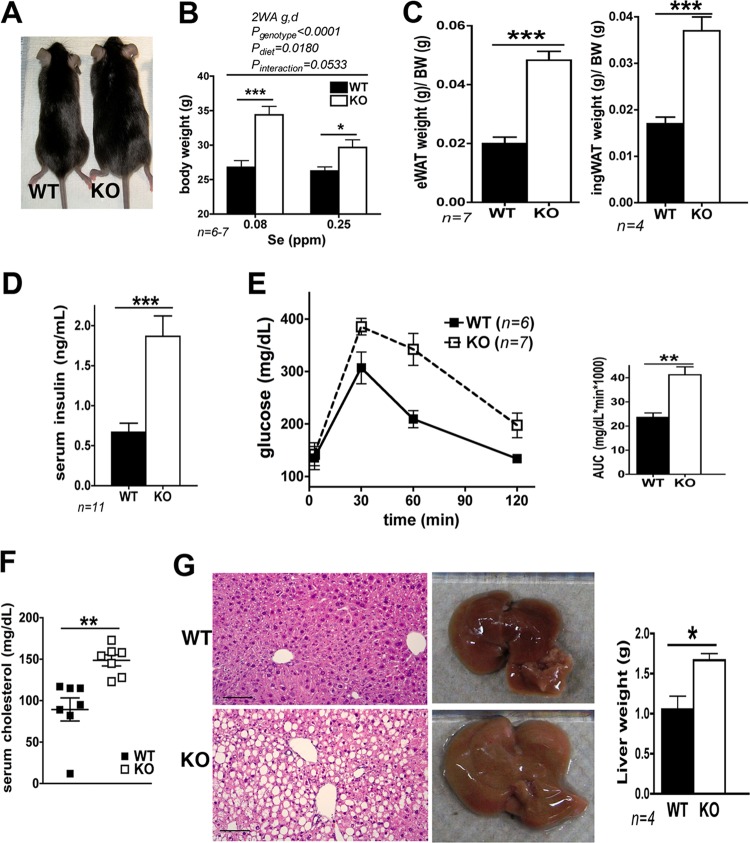
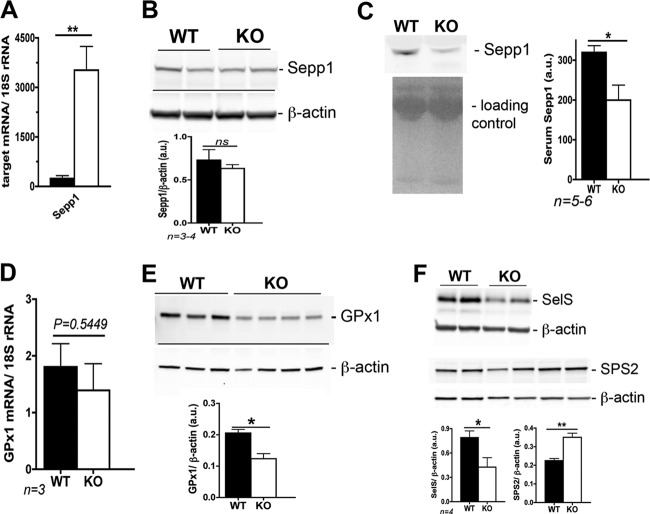
Selenium (Se) is an essential trace element used for biosynthesis of selenoproteins and is acquired either through diet or cellular recycling mechanisms. Selenocysteine lyase (Scly) is the enzyme that supplies Se for selenoprotein biosynthesis via decomposition of the amino acid selenocysteine (Sec). Knockout (KO) of Scly in a mouse affected hepatic glucose and lipid homeostasis. Mice lacking Scly and raised on an Se-adequate diet exhibit hyperinsulinemia, hyperleptinemia, glucose intolerance, and hepatic steatosis, with increased hepatic oxidative stress, but maintain selenoprotein levels and circulating Se status. Insulin challenge of Scly KO mice results in attenuated Akt phosphorylation but does not decrease phosphorylation levels of AMP kinase alpha (AMPKα). Upon dietary Se restriction, Scly KO animals develop several characteristics of metabolic syndrome, such as obesity, fatty liver, and hypercholesterolemia, with aggravated hyperleptinemia, hyperinsulinemia, and glucose intolerance. Hepatic glutathione peroxidase 1 (GPx1) and selenoprotein S (SelS) production and circulating selenoprotein P (Sepp1) levels are significantly diminished. Scly disruption increases the levels of insulin-signaling inhibitor PTP1B. Our results suggest a dependence of glucose and lipid homeostasis on Scly activity. These findings connect Se and energy metabolism and demonstrate for the first time a unique physiological role of Scly in an animal model.


Figures

Fig 1
Fig 1
Male Scly KO mice increase fat accumulation in the WAT and liver and are glucose intolerant and hyperinsulinemic. (A) Scly KO mouse weight of the epididymal (eWAT) and inguinal (ingWAT) fat depots. (B) Glucose tolerance test (GTT). The AUC was calculated for each mouse, averaged, and plotted as a bar graph. (C) Histological sections of the liver stained with H&E. (D) Hepatic triglyceride levels. (E) Serum insulin levels as measured by ELISA. (F) Immunohistochemistry of pancreatic β cells stained with anti-insulin. (G) Insulin-degrading enzyme (IDE) activity. (H) Hepatic levels of IDE visualized by Western blotting. Loading control, TATA-binding protein (TBP). *, P < 0.05; **, P < 0.01; ***, P < 0.001 (by a two-tailed unpaired t test). ns, not significant. Sample size is displayed in graphs. Scale bars, 100 μm (C) and 50 μm (F). Images in these panels represent typical histology from three to four animals/group.
Fig 2
Fig 2
Hepatic expression of genes that regulate energy metabolism and effects on protein levels of Scly KO mice fed an adequate-Se diet (0.25 to 0.3 ppm). (A) qPCR analysis of nuclear receptors and coactivators PPARα, PPARγ, LXRα, and PGC1α, as well as lipogenic enzyme ACC1 and glucose transporter GLUT2. (B) PPARγ protein levels. (C) Se regulation of hepatic Akt phosphorylation in WT mice. (D) Phosphorylation levels of pAkt Ser473, pAkt Thr308, and total Akt after insulin challenge. (E) Protein levels of pAMPKα Thr172 and total AMPKα. (F) Protein levels of pACC1 Ser79 and ACC1. All protein graphs are expressed in arbitrary units (au) and normalized by levels of β-actin or TBP. Protein blots in panels D and E are representative of four animals. ns, not significant. *, P < 0.05; **, P < 0.01; ***, P < 0.001 (by two-tailed unpaired t test, except in panel C, where one-way analysis of variance [1WA] was employed).
Fig 3
Fig 3
Epididymal WAT expresses Scly but does not change the expression levels of metabolic genes. (A) Scly levels are not regulated by Se concentration in the eWAT of WT mice. The amount of Se in the diet is indicated (ppm); 40 μg of eWAT total protein was loaded in the gel, while only 10 μg of liver (Liv) total protein was used. (B) mRNA expression levels of metabolic genes PPARγ, hormone-sensitive lipase (HSL), ACC1, and GLUT4 are maintained, while lipoprotein lipase (LPL) expression is increased in the eWAT of Scly KO mice. *, P < 0.05 (two-tailed unpaired Student's t test).
Fig 4
Fig 4
Se levels in the Scly KO mice fed an Se-adequate diet. (A) Western blot of serum GPx3 protein and its relative quantification. (B) Plasma GPx activity assay. (C) Sepp1 levels in the serum measured by Western blotting. Ponceau S staining of blots was used to verify even loading (bottom). (D) Liver Se content measured by ICP-MS. Each square represents one individual animal. The P value was calculated by a two-tailed unpaired t test. ns, not significant.
Fig 5
Fig 5
Selenoprotein profile in the liver of Scly KO mice fed an adequate Se diet. (A) Expression of selenoproteins SelS, SelK, TrxR1, SelW, GPx1, and SPS2 in Scly KO mice measured by Western blotting and normalized to the β-actin or α-tubulin level, depending on the blot. (B) Total GPx activity in the liver of Scly KO mice. (C) ELISA results for HNE adduct formation as an indicator of lipid peroxidation and oxidative stress levels. Sample size is displayed in the graphs. *, P < 0.05; **, P < 0.01(two-tailed unpaired t test). au, arbitrary units.
Fig 6
Fig 6
Scly KO mice fed a diet containing 0.08-ppm of Se for 2.5 months develop obesity, hepatic steatosis, and hypercholesterolemia and worsen their hyperinsulinemia and glucose intolerance. (A) Photograph of age-matched KO mice and WT counterparts. (B) Body weight measurements of Scly KO and WT mice upon sacrifice. 2WA g,d, two-way analysis of variance of genotype and diet. (C) Epididymal (eWAT) and inguinal (ingWAT) fat depot weights. (D) Fasting serum insulin levels. (E) Glucose tolerance test. (F) Fasting serum cholesterol levels. (G) Liver histology following H&E staining of hepatocytes under optical microscopy left) and representative photograph of the liver showing its size (right). Liver weight is displayed as a bar graph. Scale bar, 100 μm. The image is representative of three mice. Sample size is displayed in graphs. *, P < 0.05; **, P < 0.01; ***, P < 0.001 (two-tailed unpaired t test).
Fig 7
Fig 7
Leptin in Scly KO mice. (A) Food consumption measured weekly in animals fed a low-Se diet. The AUC was calculated for individual mice, averaged, and plotted as graph bar (n = 10 animals, housed in four cages). (B) Serum leptin levels in WT and Scly KO mice after being fed on diets containing 0.08 and 0.25 ppm of Se. Pint, P for interaction by two-way analysis of variance. (C) Gene expression of leptin receptor signaling inhibitor SOCS-3 in the brain and in the liver. Sample size is displayed in graphs. RQ, relative quantification. *, P < 0.05; **, P < 0.01; ***, P < 0.001 (two-tailed unpaired t test).
Fig 8
Fig 8
Phosphorylation and protein levels of AMPKα, ACC1, and PTP1B in the liver of Scly KO mice fed a low-Se diet (0.08 ppm). (A) Phosphorylation and protein levels of AMPKα in Scly KO mice liver on different Se diets. Although AMPKα levels are increased, phosphorylation is, in fact, slightly decreased. (B) ACC1 mRNA levels are upregulated in Scly KO mice on a low-Se diet. (C) Phosphorylation of ACC1 is mildly increased in the liver of Scly KO mice without changes in ACC1 total levels. (D) PTP1B levels are increased in Scly KO mice on a diet containing 0.25 ppm of Se, and it further increases in a low-Se diet. Phosphorylation was measured in mice challenged with insulin. TBP and β-actin levels were used as loading controls for blots. Sample size is displayed in the graphs, and comparison was performed by two-way analysis of variance (A and D) and by a two-tailed unpaired t test (B and C). *, P < 0.05; **, P < 0.01; ns, not significant.
Fig 9
Fig 9
Expression of selenoproteins involved in glucose metabolism in Scly KO mice upon a low dietary Se intake (0.08 ppm). (A) Hepatic Sepp1 mRNA levels. (B) Sepp1 protein expression in the liver of Scly KO mice. (C) Serum levels of Sepp1 in Scly KO mice. (D) GPx1 mRNA levels. (E) GPx1 protein levels. (F) SelS and SPS2 protein levels. Protein quantification is shown close to the respective blot, and levels are expressed as arbitrary units (au). *, P < 0.05; **, P < 0.01 (two-tailed unpaired t test).
Fig 10
Fig 10
Schematic view of possible role of Scly in glucose and lipid metabolism in the liver. Scly decomposes Sec (yellow circles) obtained from selenoprotein degradation into alanine (ala) and the Se form selenide. This Se will reenter the selenoprotein synthesis pathway by the action of SPS enzymes. Selenoproteins are mostly involved in cell detoxification reactions, such as breakdown of hydrogen peroxide (H2O2). Oxidative status influences the activity of insulin signaling inhibitor protein PTP1B, a phosphatase that disrupts the insulin signaling cascade by dephosphorylating the insulin receptor (IR) and its substrate (IRS). This results in attenuation of downstream events regulated by Akt, such as gene transcription, glucose uptake, and lipogenesis. Se from Scly activity regulates PTP1B levels (dashed arrow), favoring the negative regulation of insulin signaling.

Similar articles

Cited by

References

    1. Bjorbaek C, El-Haschimi K, Frantz JD, Flier JS. 1999. The role of SOCS-3 in leptin signaling and leptin resistance. J. Biol. Chem. 274:30059–30065 - PubMed
    1. Boitani C, Puglisi R. 2008. Selenium, a key element in spermatogenesis and male fertility. Adv. Exp. Med. Biol. 636:65–73 - PubMed
    1. Burk RF, Hill KE. 2009. Selenoprotein P-expression, functions, and roles in mammals. Biochim. Biophys. Acta 1790:1441–1447 - PMC - PubMed
    1. Burk RF, Hill KE. 2005. Selenoprotein P: an extracellular protein with unique physical characteristics and a role in selenium homeostasis. Annu. Rev. Nutr. 25:215–235 - PubMed
    1. Burk RF, et al. 2007. Deletion of apolipoprotein E receptor-2 in mice lowers brain selenium and causes severe neurological dysfunction and death when a low-selenium diet is fed. J. Neurosci. 27:6207–6211 - PMC - PubMed

Publication types

MeSH terms