. 2012 Oct;12(19-20):3030-43.
doi: 10.1002/pmic.201200185. Epub 2012 Sep 19.

Validation of regulated protein phosphorylation events in yeast by quantitative mass spectrometry analysis of purified proteins

Affiliations

Validation of regulated protein phosphorylation events in yeast by quantitative mass spectrometry analysis of purified proteins

Wolfgang Reiter et al. Proteomics. 2012 Oct.

Abstract

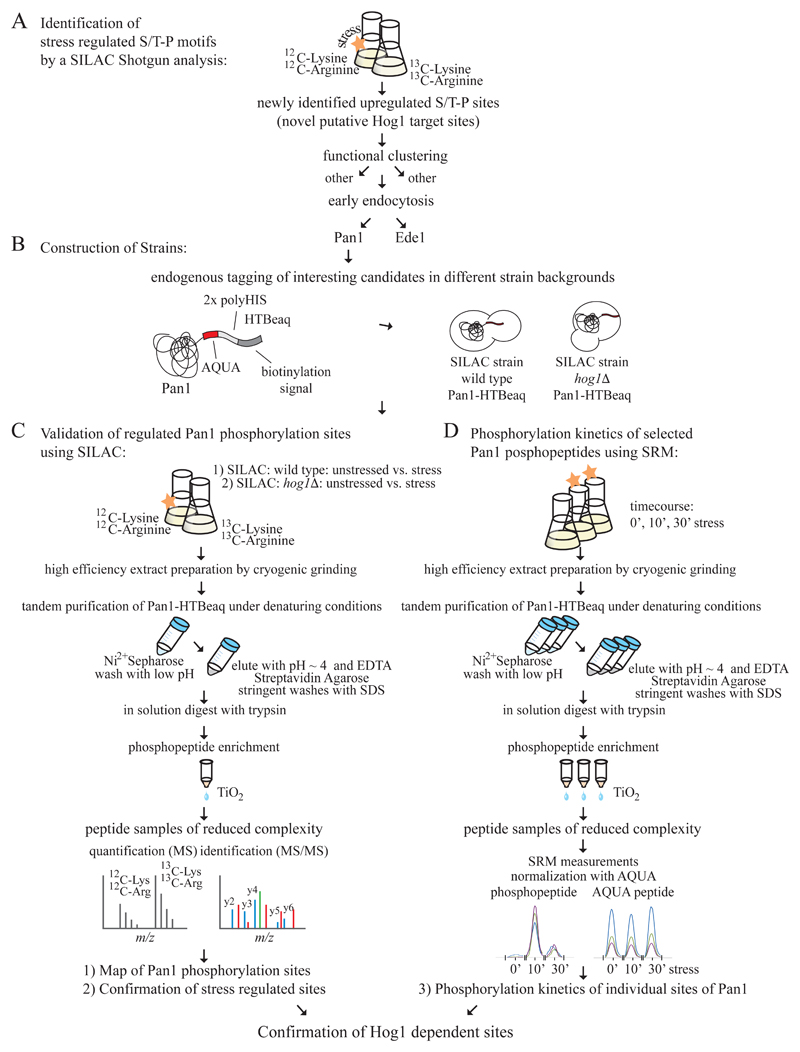
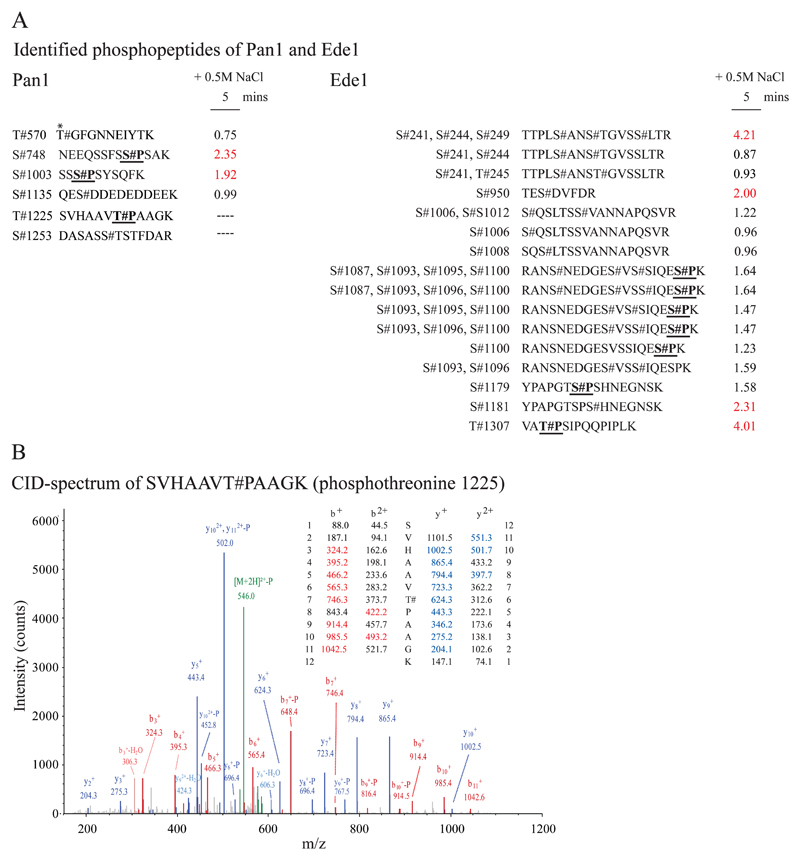
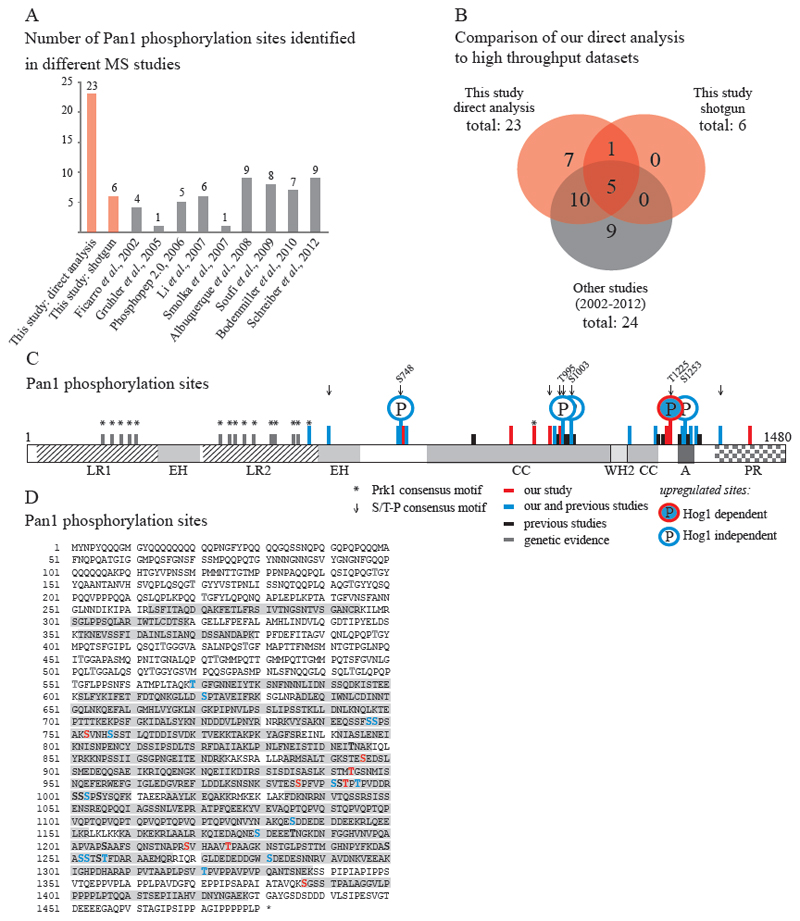
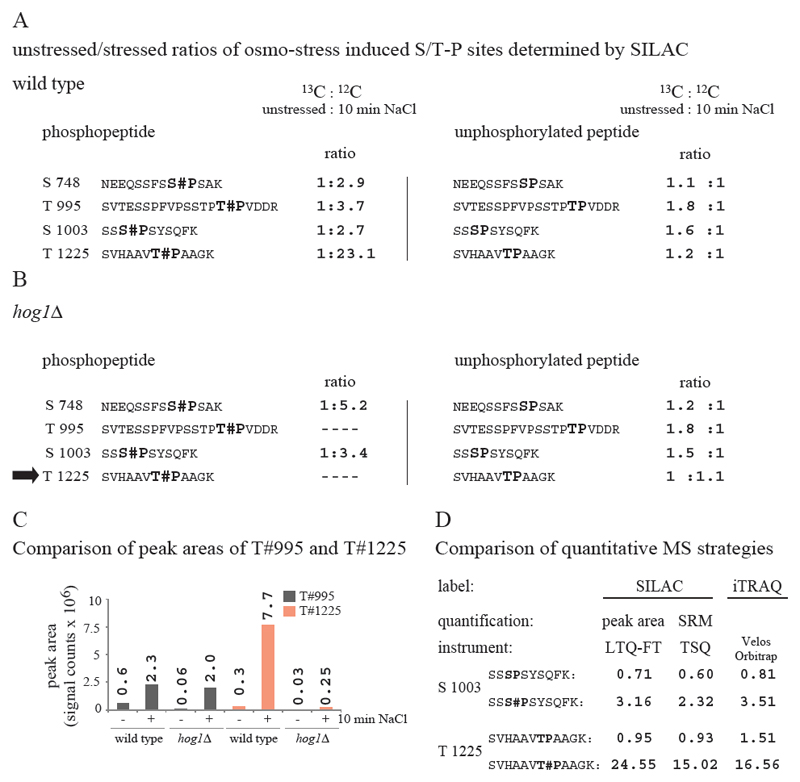
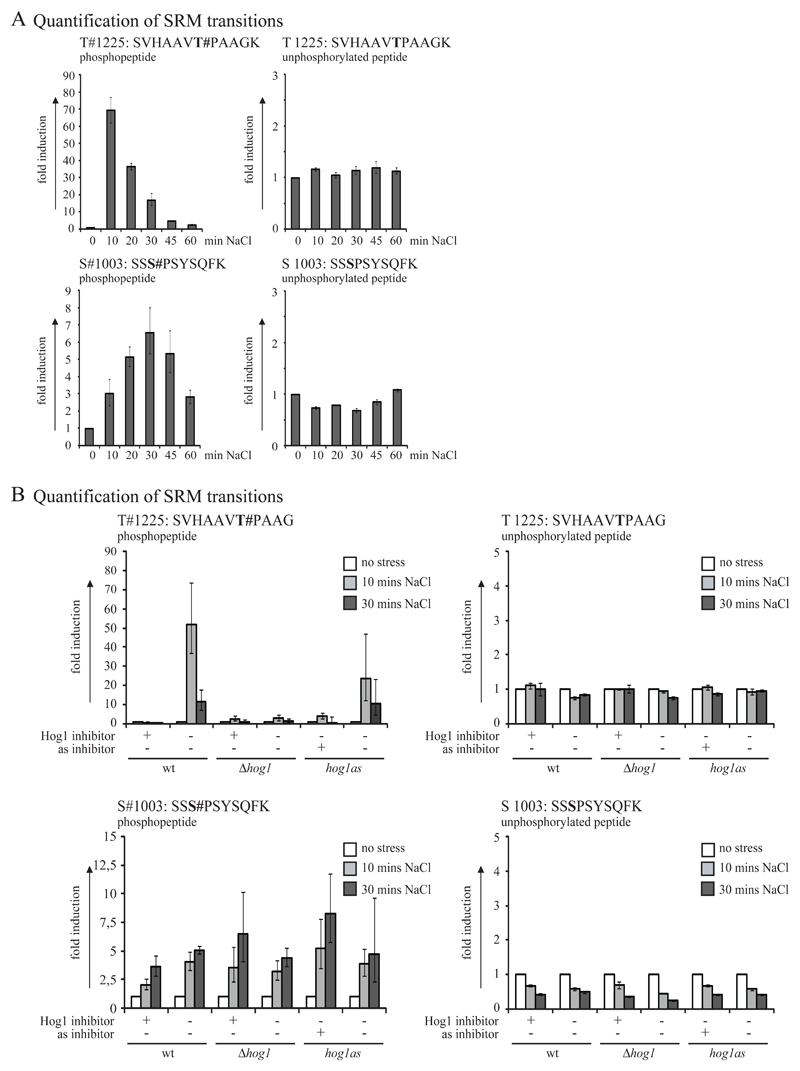
Global phosphoproteomic studies based on MS have generated qualitative and quantitative data describing protein phosphorylation events in various biological systems. Since high-throughput data for protein modifications are inherently incomplete, we developed a strategy to extend and validate such primary datasets. We selected interesting protein candidates from a global screen in yeast and employed a modified histidine biotin tag that allows tandem affinity purifications of our targets under denaturing conditions. Products in question can be digested directly from affinity resins and phosphopeptides can be further enriched via TiO(2) before MS analysis. Our robust protocol can be amended for SILAC as well as iTRAQ quantifications or label-free approaches based on selective reaction monitoring, allowing completion of the phosphorylation pattern in a first step, followed by a detailed analysis of the phosphorylation kinetics. We exemplify the value of such a strategy by an in-depth analysis of Pan1, a highly phosphorylated factor involved in early steps of endocytosis. The study of Pan1 under osmotic stress conditions in different mutant backgrounds allowed us to differentiate between mitogen-activated protein kinase Hog1 driven and Hog1 independent stress responses.


Figures

Figure 1
Figure 1. Representation of our methodological workflow for extending and validating high throughput data sets based on selective protein purification.
A: Primary shotgun experiments lead to the identification of candidate factors. In our case, Pan1 and Ede1, both factors of the early endocytosis machinery, popped up as putative novel Hog1 targets based on an increase in phosphorylation at S/T-P sites. B: Factors of interest become endogenously tagged with our modified histidine biotin tag (HTBeaq). Different strain backgrounds are used that allow determination of kinase dependency of phosphorylation sites. C: Completion of the phosphopattern and validation of regulated phosphorylation sites by SILAC or iTRAQ analysis of affinity purified proteins. Results obtained with wild type and mutant strains are compared. D: Determination of phosphorylation kinetics of individual sites using a targeted SRM approach with purified proteins.
Figure 2
Figure 2. The endocytotic factors Pan1 and Ede1 are a putative targets of MAPK Hog1.
A: Stressed/unstressed ratios of Pan1 and Ede1 phosphopeptides from our shotgun experiment. Phosphorylation sites are indicated with “#”. S/T-P MAPK consensus motifs are highlighted (underlined and bold). “*” indicates Prk1 consensus sites. Stress induced up-regulation is shown in red. B: Annotated collision induced dissociation (CID) spectrum of peptide SVHAAVT#PAAGK (phosphothreonine 1225). Singly and doubly charged N-terminal b ions and C-terminal y ions are indicated in red and blue respectively. Precursor is indicated in green.
Figure 3
Figure 3. Pan1 is highly phosphorylated.
A and B: Comparison of the number of Pan1 phosphorylation sites identified by us (red) to the number identified in independent high throughput MS studies [–10] (grey). C: Scheme of protein Pan1. The two long repeat regions (LR), two Eps15 homology domains (EH), the coiled-coil domain (coil), the acidic domain (A) and the proline-rich domain (PRD) are indicated. Phosphorylation sites identified by us are indicated by red and blue (also identified by others [–10]) bars. Black bars: Phosphorylation sites identified in independent MS studies [–10]. Grey bars: Phosphorylation sites identified by genetic studies [23]. Up-regulated phosphorylation sites are highlighted by circles and indicated amino acid positions. S/T-P MAPK motifs (arrow) and Prk1 (*) motifs are indicated. D: Pan1 sequence with highlighted phosphorylation sites identified by us (red), identified also by others (blue) and identified by independent MS-studies (black) and genetic studies (dark grey). Sequence coverage is highlighted in light grey.
Figure 4
Figure 4. Regulated S/T-P phosphorylation sites of Pan1.
A and B: Pan1-HTBeaq was purified from either wt (A) or hog1Δ (B) strain backgrounds. Untreated (13C arginine and 13C lysine) to osmo-stressed (12C arginine and 12C lysine) ratios are shown. Phosphothreonine 1225 is marked with an arrow. C: Peak areas of phosphopeptides SVTESSPFVPSSTPT#PVDDR (T995) and SVHAAVT#PAAGK (T1225). Note: No 13C peaks were detected in a hog1Δ strain background for both phosphopeptides. However, 12C peak areas of phosphothreonine 995 were comparable between wild type and hog1Δ mutant indicating a Hog1 independent phosphorylation of the site. Data from a representative experiment are shown. D: Comparison of different strategies for quantification. Ratios (stressed/unstressed) obtained for phosphopeptides SSS#PSYSQFK (S1003) or SVHAAVT#PAAGK (T1225) and the corresponding unphosphorylated peptides of Pan1 are indicated. SRM measurements have been corrected for proline conversation (correction value was obtained from SILAC quantification Supplemental Table S12).
Figure 5
Figure 5. Phosphorylation kinetics of S/T-P sites of Pan1.
A: Time course of phosphorylation of threonine 1225 and serine 1003 of Pan1 using SRM analysis. Pan1-HTBeaq has been purified from cells exposed to 0.5M NaCl for 0, 10, 20, 30, 45 and 60 minutes. Shown are geometric means of 4 technical replicates. Error bars denote the geometric standard deviation. B: Time course of phosphorylation of threonine 1225 and serine 1003 of Pan1 using Hog1 specific inhibitors. A specific Hog1 inhibitor was used for wild type and hog1Δ strains, for as-inhibitor treatment a hog1as strain was used. Cells have been exposed to 0.5M NaCl for 0, 10 and 30 minutes in presence (+) or absence (-) of the inhibitors. Shown are geometric means of 3 technical replicates. Error bars denote the geometric standard deviation.

References

    1. Albuquerque CP, Smolka MB, Payne SH, Bafna V, et al. A multidimensional chromatography technology for in-depth phosphoproteome analysis. Mol Cell Proteomics. 2008;7:1389–1396. - PMC - PubMed
    1. Bodenmiller B, Wanka S, Kraft C, Urban J, et al. Phosphoproteomic analysis reveals interconnected system-wide responses to perturbations of kinases and phosphatases in yeast. Sci Signal. 2010;3:rs4. - PMC - PubMed
    1. de Godoy LM, Olsen JV, Cox J, Nielsen ML, et al. Comprehensive mass-spectrometry-based proteome quantification of haploid versus diploid yeast. Nature. 2008;455:1251–1254. - PubMed
    1. Ficarro SB, McCleland ML, Stukenberg PT, Burke DJ, et al. Phosphoproteome analysis by mass spectrometry and its application to Saccharomyces cerevisiae. Nat Biotechnol. 2002;20:301–305. - PubMed
    1. Ghaemmaghami S, Huh WK, Bower K, Howson RW, et al. Global analysis of protein expression in yeast. Nature. 2003;425:737–741. - PubMed

Publication types

MeSH terms