. 2012 Aug 7:3:141.
doi: 10.3389/fgene.2012.00141. eCollection 2012.

Identification of Stage-Specific Gene Expression Signatures in Response to Retinoic Acid during the Neural Differentiation of Mouse Embryonic Stem Cells

Affiliations

Identification of Stage-Specific Gene Expression Signatures in Response to Retinoic Acid during the Neural Differentiation of Mouse Embryonic Stem Cells

Hiromi Akanuma et al. Front Genet. .

Abstract

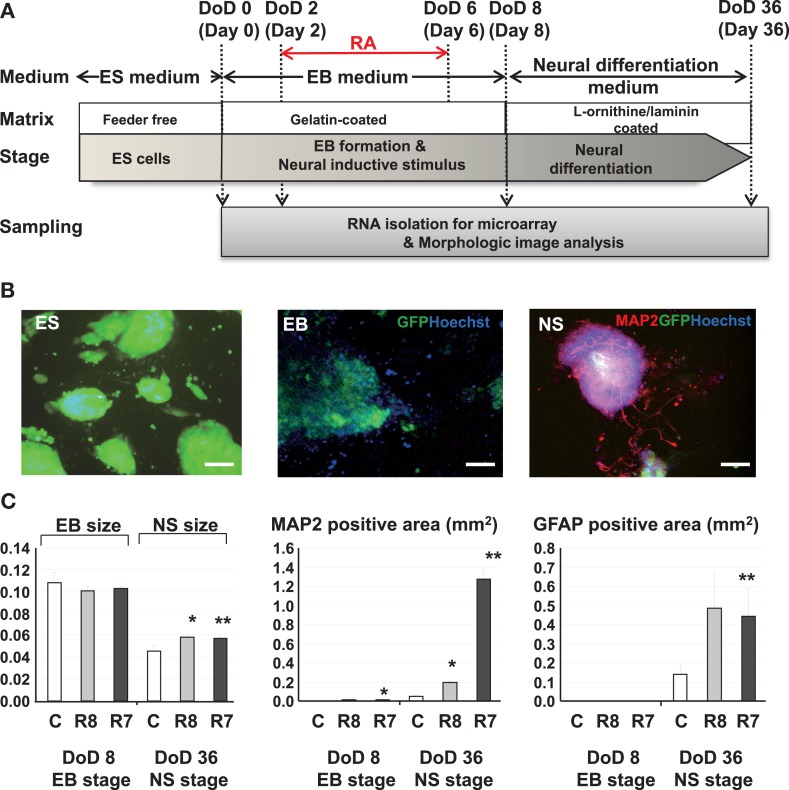
We have previously established a protocol for the neural differentiation of mouse embryonic stem cells (mESCs) as an efficient tool to evaluate the neurodevelopmental toxicity of environmental chemicals. Here, we described a multivariate bioinformatic approach to identify the stage-specific gene sets associated with neural differentiation of mESCs. We exposed mESCs (B6G-2 cells) to 10(-8) or 10(-7) M of retinoic acid (RA) for 4 days during embryoid body formation and then performed morphological analysis on day of differentiation (DoD) 8 and 36, or genomic microarray analysis on DoD 0, 2, 8, and 36. Three gene sets, namely a literature-based gene set (set 1), an analysis-based gene set (set 2) using self-organizing map and principal component analysis, and an enrichment gene set (set 3), were selected by the combined use of knowledge from literatures and gene information selected from the microarray data. A gene network analysis for each gene set was then performed using Bayesian statistics to identify stage-specific gene expression signatures in response to RA during mESC neural differentiation. Our results showed that RA significantly increased the size of neurosphere, neuronal cells, and glial cells on DoD 36. In addition, the gene network analysis showed that glial fibrillary acidic protein, a neural marker, remarkably up-regulates the other genes in gene set 1 and 3, and Gbx2, a neural development marker, significantly up-regulates the other genes in gene set 2 on DoD 36 in the presence of RA. These findings suggest that our protocol for identification of developmental stage-specific gene expression and interaction is a useful method for the screening of environmental chemical toxicity during neurodevelopmental periods.

Keywords: Bayesian network; mouse embryonic stem cells; neural differentiation; retinoic acid; toxicity screening.


Figures

Figure 1
Figure 1
Experimental protocols and morphological analysis of the effect of RA on the neural differentiation of mESCs. (A) A Schematic diagram of cell cultures and chemical exposures. (B) Pictures of mESCs, EBs, and neurospheres (NS) with neurite growth derived from neurosphere in fluorescent fields. Green, blue, and red fluorescent images indicate GFP of cytoskeleton proteins, nuclei stained with Hoechst and neuronal cells and neurites stained with the anti Map2 antibody. Scale bar is 100 μm. (C) Morphological analysis of neuronal cell lineages exposed to RAs. Comparison of the EB areas on DoD 8 and DoD 36 showed that the EB area decreased with neuronal cell development. In RA-treated EBs, the numbers of Map2-positive axons and Gfap-positive cells were increased compared with the control. Symbols of C, R8, and R7 indicate vehicle control, RA 10−8 M, and RA 10−7 M.
Figure 2
Figure 2
Gene expression analysis by DNA microarray and gene selection strategies for the Bayesian network analysis of differentiation of neuronal cells derived from mESCs. (A) Heat map of hierarchical clustering generated from DNA microarray data. Color-coding in the heat map is that blue from red indicates – 4.0 from 4.0 log2 normalized intensity value by ES values, indicating that red is for up regulation and blue is for down regulation. (B) Gene expression of pluripotency and differentiation markers in mESCs, EB, and NS measured in DNA microarray. Symbols of C, R8, and R7 indicate vehicle control, RA 10−8 M, and RA 10−7 M. (C) Stage-specific gene expression signatures in response to RA during the neural differentiation of mESCs were identified as follows: set 1 was a set of genes selected from the literature; set 2 was selected by SOM and PCA after selecting 36 genes from pathway maps; set 3 was selected by SOM and PCA after selecting 159 genes from pathway maps. Expression values of microarray data corresponding to genes in these three sets were used for the Bayesian network analysis.
Figure 3
Figure 3
Matrices in gene interaction networks of the literature-based gene set (set 1) in mESCs, EB, and NP of neuronal differentiation. Gene Symbols, RARa, RARb, RARg, Nanog, Pou5f1, Zfp42, Fgfr1, Olig2, Sox2, Gfap, Map2, Nestin, Tuj1, line up in order of up to down in the y axis and left to right in the x axis. Red indicates upregulated genes and blue indicates downregulated genes. Red indicates that genes from the y axis upregulated genes from the x axis. Blue indicates that genes from the y axis downregulated genes from the x axis. Symbols of C, R8, and R7 indicate vehicle control, RA 10−8 M, and RA 10−7 M.
Figure 4
Figure 4
Matrices in gene interaction networks of the analysis-based gene set (set 2) in mESCs, EB, and NP of neuronal differentiation. Gene Symbols, Map2k1, Mapk1, Mapk3, Pla2g6, Rps6ka1, Shc1, Atbf1, Cdv1, Rhog, Rif1, Sall1, Smarcad1, Fos, Gbx2, Hras1, Raf1, Sox2, Gfap, Map2, Nestin, Tuji1 line up in order of up to down in the y axis and left to right in the x axis. Red indicates upregulated genes and blue indicates down regulated genes. Red indicates that genes from the y axis up regulated genes from the x axis. Blue indicates that genes from the y axis downregulated genes from the x axis. Symbols of C, R8, and R7 indicate vehicle control, RA 10−8 M, and RA 10−7 M.
Figure 5
Figure 5
Matrices in gene interaction networks of the enrichment gene set (set 3) in mESCs, EB, and NP of neuronal differentiation. Gene Symbols, Adora2a, Drd5, Fgf13, Gnao1, Notch2, Tnr, Ascl1, Gusb, Mef2c, Pax5, Pou3f3, Bdnf, Gdnf, Nrp2, Slit2, Ywhah, Gfap, Map2, Nestin, Tuji1 line up in order of up to down in the y axis and left to right in the x axis. Red indicates up regulated genes and blue indicates down regulated genes. Red indicates that genes from the y axis up regulated genes from the x axis. Blue indicates that genes from the y axis down regulated genes from the x axis. Symbols of C, R8, and R7 indicate vehicle control, RA 10−8 M, and RA 10−7 M.
Figure A1
Figure A1
Gene interaction networks of the literature-based gene set (set 1) in mESCs, EB, and NP of neuronal differentiation. The optimized network was generated at p > 0.300. Red indicates that parent genes up-regulate children genes. Blue indicates that parent genes down-regulate children genes.
Figure A2
Figure A2
Gene interaction networks of the analysis-based gene set (set 2) in mESCs, EB, and NP of neuronal differentiation. The optimized network was generated at p > 0.300. Red indicates that parent genes up-regulate children genes. Blue indicates that parent genes down-regulate children genes.
Figure A3
Figure A3
Gene interaction networks of the enrichment gene set (set 3) in mESCs, EB, and NP of neuronal differentiation. The optimized network was generated at p > 0.300. Red indicates that parent genes up-regulate children genes. Blue indicates that parent genes down-regulate children genes.

Similar articles

Cited by

References

    1. Ahn S. M., Byun K., Kim D., Lee K., Yoo J. S., Kim S. U., Jho E. H., Simpson R. J., Lee B. (2008). Olig2-induced neural stem cell differentiation involves downregulation of Wnt signaling and induction of Dickkopf-1 expression. PLoS ONE 3, e3917.10.1371/journal.pone.0002829 - DOI - PMC - PubMed
    1. Aiba K., Sharov A. A., Carter M. G., Foroni C., Vescovi A. L., Ko M. S. (2006). Defining a developmental path to neural fate by global expression profiling of mouse embryonic stem cells and adult neural stem/progenitor cells. Stem Cells 24, 889–89510.1634/stemcells.2005-0332 - DOI - PubMed
    1. Akamatsu W., Deveale B., Okano H., Cooney A. J., van der Kooy D. (2009). Suppression of Oct-4 by germ cell nuclear factor restricts pluripotency and promotes neural stem cell development in the early neural lineage. J. Neurosci. 29, 2113–212410.1523/JNEUROSCI.4527-08.2009 - DOI - PMC - PubMed
    1. Asano H., Aonuma M., Sanosaka T., Kohyama J., Namihira M., Nakashima K. (2009). Astrocyte differentiation of neural precursor cells is enhanced by retinoic acid through a change in epigenetic modification. Stem Cells 27, 2744–275210.1002/stem.176 - DOI - PubMed
    1. Catena R., Tiveron C., Ronchi A., Porta S., Ferri A., Tatangelo L., Cavallaro M., Favaro R., Ottolenghi S., Reinbold R., Schöler H., Nicolis S. K. (2004). Conserved POU binding DNA sites in the Sox2 upstream enhancer regulate gene expression in embryonic and neural stem cells. J. Biol. Chem. 279, 41846–4185710.1074/jbc.M405514200 - DOI - PubMed