

Phase and absorption retrieval using incoherent X-ray sources
- PMID: 22891301
- PMCID: PMC3435200
- DOI: 10.1073/pnas.1205396109
Phase and absorption retrieval using incoherent X-ray sources
Abstract
X-ray phase contrast imaging has overcome the limitations of X-ray absorption imaging in many fields. Particular effort has been directed towards developing phase retrieval methods: These reveal quantitative information about a sample, which is a requirement for performing X-ray phase tomography, allows material identification and better distinction between tissue types, etc. Phase retrieval seems impossible with conventional X-ray sources due to their low spatial coherence. In the only previous example where conventional sources have been used, collimators were employed to produce spatially coherent secondary sources. We present a truly incoherent phase retrieval method, which removes the spatial coherence constraints and employs a conventional source without aperturing, collimation, or filtering. This is possible because our technique, based on the pixel edge illumination principle, is neither interferometric nor crystal based. Beams created by an X-ray mask to image the sample are smeared due to the incoherence of the source, yet we show that their displacements can still be measured accurately, obtaining strong phase contrast. Quantitative information is extracted from only two images rather than a sequence as required by several coherent methods. Our technique makes quantitative phase imaging and phase tomography possible in applications where exposure time and radiation dose are critical. The technique employs masks which are currently commercially available with linear dimensions in the tens of centimeters thus allowing for a large field of view. The technique works at high photon energy and thus promises to deliver much safer quantitative phase imaging and phase tomography in the future.
Conflict of interest statement
The authors declare no conflict of interest.
Figures
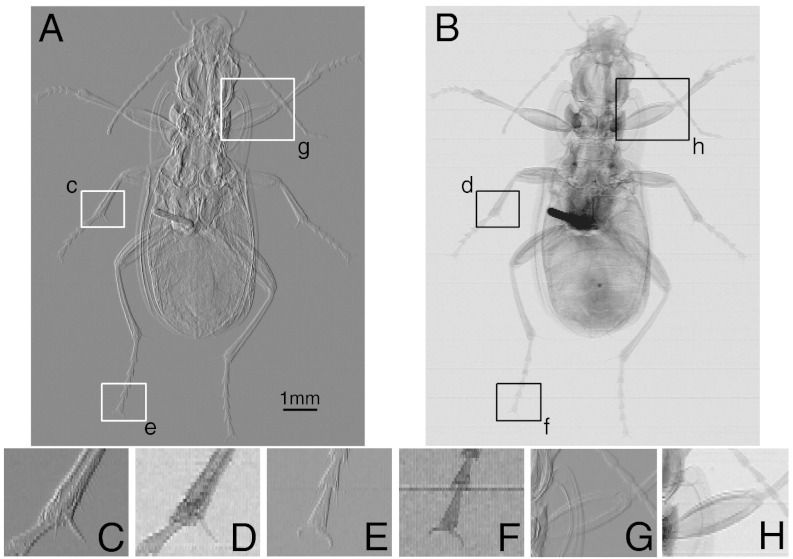
 ) for a ground beetle. (B) The absorption image
  of the ground beetle. The smaller images along the lower part of the figure are blown up versions of the boxed regions in A and B. In both cases the image contrast has been saturated slightly to enhance the visibility. Note also that the highly absorbing region near the center of the beetle is a metal pin. (C and D) Small hairs attached to the leg are visible on the DP contrast image (C), yet completely invisible in the absorption image (D). Other fine details are much better defined in the DP image. (E and F) Structure and fine details are much better resolved in the DP image (E). (G and H) Internal structure of over laying features are much better defined in the DP image (G).
References
-
- Castelli E, et al. Clinical mammography at the syrmep beam line. Nucl Instrum Methods Phys Res A. 2007;572:237–240.
-
- Morita T, et al. In: A Comparison Between Film-Screen Mammography and Full-Field Digital Mammography Utilizing Phase Contrast Technology in Breast Cancer Screening Programs. Krupinski E, editor. Vol 5116. Berlin: Springer; 2008. pp. 48–54. (Lecture Notes in Computer Science).
-
- Lewis R. Medical phase contrast X-ray imaging: Current status and future prospects. Phys Med Biol. 2004;49:3573–3583. - PubMed
-
- Chapman D, et al. Diffraction enhanced x-ray imaging. Phys Med Biol. 1997;42:2015–2025. - PubMed
-
- Paganin D, Gureyev TE, Pavlov KM, Lewis RA, Kitchen M. Phase retrieval using coherent imaging systems with linear transfer functions. Opt Commun. 2004;234:87–105.
Publication types
MeSH terms
Grants and funding
LinkOut - more resources
Full Text Sources
Other Literature Sources
