. 2012 Aug 28;109(35):14212-7.
doi: 10.1073/pnas.1206037109. Epub 2012 Aug 13.

Biophysical mechanisms of MRI signal frequency contrast in multiple sclerosis

Affiliations

Biophysical mechanisms of MRI signal frequency contrast in multiple sclerosis

Dmitriy A Yablonskiy et al. Proc Natl Acad Sci U S A. .

Abstract

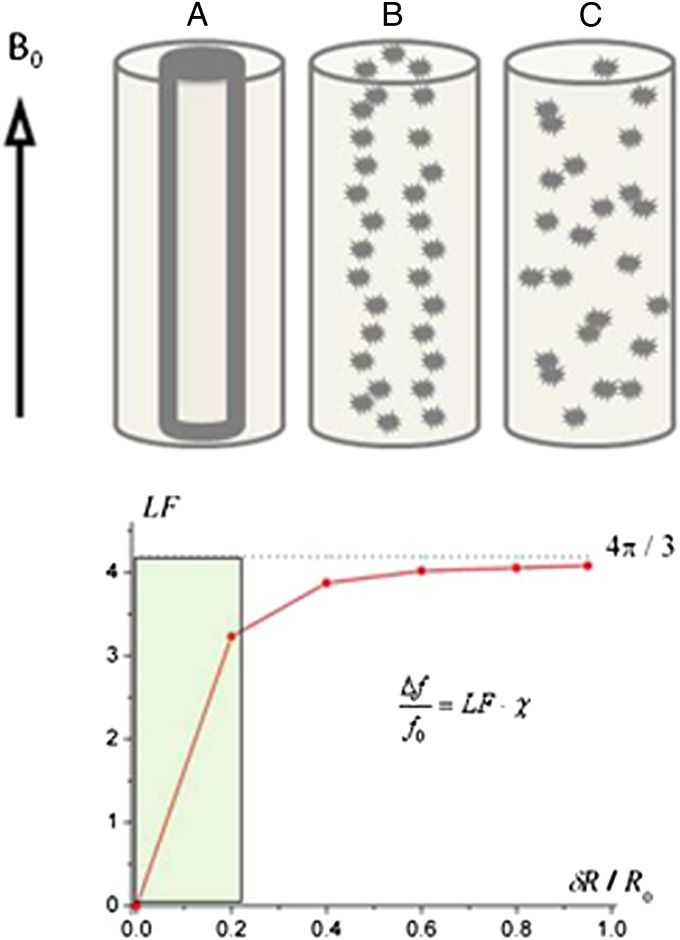
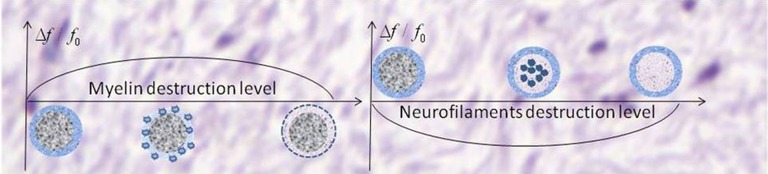
Phase images obtained with gradient echo MRI provide image contrast distinct from T1- and T2-weighted images. It is commonly assumed that the local contribution to MRI signal phase directly relates to local bulk tissue magnetic susceptibility. Here, we use Maxwell's equations and Monte Carlo simulations to provide theoretical background to the hypothesis that the local contribution to MRI signal phase does not depend on tissue bulk magnetic susceptibility but tissue magnetic architecture--distribution of magnetic susceptibility inclusions (lipids, proteins, iron, etc.) at the cellular and subcellular levels. Specifically, we show that the regular longitudinal structures forming cylindrical axons (myelin sheaths and neurofilaments) can be locally invisible in phase images. Contrary to an expectation that the phase contrast in multiple sclerosis lesions should always increase in degree along with worsening of lesion severity (which happens for all known MR magnitude-based contrast mechanisms), we show that phase contrast can actually disappear with extreme tissue destruction. We also show that the phase contrast in multiple sclerosis lesions could be altered without loss of nervous system tissue, which happens in mild injury to the myelin sheaths or axonal neurofilaments. Moreover, we predict that the sign of phase contrast in multiple sclerosis lesions indicates the predominant type of tissue injury-myelin damage (positive sign) vs. axonal neurofilament damage (negative sign). Therefore, our theoretical and experimental results shed light on understanding the relationship between gradient echo MRI signal phase and multiple sclerosis pathology.


Conflict of interest statement

Conflict of interest statement: A.H.C. was a consultant for Teva Pharmaceutical Industries Ltd., Biogen Idec Inc., F. Hoffmann–La Roche Ltd., MedImmune, and Coronado Biosciences. A.H.C. also discloses support from Novartis Research, F. Hoffmann–La Roche Ltd Research, and the Sanofi-aventis Group.

Figures

Fig. 1.
Fig. 1.
Effect of increasing myelin sheath damage on phase/frequency of MR signal derived from computer Monte Carlo simulations. (A) Schematic of an intact axon (internal cylinder) covered by a myelin sheath (bold outline of cylinder) in an extracellular space (between bold and outer cylinder) with radius R0. (B) Mildly damaged myelin sheath: fragments of the original structure are slightly scattered. (C) Severely damaged myelin sheath: fragments of initial structure are scattered randomly. (Lower) Dependence of the LF in the MR signal frequency shift on the level of destruction (δR is the average fragments’ displacement). The shaded zone (0–0.2) indicates minor injury to tissue, where even a small increase in the disorder parameter δR (horizontal axis) will rapidly and dramatically change the LF and hence, also change signal phase/frequency.
Fig. 2.
Fig. 2.
Schematic structure of the MR signal phase/frequency change with MSL severity for two types of tissue destruction. (Left) Pure myelin injury. (Right) Pure injury to neurofilaments. Minimal myelin injury, which may not be apparent on standard T2W and T1W images, will appear positive by phase, corresponding to the initial ascending portion of Left (also in Fig. 1). For moderately severe lesions with predominant myelin injury (center of the left figure has a medium TDS score), phase will also be positive. However, axon destruction is often also present, and the relative degree of myelin and neurofilament destruction will affect the sign of the phase change. Severe lesions, such as persistent black holes, with a high TDS score and significant destruction of both myelin and axons might disappear on phase images.
Fig. 3.
Fig. 3.
Example of an MSL (marked by a blue rectangle) that has a range of TDS represented by the colors on the vertical bar. TDS is overlaid on T1f image. Data were obtained from a subject with relapsing remitting multiple sclerosis disease (female, age 42 y, EDSS 2.0).
Fig. 4.
Fig. 4.
Example of data obtained from a subject with secondary progressive multiple sclerosis (female, age 49, EDSS 6.5). Note the prominent contrast between GM and WM on the GEPCI T1f image compared with other images. Rectangles outline abnormalities observed on FLAIR or frequency (phase) maps. Orange rectangles denote an alteration seen in phase images (bright contrast) but not T1W, FLAIR, or GEPCI FST2*. This alteration may represent a very mild lesion with damaged myelin, and it is also seen on GEPCI T1f image as negative dark contrast. Blue rectangles outline a small MSL that is barely seen on FLAIR and GEPCI FST2*, and it is also visible on the phase image. Red rectangles outline a severe MSL (very high TDS score) that is seen on T1W, FLAIR, and GEPCI FST2* but does not have a footprint on the phase image. A magnified view of this lesion is shown in Inset with overlaid GEPCI TDS score in color according to the color bar.
Fig. 5.
Fig. 5.
Example of data obtained from a subject with relapsing remitting multiple sclerosis disease (male, age 52 y, EDSS 3.5) showing multiple lesions (red rectangles) with intermediate TDS scores (overlaid on GEPCI T1f image). Here, lesions seen on FLAIR are also seen on GEPCI T1W, GEPCI FST2* (GEPCI analog of FLAIR) and GEPCI frequency map. The area within the orange ovals also corresponds to intermediate TDS with low phase contrast.

Similar articles

Cited by

References

    1. Abduljalil AM, Schmalbrock P, Novak V, Chakeres DW. Enhanced gray and white matter contrast of phase susceptibility-weighted images in ultra-high-field magnetic resonance imaging. J Magn Reson Imaging. 2003;18:284–290. - PubMed
    1. Rauscher A, Sedlacik J, Barth M, Mentzel HJ, Reichenbach JR. Magnetic susceptibility-weighted MR phase imaging of the human brain. AJNR Am J Neuroradiol. 2005;26:736–742. - PMC - PubMed
    1. Duyn JH, et al. High-field MRI of brain cortical substructure based on signal phase. Proc Natl Acad Sci USA. 2007;104:11796–11801. - PMC - PubMed
    1. Zhong K, Leupold J, von Elverfeldt D, Speck O. The molecular basis for gray and white matter contrast in phase imaging. Neuroimage. 2008;40:1561–1566. - PubMed
    1. Marques JP, Maddage R, Mlynarik V, Gruetter R. On the origin of the MR image phase contrast: An in vivo MR microscopy study of the rat brain at 14.1 T. Neuroimage. 2009;46:345–352. - PubMed

Publication types

Substances