. 2012 Aug 28;109(35):14052-7.
doi: 10.1073/pnas.1207509109. Epub 2012 Aug 13.

Climate-driven regime shifts in Arctic marine benthos

Affiliations

Climate-driven regime shifts in Arctic marine benthos

Susanne Kortsch et al. Proc Natl Acad Sci U S A. .

Abstract

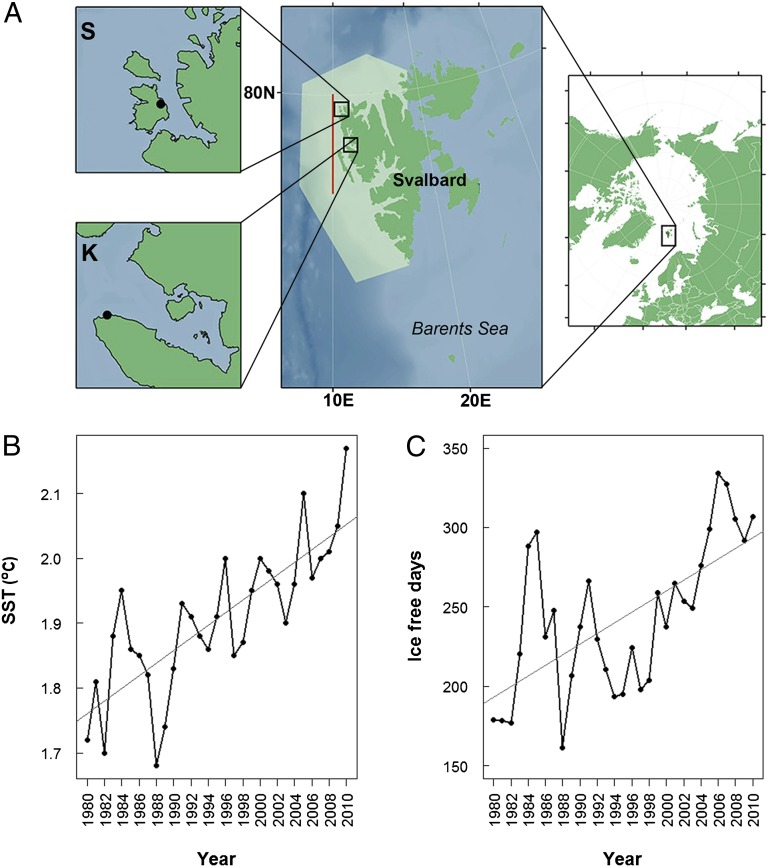
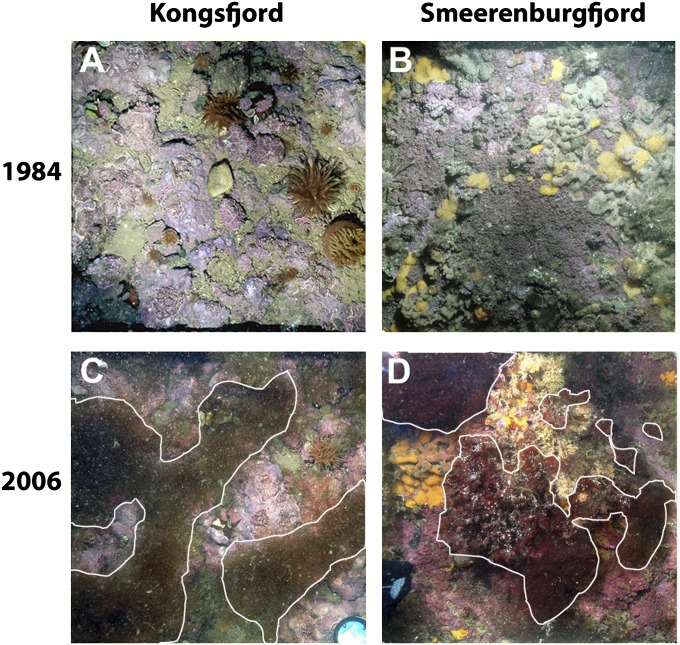
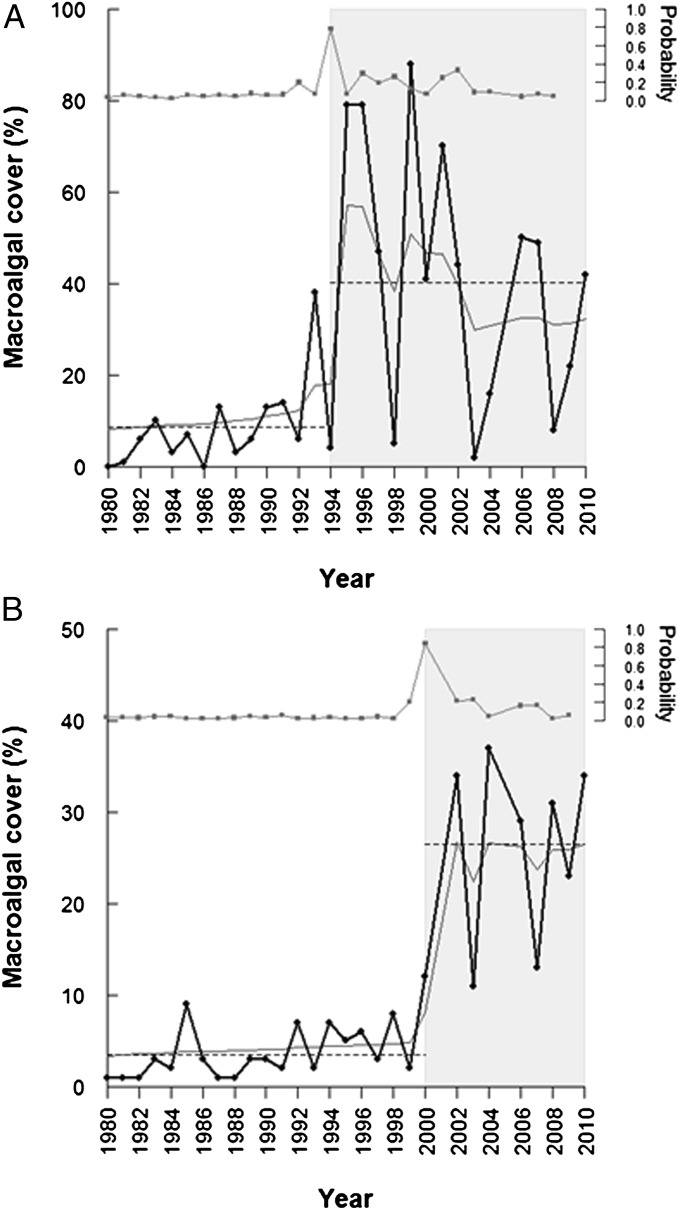
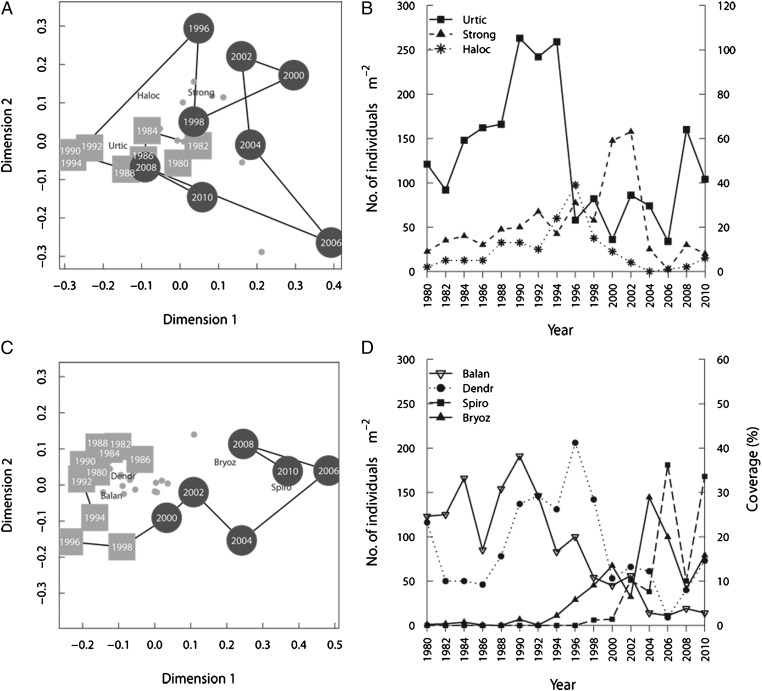
Climate warming can trigger abrupt ecosystem changes in the Arctic. Despite the considerable interest in characterizing and understanding the ecological impact of rapid climate warming in the Arctic, few long time series exist that allow addressing these research goals. During a 30-y period (1980-2010) of gradually increasing seawater temperature and decreasing sea ice cover in Svalbard, we document rapid and extensive structural changes in the rocky-bottom communities of two Arctic fjords. The most striking component of the benthic reorganization was an abrupt fivefold increase in macroalgal cover in 1995 in Kongsfjord and an eightfold increase in 2000 in Smeerenburgfjord. Simultaneous changes in the abundance of benthic invertebrates suggest that the macroalgae played a key structuring role in these communities. The abrupt, substantial, and persistent nature of the changes observed is indicative of a climate-driven ecological regime shift. The ecological processes thought to drive the observed regime shifts are likely to promote the borealization of these Arctic marine communities in the coming years.


Conflict of interest statement

The authors declare no conflict of interest.

Figures

Fig. 1.
Fig. 1.
Map of the study area and time series of the SST and ice-free days (1980–2010). (A) The two study sites Kongsfjord (K) and Smeerenburgfjord (S) are detailed (Upper and Lower Left), the position of the fjords along the coast of Svalbard is shown (Middle) (red line, SST transect; light green area, ice-cover sampling area), and the location of Svalbard in the Arctic is shown (Right). (B) Time series of SST (in °C) along the northwest coast of Svalbard. (C) Time series of the length of the ice-free season (ice-free days). The trend lines (gray) in B and C are calculated as linear regressions (SST = 0.01·Year-17.5, R2 = 0.58; ice-free days = 3.3·Year-6429, R2 = 0.41).
Fig. 2.
Fig. 2.
Photographs of the rocky bottom communities (15 m of depth) from two Arctic fjords: Kongsfjord (78°58.60′N, 11°30.10′E) and Smeerenburgfjord (79°41.33′N, 11°04.00′E). The photographs are representative for the communities before (1984) and after (2006) the macroalgal regime shift. In 1984, Kongsfjord is characterized by calcareous algae and sea anemones (A), whereas Smeerenburgfjord is characterized by calcareous algae and aggregations of various sessile filter feeders (sponges, ascidians and barnacles) (B). In 2006, Kongsfjord is dominated by filamentous brown algae (C), whereas Smeerenburgfjord is characterized by filamentous and canopy-forming red macroalgae, bryozoans, and ascidians (D). The macroalgal coverage is encircled by a white line.
Fig. 3.
Fig. 3.
Time series of macroalgal cover in two Arctic fjords. (A) In Kongsfjord, erect filamentous brown algae increased abruptly in 1995 (change point estimate). (B) In Smeerenburgfjord, erect brown and red algae showed a sudden increase in 2000 (change point estimate). The dotted line shows the sample mean for the two regimes (white and gray shaded areas), and the lower gray line shows the posterior mean. The upper gray line shows the posterior probability (secondary y axis) of a change point (regime shift) in macroalgal cover taking place at a given time.
Fig. 4.
Fig. 4.
Temporal (1980–2010) development of community structure and abundance of selected invertebrate fauna for the two fjords. The nmMDS biplots (A and C) illustrate temporal changes in community structure. The squares and circles depict the years before and after the regime shift, respectively, the split being calculated via chronological clustering. Labels are given only for the most representative taxa of the two regimes, the dots display the remaining taxa. In Kongsfjord (A and B) sea anemones Urticina eques (Urtic, primary y axis in B) were dominant in the period before 1995 after which they decreased rapidly, in concomitance with an increase in sea urchins (Strongylcentrotus droebachiensis, Strong) and ascidians (Halocynthia pyriformis, Haloc) (Strong and Haloc, secondary y axis). In Smeerenburgfjord (C and D), barnacles (Balanus spp., Balan), and ascidians (Dendrodoa aggregata, Dendr) are characteristic of the period before 2000 and Bryozoans (Bryoz, secondary y axis) and spirorbid polychaetes (Spirorbis spirorbis, Spiro) of the period after 2000.

References

    1. Hansen J, et al. Global temperature change. Proc Natl Acad Sci USA. 2006;103:14288–14293. - PMC - PubMed
    1. Comiso JC, Parkinson CL, Gertsen R, Stock L. 2006. Accelerated decline in the Arctic sea ice cover. Geophy Res Lett 33:L18504.
    1. Qu B, Gabric AJ, Matrai PA. The satellite-derived distribution of chlorophyll-a and its relation to ice cover, radiation and sea surface temperature in the Barents Sea. Polar Biol. 2006;29:196–210.
    1. Arrigo KR, van Dijken G, Pabi S. Impact of a shrinking Arctic ice cover on marine primary production. Geophys Res Lett. 2008;35:L19603.
    1. Rodrigues J. The increase in the length of the ice-free season in the Arctic. Cold Reg Sci Technol. 2009;59:78–101.

Publication types