. 2012 Aug 28;109(35):14247-52.
doi: 10.1073/pnas.1205012109. Epub 2012 Aug 13.

Temperature during embryonic development has persistent effects on thermal acclimation capacity in zebrafish

Affiliations

Temperature during embryonic development has persistent effects on thermal acclimation capacity in zebrafish

Graham R Scott et al. Proc Natl Acad Sci U S A. .

Abstract

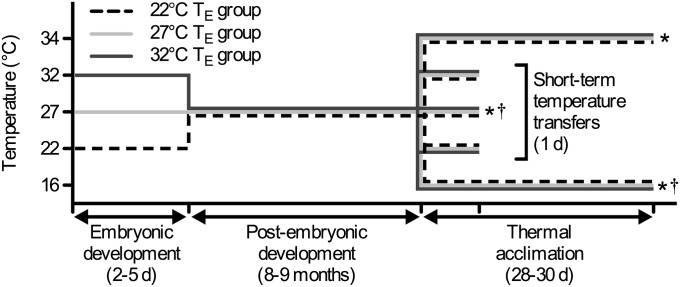
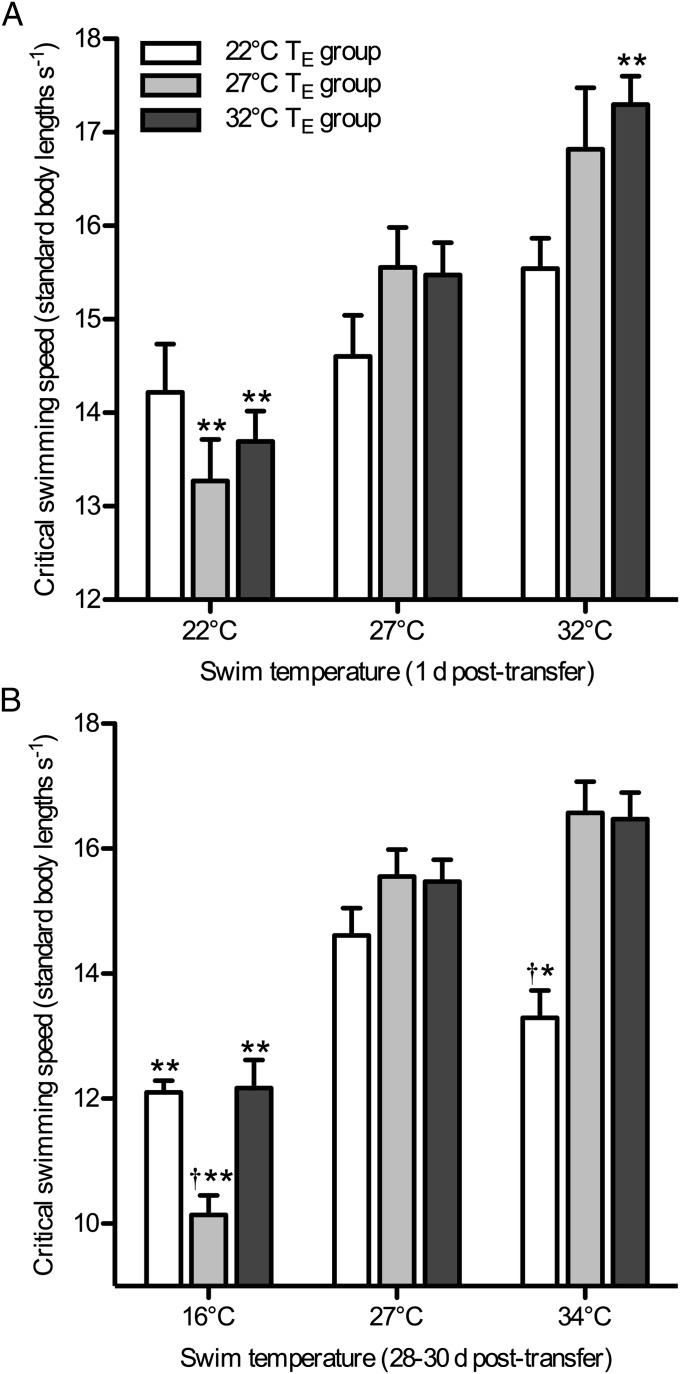
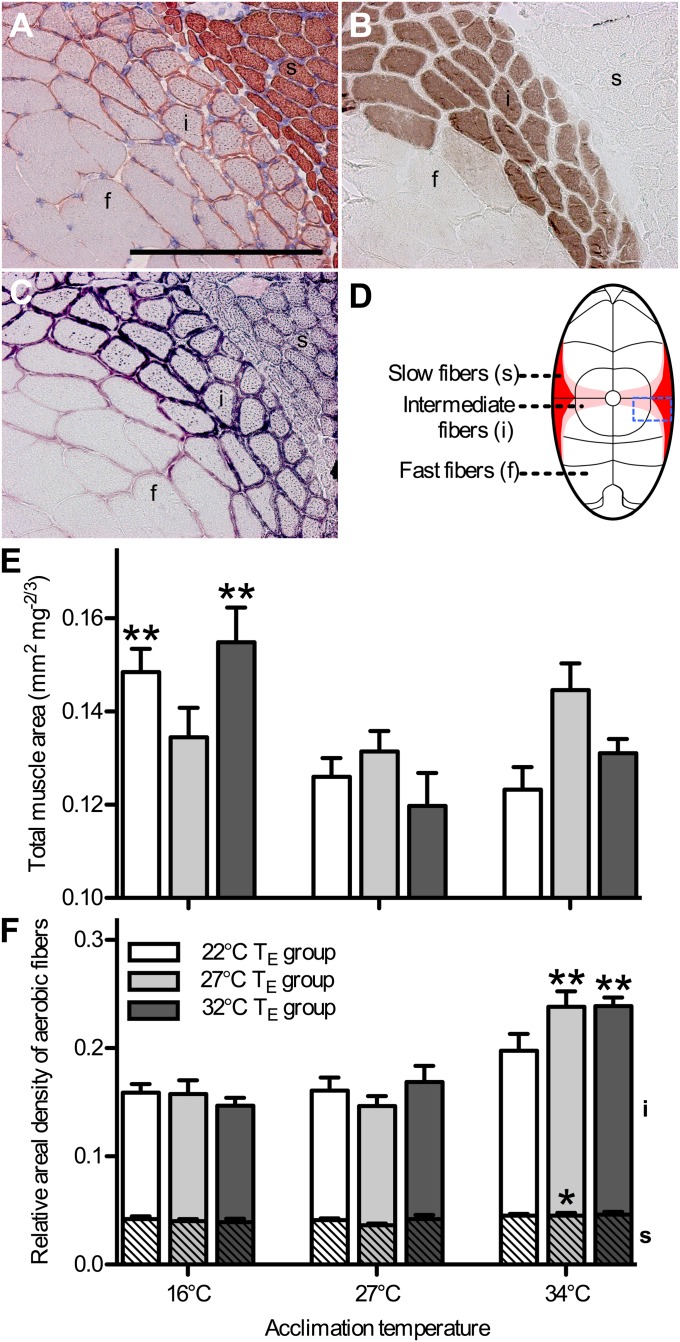
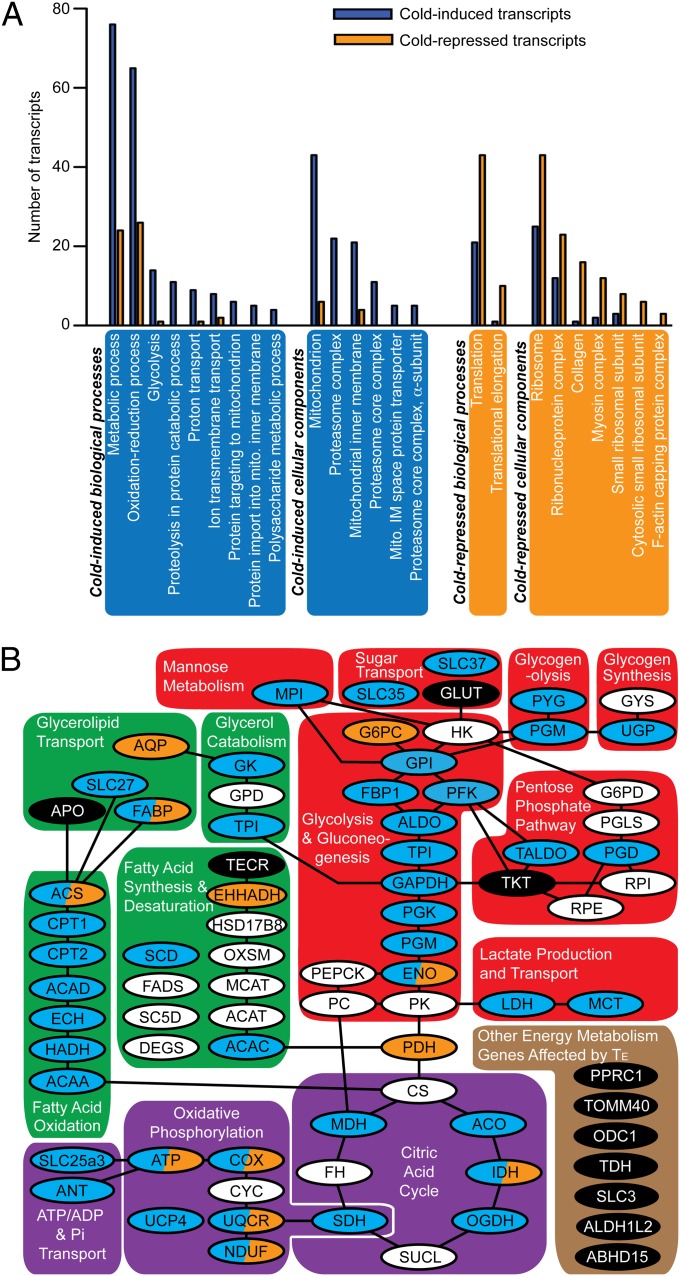
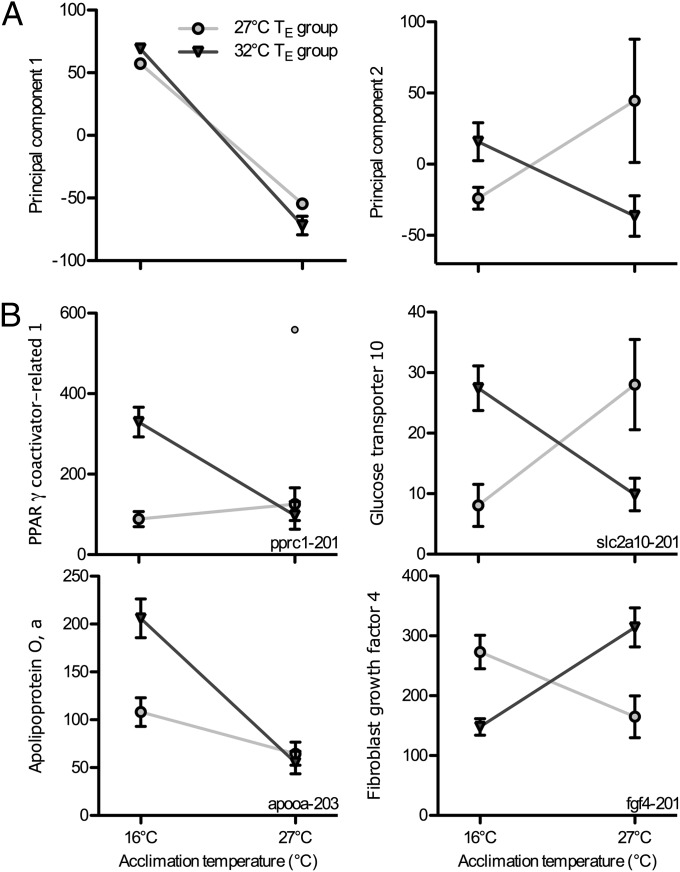
Global warming is intensifying interest in the mechanisms enabling ectothermic animals to adjust physiological performance and cope with temperature change. Here we show that embryonic temperature can have dramatic and persistent effects on thermal acclimation capacity at multiple levels of biological organization. Zebrafish embryos were incubated until hatching at control temperature (T(E) = 27 °C) or near the extremes for normal development (T(E) = 22 °C or 32 °C) and were then raised to adulthood under common conditions at 27 °C. Short-term temperature challenge affected aerobic exercise performance (U(crit)), but each T(E) group had reduced thermal sensitivity at its respective T(E). In contrast, unexpected differences arose after long-term acclimation to 16 °C, when performance in the cold was ∼20% higher in both 32 °C and 22 °C T(E) groups compared with 27 °C T(E) controls. Differences in performance after acclimation to cold or warm (34 °C) temperatures were partially explained by variation in fiber type composition in the swimming muscle. Cold acclimation changed the abundance of 3,452 of 19,712 unique and unambiguously identified transcripts detected in the fast muscle using RNA-Seq. Principal components analysis differentiated the general transcriptional responses to cold of the 27 °C and 32 °C T(E) groups. Differences in expression were observed for individual genes involved in energy metabolism, angiogenesis, cell stress, muscle contraction and remodeling, and apoptosis. Therefore, thermal acclimation capacity is not fixed and can be modified by temperature during early development. Developmental plasticity may thus help some ectothermic organisms cope with the more variable temperatures that are expected under future climate-change scenarios.


Conflict of interest statement

The authors declare no conflict of interest.

Figures

Fig. 1.
Fig. 1.
Fish were raised at one of three embryonic temperature (TE) treatments and then at a common postembryonic temperature until adulthood, after which they underwent one of five adult temperature treatments. Swimming performance was measured in each TE group after each adult temperature treatment. Muscle phenotype was determined in fish acclimated to 27 °C, 16 °C, and 34 °C (*). Transcriptome-wide analysis of gene expression was conducted for the 27 °C and 32 °C TE groups acclimated to 27 °C and 16 °C (). Each individual was subject to one distinct path from left to right. TE groups are offset for clarity.
Fig. 2.
Fig. 2.
(A and B) Embryonic temperature (TE) influenced aerobic swimming performance in adult zebrafish after (A) short-term temperature transfer and (B) long-term thermal acclimation. Critical swimming speed (Ucrit) was compared between fish swum at control temperature (27 °C) and fish transferred for 1 d and swum at 22 °C or 32 °C (A) or between control fish and fish acclimated for 28–30 d and swum at 16 °C or 34 °C (B). Data are means ± SEM (n = 8). Bonferroni posttests detected significant differences (P < 0.05) from Ucrit at 27 °C within each TE group [using both one- and two-factor (**) or just one (*)-factor ANOVA] and between TE groups within each swim temperature ().
Fig. 3.
Fig. 3.
Embryonic temperature influenced thermal acclimation of muscle phenotype. (A–D) The axial swimming musculature was stained for (A) slow fibers (S58 antibody), (B) intermediate fibers (alkaline-resistant myosin-ATPase activity), and (C) aerobic capacity (succinate dehydrogenase activity) to identify the three predominant fiber types (D; the blue box indicates the area of the muscle shown in AC). (Scale bar in A, 50 μm.) Serial sections of the same muscle fiber are represented with letters (s, i, f). (E) The total transverse area of axial muscle, expressed relative to body mass2/3 (mm2⋅mg−2/3) to normalize for isometric variation in body size. (F) The relative proportion of muscle area composed of slow (s, hatched) and intermediate (i, unhatched) fiber types. See Fig. 2 for statistical details.
Fig. 4.
Fig. 4.
Genes involved in energy metabolism in the swimming muscle were strongly induced by cold acclimation. (A) The expression of several transcripts changed in each Gene Ontology (GO) category that was significantly overrepresented among those transcripts that were responsive to cold. IM, intermembrane; Mito, mitochondrial. (B) Transcripts of enzymes involved in carbohydrate and lipid catabolism were generally induced by cold acclimation (blue). Transcripts for many enzymes involved in fatty acid, glucose, and glycogen synthesis did not change (white) or were repressed (orange) by cold acclimation. For some enzymes, alternate isoforms, splice variants, and/or subunits responded in opposite directions (blue and orange). Embryonic temperature (TE) also influenced the expression in the cold of several genes involved in energy metabolism (black). Enzymes are connected to represent the flux through each pathway (connections based on NADH, NADPH, ADP, or ATP are not shown).
Fig. 5.
Fig. 5.
Embryonic temperature (TE) affected the transcriptional response to cold in the swimming muscle (detected using RNA-Seq). (A) Principal components analysis identified two primary transcriptional responses to the cold, one in which each TE group responded in the same direction but by different magnitudes (principal component 1, PC1: significant effect of acclimation temperature, TA, and TA × TE interaction) and one in which TE groups responded in opposite directions (PC2: significant TA × TE interaction). (B) Representative transcripts generally differed in abundance between TE groups in a manner similar to PC1 (e.g., apooa) or PC2 (e.g., slc2a10 and fgf4). The units for these transcript abundance data are read counts normalized for differences in library size between samples. Means ± SEM (n = 4) are shown (some error bars for PC1 are too small to be seen, and the additional point for pprc1 is an outlier).

References

    1. Schulte PM, Healy TM, Fangue NA. Thermal performance curves, phenotypic plasticity, and the time scales of temperature exposure. Integr Comp Biol. 2011;51:691–702. - PubMed
    1. Anguilleta MJ. Thermal Adaptation: A Theoretical and Empirical Synthesis. Oxford, UK: Oxford Univ Press; 2009.
    1. Somero GN. Comparative physiology: A “crystal ball” for predicting consequences of global change. Am J Physiol Regul Integr Comp Physiol. 2011;301:R1–R14. - PubMed
    1. Pörtner HO, Farrell AP. Ecology. Physiology and climate change. Science. 2008;322:690–692. - PubMed
    1. Fry FEJ, Hart JS. Cruising speed of goldfish in relation to water temperature. J Fish Res Board Can. 1948;7:169–175.

Publication types

MeSH terms

LinkOut - more resources