. 2012 Aug 28;109(35):14206-11.
doi: 10.1073/pnas.1119853109. Epub 2012 Aug 13.

Thyroid hormone triggers the developmental loss of axonal regenerative capacity via thyroid hormone receptor α1 and krüppel-like factor 9 in Purkinje cells

Affiliations

Thyroid hormone triggers the developmental loss of axonal regenerative capacity via thyroid hormone receptor α1 and krüppel-like factor 9 in Purkinje cells

Hasan X Avci et al. Proc Natl Acad Sci U S A. .

Abstract

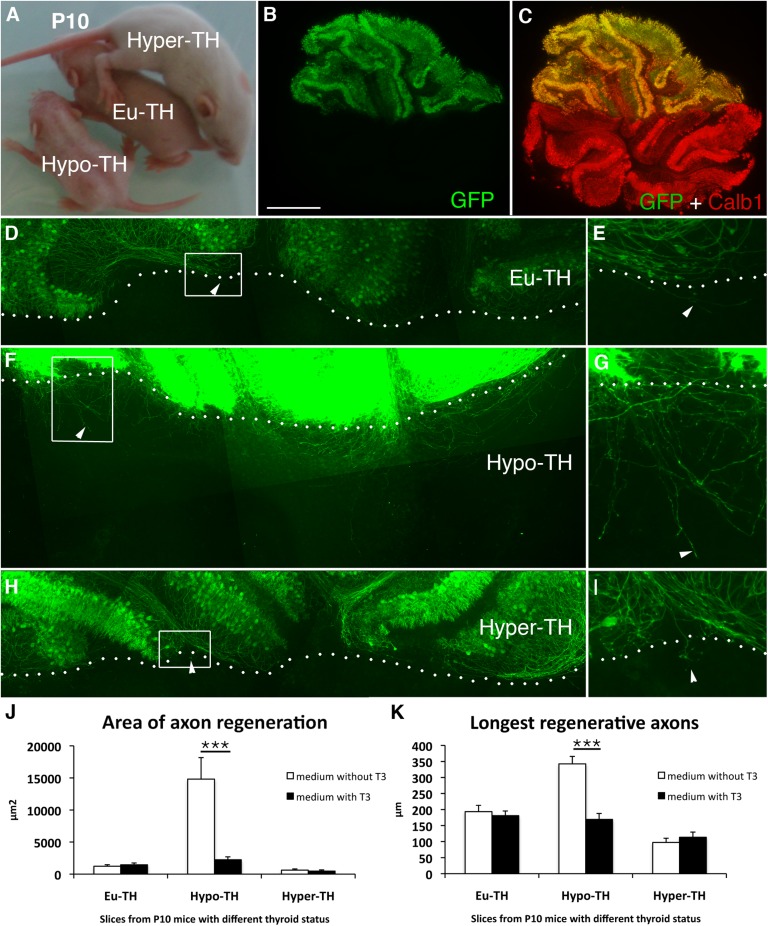
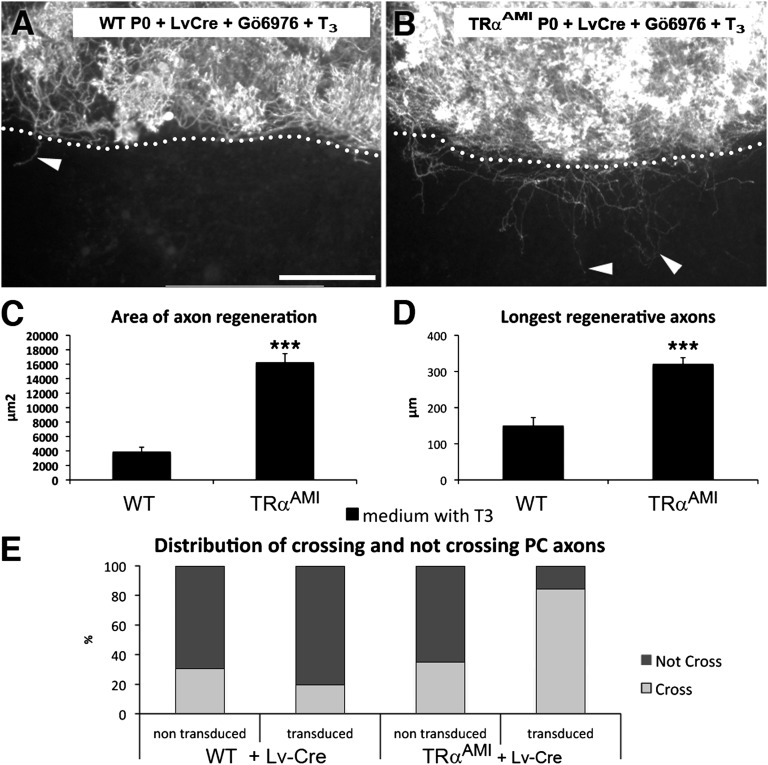
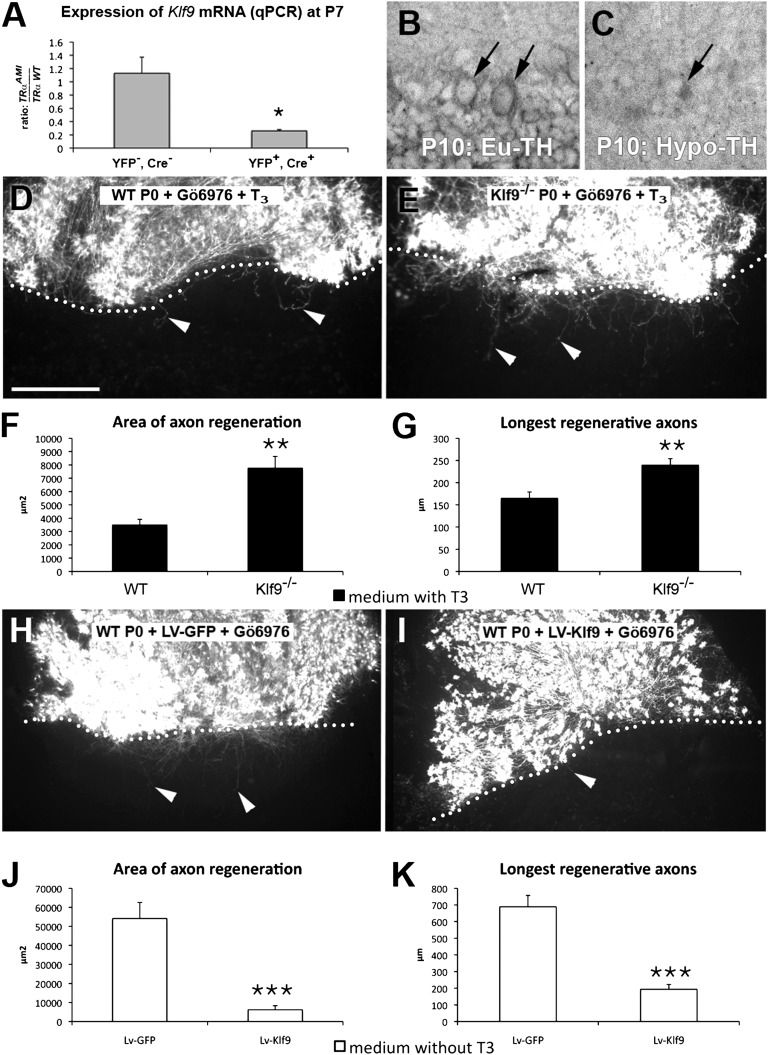
Neurons in the CNS of higher vertebrates lose their ability to regenerate their axons at a stage of development that coincides with peak circulating thyroid hormone (T(3)) levels. Here, we examined whether this peak in T(3) is involved in the loss of axonal regenerative capacity in Purkinje cells (PCs). This event occurs at the end of the first postnatal week in mice. Using organotypic culture, we found that the loss of axon regenerative capacity was triggered prematurely by early exposure of mouse PCs to T(3), whereas it was delayed in the absence of T(3). Analysis of mutant mice showed that this effect was mainly mediated by the T(3) receptor α1. Using gain- and loss-of-function approaches, we also showed that Krüppel-like factor 9 was a key mediator of this effect of T(3). These results indicate that the sudden physiological increase in T(3) during development is involved in the onset of the loss of axon regenerative capacity in PCs. This loss of regenerative capacity might be part of the general program triggered by T(3) throughout the body, which adapts the animal to its postnatal environment.


Conflict of interest statement

The authors declare no conflict of interest.

Figures

Fig. 1.
Fig. 1.
T3 accelerates the developmental loss of PC axon regenerative capacity. (A) Slice culture regeneration assay. Cerebellar slices from newborn mice (P0) were cultured, thus preserving PCs and their targets (deep cerebellar nuclei neurons) in the same slice. Axotomy (axt) was performed in vitro. After 7 div, the ventral halves containing the deep cerebellar nuclei neurons were amputated and replaced by the ventral half of a cerebellar slice taken from age-matched (P0 + 7 div) Calb1−/− mice. Hence, all Calb1-immunoreactive axons in the ventral half of the slice were regenerative axons. These slice cocultures were kept for another 7 div to allow regeneration to proceed. Photomicrographs of cocultured slices immunostained with Calb1 antibodies are shown: untreated coculture (B), T3-treated cocultures (C and E), and Gö6976-treated cocultures (D and E). The dotted lines indicate the sites of axotomy, and arrowheads show regenerating axons. Note that the axons are thicker in T3-treated cultures than in untreated cultures. (Scale bar: 475 μm.) (F and G) Quantitative analysis of regeneration in the presence and absence of T3 and Gö6976. Axotomy was always performed after 7 div. (H and I) Quantitative analysis of regeneration to determine the time dependency of the T3 effect. Axotomy was performed at various time points (0, 3, 5, 7, and 14 div). All cultures were grown in the presence of Gö6976, with (black bars) or without (white bars) T3. The area covered by Calb1+ regenerating axons (F and H) and mean length of the three longest regenerating axons in the Calb1−/− slice (G and I) are shown. Values are means ± SEM [***P < 0.001, nonparametric Kruskal–Wallis one-way ANOVA with the Mann–Whitney post hoc test (F and G) and two-way ANOVA (T3 effect and age) with post hoc protected least significant difference (PLSD) of the Fisher exact test (H and I)]. In F and G, n = 27, 27, 34, and 46 for Ctrl, T3, Gö6976, and Gö6976 + T3, respectively. In H and I, n = 24, 32, 24, 22, and 23 in the absence of T3 and n = 23, 36, 20, 21, and 22 in the presence of T3 for axotomy at 0, 3, 5, 7, and 14 div, respectively.
Fig. 2.
Fig. 2.
T3 depletion prolongs the period of developmental plasticity of PC axons. (A) To study PC regenerative capacity in P10 animals in T3-depleted conditions, we generated euthyroid (Eu-TH), hypothyroid (Hypo-TH), and hyperthyroid (Hyper-TH) pups of the L7-GFP-BAC line. Thyroid status can be detected visually: Euthyroid pups are bigger than hypothyroid pups but smaller than hyperthyroid pups. (B and C) Only half of the litter expressed GFP in all PCs when Swiss females were crossed with transgenic L7-GFP-BAC heterozygous males. The dorsal half of cerebellar slices from L7-GFP-BAC mice were cultured and apposed to the ventral half from their GFP-negative littermates. Thus, all the GFP-immunoreactive axons present in the ventral half were regenerative PC axons. The ventral half was visualized by immunostaining with anti-Calb1 antibodies (C). Photomicrographs of euthyroid (D and E), hypothyroid (F and G), and hyperthyroid (H and I) cocultures. E, G, and I are magnified views of D, F, and H, respectively. The arrowheads indicate regenerating axons, and the dotted lines indicate the sites of axotomy. Quantitative analysis of the area of axon regeneration (J) and the longest regenerative axons (K) is shown. The cocultures were grown in the presence (black bars) or absence (white bars) of T3. Values are means ± SEM (***P < 0.001, Kruskal–Wallis test with Mann–Whitney post hoc test). (Scale bar: B and C, 450 μm; D, F, and H, 240 μm; E, G, and I, 80 μm.) n = 17, 18, and 17 for Eu-TH, Hypo-TH, and Hyper-TH, and n = 15, 18, and 17 in the presence of T3 for Eu-TH, Hypo-TH, and Hyper-TH, respectively.
Fig. 3.
Fig. 3.
TRα1 mediates the T3-induced loss of PC regenerative capacity. Photomicrographs of newborn mouse (P0) cocultured slices transduced with Lv encoding the Cre recombinase (LvCre) and immunostained with anti-Calb1 antibodies: slices from WT (A) and TRαAMI (B) mouse lines. The dotted lines indicate the site of axotomy, and the arrowheads point to regenerating axons. (Scale bar: 240 μm.) Quantitative analysis of PC axon regeneration: area of axon regeneration (C) and longest regenerative axons (D). All cultures were grown in the presence of Gö6976 at the time of axotomy to increase PC survival. Values from WT and TRαAMI animals are plotted as the mean ± SEM (***P < 0.001, Mann–Whitney test). n = 14 WT and 66 TRαAMI. (E) Distribution of crossing and noncrossing PC axons (Fig. S4 C and I). The histogram illustrates percentages of PCs transduced or nontransduced with Lv-Cre on WT or TRαAMI slices that either cross or do not cross the site of axotomy. The frequency distribution of sections in the four groups was compared between the various experimental conditions using the Fisher exact test (***P < 0.001). WT: n = 32 nontransduced, n = 15 transduced; TRαAMI: n = 66 nontransduced, n = 77 transduced.
Fig. 4.
Fig. 4.
KLF9 reduces the capacity of PCs to regenerate their axons. (A) Graphic representation of Klf9 mRNA expression in the cerebellum at P7. Shown here is the ratio of Klf9 expression in TRαAMI/+ and TRα WT (TRα WT) mice, both in a ROSA26-lox-STOP-lox-EYFP (R26YFP)/+; Ptf1aCre/+ background. The left bar represents YFP cells (granule cells and other cell types), and the right bar represents YFP+ cells (PCs and interneurons; a description of the experiment is provided in Fig. S5). When TRα1L400R is expressed in PCs, the Klf9 mRNA level is reduced by fourfold compared with WT (*P < 0.05, Mann–Whitney test). Photomicrographs of in situ hybridization of euthyroid (Eu-TH; B) and hypothyroid (Hypo-TH; C) sections from P10 mice with a Klf9 probe; the arrows point to the PC layers. Photomicrographs of newborn WT (D) and Klf9−/− mouse (E) dorsal slices apposed to Calb1−/− ventral slices, cultured in the presence of T3, and immunostained with anti-Calb1 antibodies are shown. Quantitative analysis of the area of axon regeneration (F) and the longest regenerative axons (G) is shown. Photomicrographs of dorsal cerebellar slices transduced with GFP-expressing Lv (LV-GFP; H) or KLF9-expressing Lv (LV-KLF9; I), apposed to Calb1−/− ventral slices cultured in the absence of T3, and immunostained with anti-Calb1 antibodies are shown. Quantitative analysis of the area of axon regeneration (J) and the longest regenerative axons (K) is shown. The dotted lines indicate the site of axotomy, and the arrowheads point to regenerating axons. Black bars represent cultures grown in the presence of T3, and white bars represent those grown in the absence of T3. All cultures were grown in the presence of Gö6976 at the time of axotomy to increase PC survival. (Scale bars: B and C, 60 μm; D, E, H, and I, 240 μm.) Values are means ± SEM (**P < 0.01, ***P < 0.001 Mann–Whitney test). n = 32 WT, 41 KO, 14 Lv-GFP, and 13 Lv-KLF9.

References

    1. Schwab ME, Bartholdi D. Degeneration and regeneration of axons in the lesioned spinal cord. Physiol Rev. 1996;76:319–370. - PubMed
    1. Schwab ME. Nogo and axon regeneration. Curr Opin Neurobiol. 2004;14(1):118–124. - PubMed
    1. He Z, Koprivica V. The Nogo signaling pathway for regeneration block. Annu Rev Neurosci. 2004;27:341–368. - PubMed
    1. Cai D, et al. Neuronal cyclic AMP controls the developmental loss in ability of axons to regenerate. J Neurosci. 2001;21:4731–4739. - PMC - PubMed
    1. Moore DL, et al. KLF family members regulate intrinsic axon regeneration ability. Science. 2009;326:298–301. - PMC - PubMed

Publication types

MeSH terms

Substances

LinkOut - more resources