. 2012 Sep 18;84(18):7684-91.
doi: 10.1021/ac300628s. Epub 2012 Aug 27.

Pressure-assisted capillary electrophoresis coupling with matrix-assisted laser desorption/ionization-mass spectrometric imaging for quantitative analysis of complex peptide mixtures

Affiliations

Pressure-assisted capillary electrophoresis coupling with matrix-assisted laser desorption/ionization-mass spectrometric imaging for quantitative analysis of complex peptide mixtures

Zichuan Zhang et al. Anal Chem. .

Abstract

Herein, we report a pressure-assisted capillary electrophoresis-mass spectrometric imaging (PACE-MSI) platform for peptide analysis. This new platform has addressed the sample diffusion and peak splitting problems that appeared in our previous groove design, and it enables homogeneous deposition of the CE trace for high-throughput MALDI imaging. In the coupling of CE to MSI, individual peaks (m/z) can be visualized as discrete colored image regions and extracted from the MS imaging data, thus eliminating issues with peak overlapping and reducing reliance on an ultrahigh mass resolution mass spectrometer. Through a PACE separation, 46 tryptic peptides from bovine serum albumin and 150 putative neuropeptides from the pericardial organs of a model organism blue crab Callinectes sapidus were detected from the MALDI MS imaging traces, enabling a 4- to 6-fold increase of peptide coverage as compared with direct MALDI MS analysis. For the first time, quantitation with high accuracy was obtained using PACE-MSI for both digested tryptic peptides and endogenous neuropeptides from complex biological samples in combination with isotopic formaldehyde labeling. Although MSI is typically employed in tissue imaging, we show in this report that it offers a unique tool for quantitative analysis of complex trace-level analytes with CE separation. These results demonstrate a great potential of the PACE-MSI platform for enhanced quantitative proteomics and neuropeptidomics.


Figures

Figure 1
Figure 1. The setup of the pressure-assisted capillary electrophoresis coupled to mass spectrometric imaging (PACE-MSI) interface
Matrix flow is controlled by a syringe pump and delivered at a flow rate of 700 nL/min. CE flow rate is determined by the electroosmotic flow as well as height difference between capillary inlet and outlet along y-axis. Matrix and CE fraction are mixed at the tips of two capillaries, and collected immediately on the surface of the ground stainless steel MALDI plate. The MALDI plate is controlled mechanically and moves along the x-axis to the direction shown with arrow. A straight and uniform trace is deposited on the MALDI plate and is further analyzed by MALDI MS imaging.
Figure 2
Figure 2. The PACE-MSI interface and mixed trace on the MALDI sample plate
A: CE flow and matrix flow are delivered separately and mixed at the capillary tips on the surface of a ground stainless steel MALDI plate. B and C: a 1:1 labeled peak pair at m/z 1356.6/1360.6 with identical peak intensities and migrations are observed in MS imaging when coupled with PACE.
Figure 3
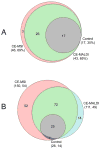
Figure 3. Comparison of the number of peptides detected via MALDI MS by PACE-MSI, regular CE and un-separated control sample
A: Number of BSA tryptic peptides detected in the mass range from m/z 500 to 2500. The performance is shown as numbers of peptide detected and protein sequence coverage in the parentheses. B: Number of putative neuropeptides from the blue crab PO detected in the mass range from m/z 500 to 2500. The performance is shown as the number of peptides detected and the number of peptides previously identified in parentheses.
Figure 4
Figure 4. PACE-MSI analysis of peak pair M/Z 1356.6/1360.6 from complex neuropeptide extracts of the blue crab PO
A: Mass spectrum of the blue crab PO extract by direct MALDI MS analysis. A zoom-in inset showed peak pair m/z 1356.6/1360.6. B: Images of mass range m/z 1356.1–1357.1, with two regions being highlighted with white boxes. The two regions were separated from each other and exhibited significantly different signal intensities. C and D: Mass spectra corresponding to each region. Two different peak pairs, including m/z 1356.6/1360.6 and m/z 1356.7/1364.7, were detected from each region.
Figure 5
Figure 5. PACE-MSI analysis of mass range M/Z 1320 to 1335 from complex neuropeptide extracts from the blue crab PO
A: Mass spectrum of the blue crab PO extract by direct MALDI MS analysis. A zoom-in inset showed mass range 1320–1335 with peak pairs at m/z 1321.7/1325.7 and m/z 1330.7/1334.7 which were difficult to differentiate. B–E: By scanning the MS images of mass range m/z 1320 to 1335 with PACE-MSI, four neuropeptides as reflected in different image regions were observed with their corresponding mass spectra shown. They were well-separated with enhanced MS signals, and were accurately quantified with light: heavy labeled peak ratios around 1:1.

Similar articles

Cited by

References

    1. Gatlin CL, Eng JK, Cross ST, Detter JC, Yates JR. Anal Chem. 2000;72:757–763. - PubMed
    1. Wang T, Ma J, Zhu G, Shan Y, Liang Z, Zhang L, Zhang Y. J Sep Sci. 2010;33:3194–3200. - PubMed
    1. Perry M, Li Q, Kennedy RT. Anal Chim Acta. 2009;653:1–22. - PMC - PubMed
    1. Fang X, Wang W, Yang L, Chandrasekaran K, Kristian T, Balgle BM, Lee CS. Electrophoresis. 2008;29:2215–2223. - PMC - PubMed
    1. Lapainis T, Sweedler JV. J Chromatogr A. 2008;1184:144–158. - PubMed

Publication types