. 2012 Nov;92(5):1069-81.
doi: 10.1189/jlb.0112014. Epub 2012 Aug 14.

Staphylococcus aureus Panton-Valentine leukocidin induces an inflammatory response in human phagocytes via the NLRP3 inflammasome

Affiliations

Staphylococcus aureus Panton-Valentine leukocidin induces an inflammatory response in human phagocytes via the NLRP3 inflammasome

Dirk Holzinger et al. J Leukoc Biol. 2012 Nov.

Abstract

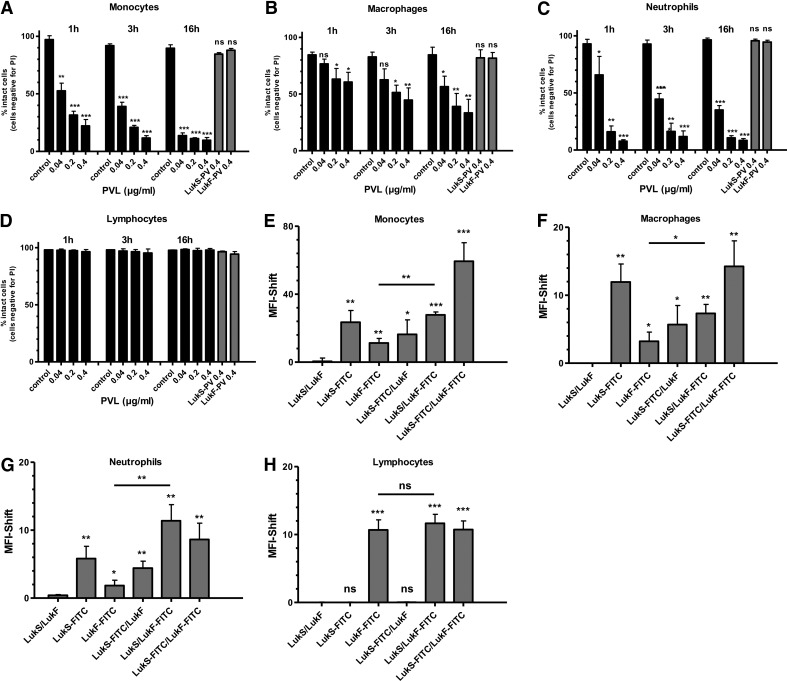
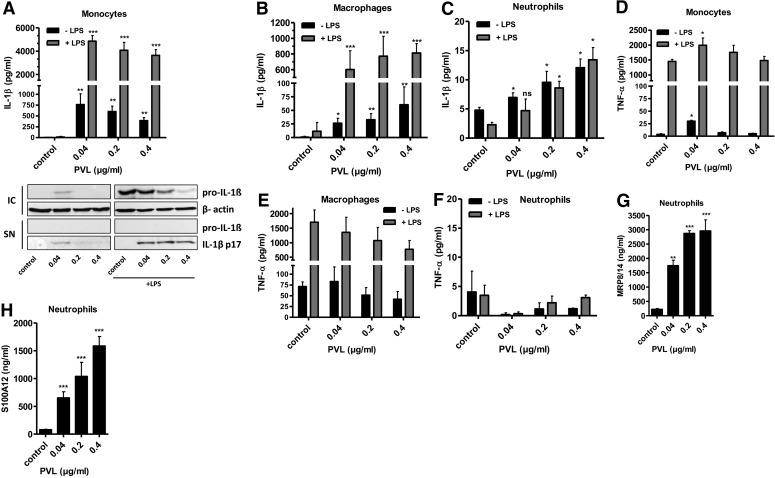
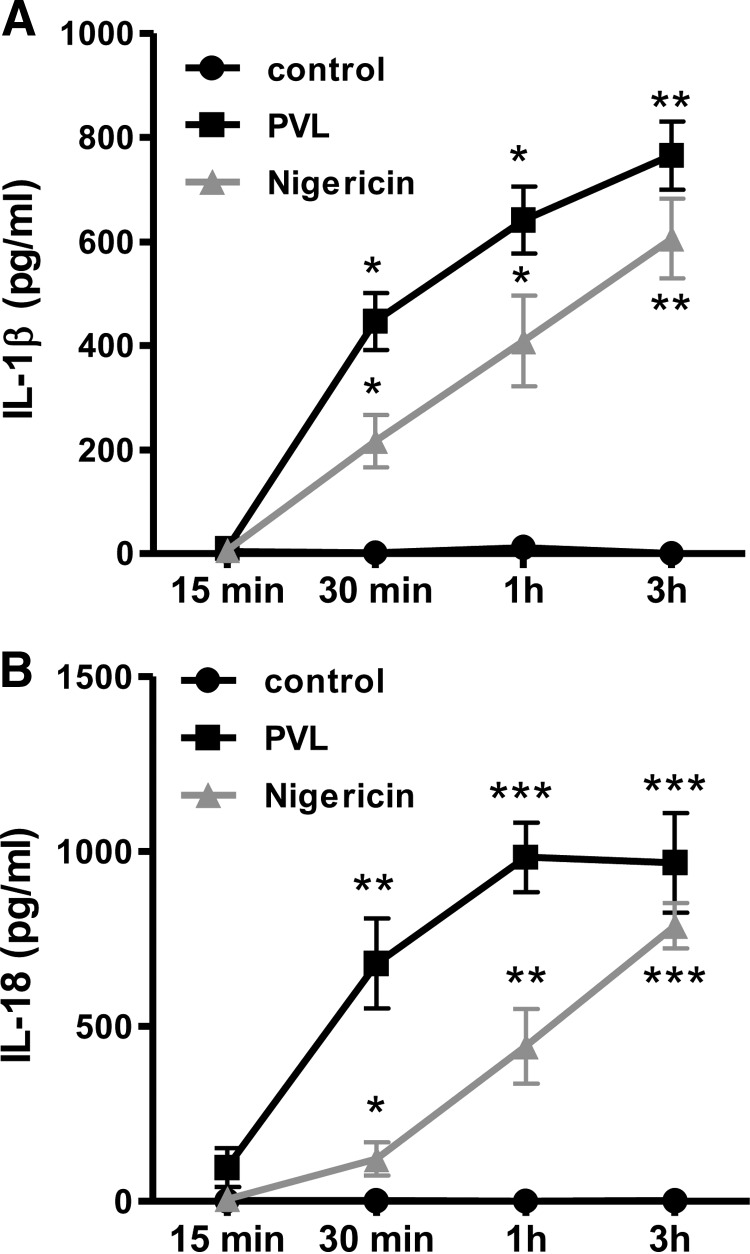
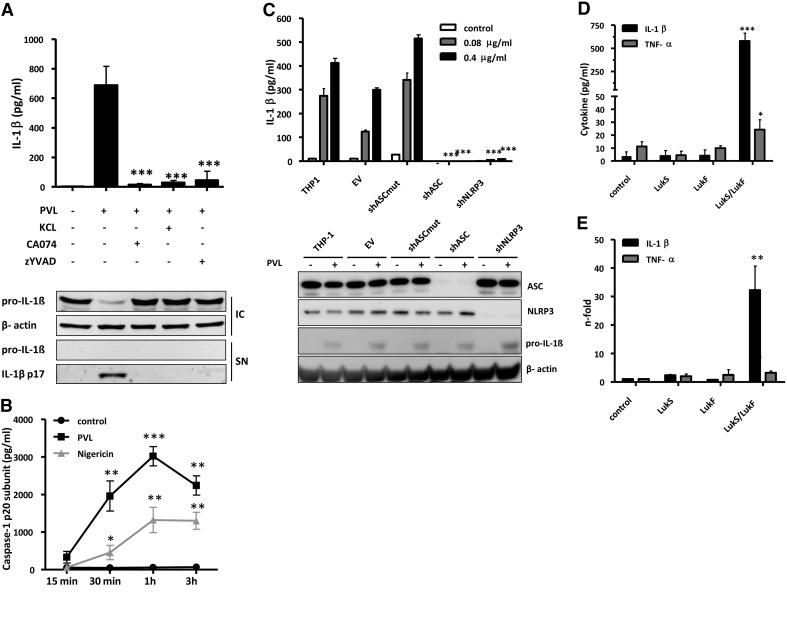
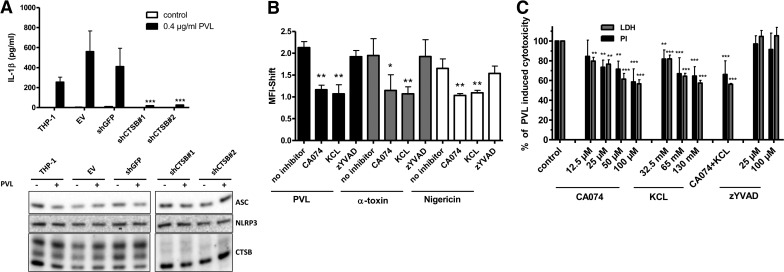
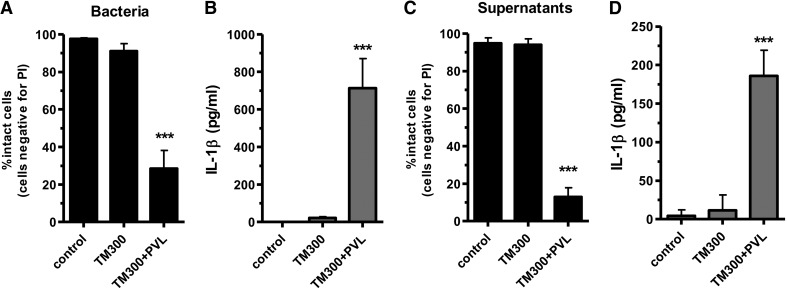
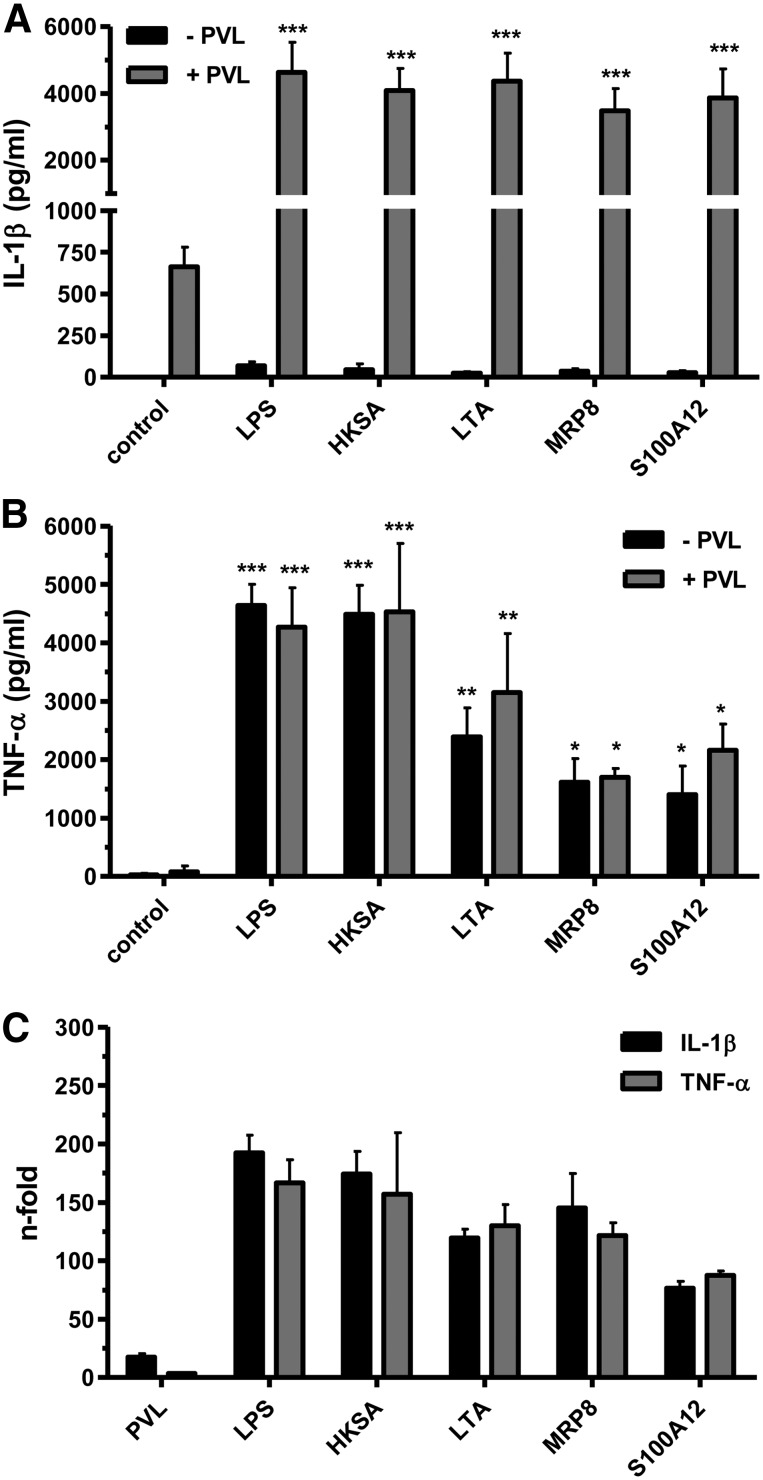
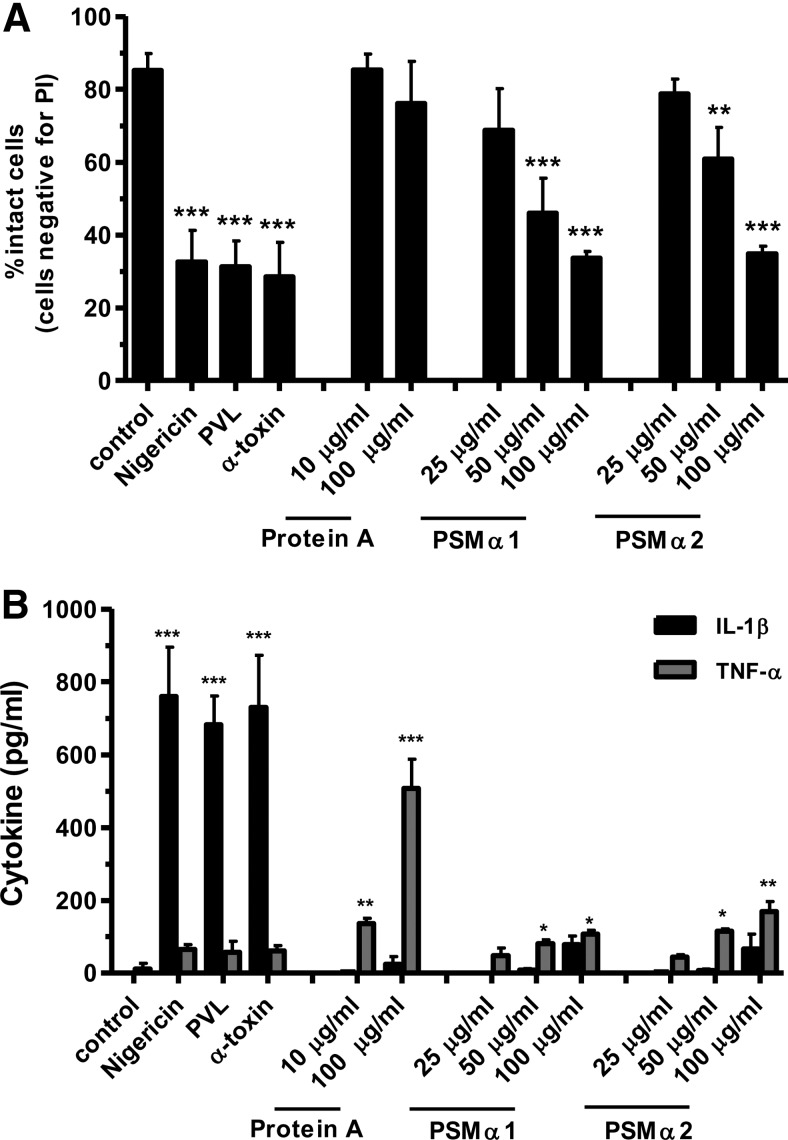
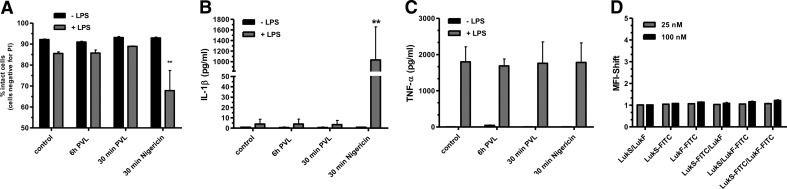
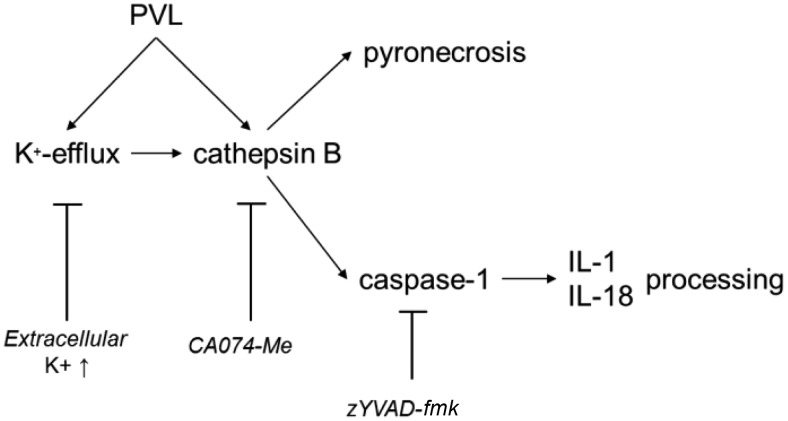
The Staphylococcus aureus pore-forming toxin PVL is most likely causative for life-threatening necrotizing infections, which are characterized by massive tissue inflammation and necrosis. Whereas the cytotoxic action of PVL on human neutrophils is already well established, the PVL effects on other sensitive cell types, such as monocytes and macrophages, are less clear. In this study, we used different types of human leukocytes (neutrophils, monocytes, macrophages, lymphocytes) to investigate cell-specific binding of PVL subunits and subsequent proinflammatory and cytotoxic effects. In all PVL-sensitive cells, we identified the binding of the subunit LukS-PV as the critical factor for PVL-induced cytotoxicity, which was followed by binding of LukF-PV. LukS-PV binds to monocytes, macrophages, and neutrophils but not to lymphocytes. Additionally, we showed that PVL binding to monocytes and macrophages leads to release of caspase-1-dependent proinflammatory cytokines IL-1β and IL-18. PVL activates the NLRP3 inflammasome, a signaling complex of myeloid cells that is involved in caspase-1-dependent IL-1β processing in response to pathogens and endogenous danger signals. Specific inhibition of this pathway at several steps significantly reduced inflammasome activation and subsequent pyronecrosis. Furthermore, we found that PAMPs and DAMPs derived from dying neutrophils can dramatically enhance this response by up-regulating pro-IL-1β in monocytes/macrophages. This study analyzes a specific host signaling pathway that mediates PVL-induced inflammation and cytotoxicity, which has high relevance for CA-MRSA-associated and PVL-mediated pathogenic processes, such as necrotizing infections.


Figures

Figure 1.
Figure 1.. Cytolytic effects and binding of purified PVL to human leukocytes.
Primary blood-derived monocytes (A), macrophages (B), neutrophils (C), and lymphocytes (D; 1×106×0.5 ml−1 cells) were incubated with increasing doses of PVL [0.04–0.4 μg/ml (1–10 nM)]. Cells were stimulated for 1, 3, or 16 h, respectively, or with LukS-PV and LukF-PV for 16 h and then were washed and stained with PI, and cell death was measured by flow cytometry. Statistical differences between control and stimulated cells were determined by Student's t test. Leukocytes [monocytes (E), macrophages (F), neutrophils (G) and lymphocytes (H)] (1×106×0.5 ml−1 cells) were incubated with untreated and FITC-conjugated LukS and/or LukF (1.0 μg/ml) for 1 h and washed, and binding of toxin was quantified by flow cytometry. Rate of binding was calculated by the MFI shift between untreated control cells and toxin-treated cells. The values represent the mean ± sd of at least three independent experiments. Statistical differences were determined by ANOVA comparing the MFI between control and treated cells (*P≤0.05; **P≤0.01; ***P≤0.001).
Figure 2.
Figure 2.. Human phagocytes respond to PVL by IL-1β secretion and release of DAMPs.
Primary monocytes (A and D), macrophages (B and E), and neutrophils (C and F–H; 1×106×0.5 ml−1 cells) were incubated with PVL (0.04–0.4 μg/ml) for 3 h. Ultrapure LPS (100 ng/ml) was used as a costimulant for the primary cells and was added 30 min before PVL treatment. Concentrations of IL-1β, TNF-α, MRP8/14, and S100A12 were subsequently determined from cell culture supernatants. The inset in A verifies the presence of mature 17 kDa IL-1β and absence of pro-IL-1β in cell culture supernatants (SN) of primary monocytes, as well as the induction of intracellular pro-IL-1β (IC) by Western blotting. The values represent the means ± sd from at least three experiments. Statistical differences were determined by Student's t test (*P≤0.05; **P≤0.01; ***P≤0.001 compared with untreated cells).
Figure 3.
Figure 3.. PVL induces a quick secretion of inflammasome-dependent proteins IL-1β and IL-18.
Primary monocytes (1×106×0.5 ml−1 cells) were incubated with 0.04 μg/ml PVL for the indicated time-points; the K+-ionophore nigericin (20 μM) served as a positive control. Release of IL-1β (A) and IL-18 (B) was quantified by ELISA in the supernatants. The values represent the means ± sd from at least three experiments. Statistical differences were determined by Student's t test. (*P≤0.05; **P≤0.01; ***P≤0.001 compared with untreated cells).
Figure 4.
Figure 4.. Mechanism of PVL-induced IL-1β secretion.
Primary monocytes (1×106×0.5 ml−1 cells; A) were incubated with 0.04 μg/ml PVL in the absence or presence of KCl (130 mM), CTSB inhibitor CA-074Me (30 μM), or caspase-1 inhibitor zYVAD-fmk (25 μM). After the incubation, IL-1β (average response to PVL, 690 pg/ml) was analyzed by ELISA. The values represent the means ± sd from at least three experiments. The inset in A verifies the inhibition of processing and secretion of mature 17 kDa IL-1β and the absence of pro-IL-1β in cell culture supernatants of LPS-primed primary monocytes (5×106×2.5 ml−1 cells) and the presence of intracellular pro-IL-1β by Western blotting. Statistical differences were determined by ANOVA comparing PVL-treated cells with PVL-treated cells + inhibitors (***P≤0.001). Further, cells were treated with PVL (0.04 μg/ml), and p20 caspase-1 subunit was analyzed by ELISA in the supernatant after different time-points; the K+-ionophore nigericin (20 μM) served as a positive control. Statistical differences were determined by Student's t test (*P≤0.05; **P≤0.01; ***P≤0.001 compared with untreated cells; B). THP-1-derived cell lines (C) stably transduced with shRNA expressing retrovirus were treated with 0.08 or 0.4 μg/ml PVL, and cell culture supernatants were analyzed for IL-1β after 24 h. The shRNAs are directed to knock down expression as follows: EV, negative control; shASCmut, negative control; shASC, shRNA directed against ASC protein; shNLRP3, shRNA directed against NLRP3. Knockdown of ASC and NLRP3 and expression of pro-IL-1β were confirmed by Western blot. Results represent the means ± sd of triplicate wells and are representative of three independent experiments. Primary monocytes (5×106×2.5 ml−1 cells) were treated with LukS or LukF or both for 3 h, and cell culture supernatants were analyzed for IL-1β or TNF-α (D). Induction of IL-1β and TNF-α RNA was determined by RT-PCR (E) and expressed as n-fold compared with untreated control. The values represent the means ± sd from at least three experiments. Statistical differences were determined by ANOVA comparing PVL-treated cells to control (*P≤0.05; **P≤0.01; ***P≤0.001).
Figure 5.
Figure 5.. PVL-mediated K+-efflux leads to CTSB activation and pyronecrosis.
THP-1-derived cell lines (A), stably transduced with shRNA expressing retrovirus, were treated with 0.4 μg/ml PVL, and cell culture supernatants were analyzed for IL-1β after 24 h. The shRNAs are directed to knockdown expression as follows: EV, negative control; shGFP, negative control; shCTSB#1 and #2, two shRNAs directed against CTSB. Knockdown of CTSB and the presence of ASC and NLRP3 were confirmed by Western blot. Results represent the means ± sd of triplicate wells and are representative of three independent experiments. Statistical differences were determined by ANOVA comparing knockdown cells with control (***P≤0.001). CTSB activity was measured via degradation of the fluorescent Magic Red CTSB substrate (ImmunoChemistry Technology). Magic Red CTSB substrate was added to primary monocytes (1×106×0.5 ml−1 cells) treated with PVL (0.4 μg/ml), α-toxin (10 μg/ml), or nigericin (20 μM) for 15 min, with or without pretreatment with KCl (130 mM), CA-074Me (30 μM), or zYVAD-fmk (25 μM) (B). Degradation of the Magic Red substrate was measured via flow cytometry on a BD FACSCalibur. Analysis of the data was accomplished with detection of the optimal Magic Red substrate fluorescence emission in fluorescence-2 on a logarithmic scale. The values represent the means ± sd from three experiments. Statistical differences were determined by ANOVA comparing the MFI between control and treated cells (*P≤0.05; **P≤0.01). Primary monocytes (1×106×0.5 ml−1 cells; C) were incubated with 0.04 μg/ml PVL for 3 h in the absence or presence of CTSB inhibitor CA-074Me (12.5–100 μM), KCl (32.5–130 mM), or caspase-1 inhibitor zYVAD-fmk (25 or 100 μM). LDH was measured in the supernatants, and cells were washed and stained with PI. The values represent the means ± sd from at least three experiments. Statistical differences were determined by ANOVA comparing PVL-treated cells with PVL-treated cells + inhibitors (**P≤0.01; ***P≤0.001).
Figure 6.
Figure 6.. The cytotoxic effect and induction of IL-1β secretion of TM300 and its supernatant are dependent on PVL expression.
Primary monocytes (5×106×2.5 ml−1 cells) were incubated with 10 MOI of bacteria (A and B) for 3 h or for 1 h with bacterial supernatants (C and D), which were prepared from overnight cultures and used for stimulating cells (10% vol/vol) or were left untreated. In this experiment, the heterologous expression strain TM300 + PVL and its WT strain were used. After incubation of the cells with bacterial supernatants or whole bacteria, cells were washed and stained with PI for analysis by flow cytometry. IL-1β was measured in the cell supernatants by ELISA. The values represent the means ± sd of at least three independent experiments. Statistical differences were determined by Student's t test (***P≤0.001 compared with TM300).
Figure 7.
Figure 7.. Costimulation with PAMPs and DAMPs increases PVL-induced IL-1β secretion.
Primary monocytes (1×106×0.5 ml−1 cells) were incubated with 0.04 μg/ml PVL for 3 h or were left untreated. Ultrapure LPS (100 ng/ml), HKSA (100 MOI), and LTA (10 μg/ml) were used as costimulatory PAMPs, and MRP8 and S100A12 (each 5 μg/ml) served as DAMPs and were added 30 min before PVL treatment, or cells were left untreated as controls. After incubation, cell culture supernatants were analyzed for IL-1β (A) or TNF-α (B). Statistical differences were determined by ANOVA (*P≤0.05; **P≤0.01; ***P ≤0.001 compared with controls). Furthermore, primary monocytes (5×106×2.5 ml−1 cells) were treated with the above-mentioned PAMPs and DAMPS or PVL (0.04 μg/ml), and induction of IL-1β and TNF-α RNA was determined by RT-PCR (C) and expressed as n-fold compared with untreated controls.
Figure 8.
Figure 8.. Induction of IL-1β and TNF-α secretion by staphylococcal components.
Primary monocytes (1×106×0.5 ml−1 cells) were incubated with PVL (0.04 μg/ml), α-toxin (10 μg/ml), Protein A (10 and 100 μg/ml), and PSMα1 and -2 (25–100 μg/ml) for 3 h or were left untreated; the K+-ionophore nigericin (20 μM) served as positive control. After incubation, cells were washed and stained with PI for flow cytometry (A), and cell culture supernatants were analyzed for IL-1β or TNF-α by ELISA (B). The values represent the means ± sd from at least three experiments. Statistical differences were determined by ANOVA (*P≤0.05; **P≤0.01; ***P≤0.001 compared with control).
Figure 9.
Figure 9.. PVL has no effect on murine BMDMs.
BMDMs were prestimulated with ultrapure LPS (1 μg/ml) for 6 h and then incubated further with PVL (4 μg/ml) for 30 min or costimulated for 6 h with LPS and PVL. Thirty minutes of treatment with nigericin served as a positive control. After incubation, cells were washed and stained with PI (A), and cell culture supernatants were analyzed for IL-1β (B) or TNF-α (C) by CBA. The values represent the means ± sd from at least three experiments. Statistical differences were determined by ANOVA (**P≤0.01 compared with control). BMDMs were incubated with unlabeled and FITC-conjugated LukS and/or LukF (1.0 or 4.0 μg/ml) for 1 h and washed, and binding of toxin was quantified by flow cytometry. Rate of binding was calculated by the MFI shift between untreated control cells and toxin-treated cells. The values represent the mean ± sd of at least three independent experiments (D).
Figure 10.
Figure 10.. Proposed mechanism of PVL-induced inflammasome activation.
PVL leads to K+-efflux and CTSB activation, which consecutively activates the inflammasome and induces pyronecrosis. Activated caspase-1 processes IL-1β and IL-18. All steps can be blocked by specific inhibitors.

Similar articles

Cited by

References

    1. Lowy F. D. (1998) Staphylococcus aureus infections. N. Engl. J. Med. 339, 520–532 - PubMed
    1. Gordon R. J., Lowy F. D. (2008) Pathogenesis of methicillin-resistant Staphylococcus aureus infection. Clin. Infect. Dis. 46 (Suppl. 5), S350–S359 - PMC - PubMed
    1. Bhakdi S., Martin E. (1991) Superoxide generation by human neutrophils induced by low doses of Escherichia coli hemolysin. Infect. Immun. 59, 2955–2962 - PMC - PubMed
    1. Woodin A. M. (1960) Purification of the two components of leucocidin from Staphylococcus aureus. Biochem. J. 75, 158–165 - PMC - PubMed
    1. Kaneko J., Kamio Y. (2004) Bacterial two-component and hetero-heptameric pore-forming cytolytic toxins: structures, pore-forming mechanism, and organization of the genes. Biosci. Biotechnol. Biochem. 68, 981–1003 - PubMed

Publication types

MeSH terms