. 2012 Sep 1;26(17):1945-58.
doi: 10.1101/gad.193458.112. Epub 2012 Aug 14.

The intermediate-activity (L597V)BRAF mutant acts as an epistatic modifier of oncogenic RAS by enhancing signaling through the RAF/MEK/ERK pathway

Affiliations

The intermediate-activity (L597V)BRAF mutant acts as an epistatic modifier of oncogenic RAS by enhancing signaling through the RAF/MEK/ERK pathway

Catherine Andreadi et al. Genes Dev. .

Abstract

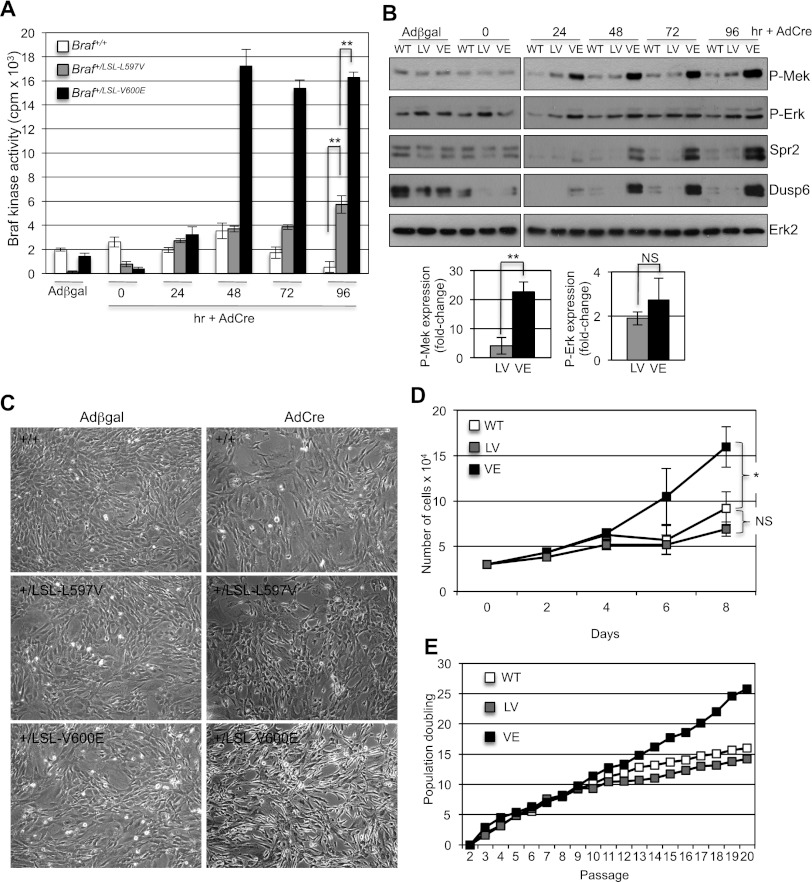
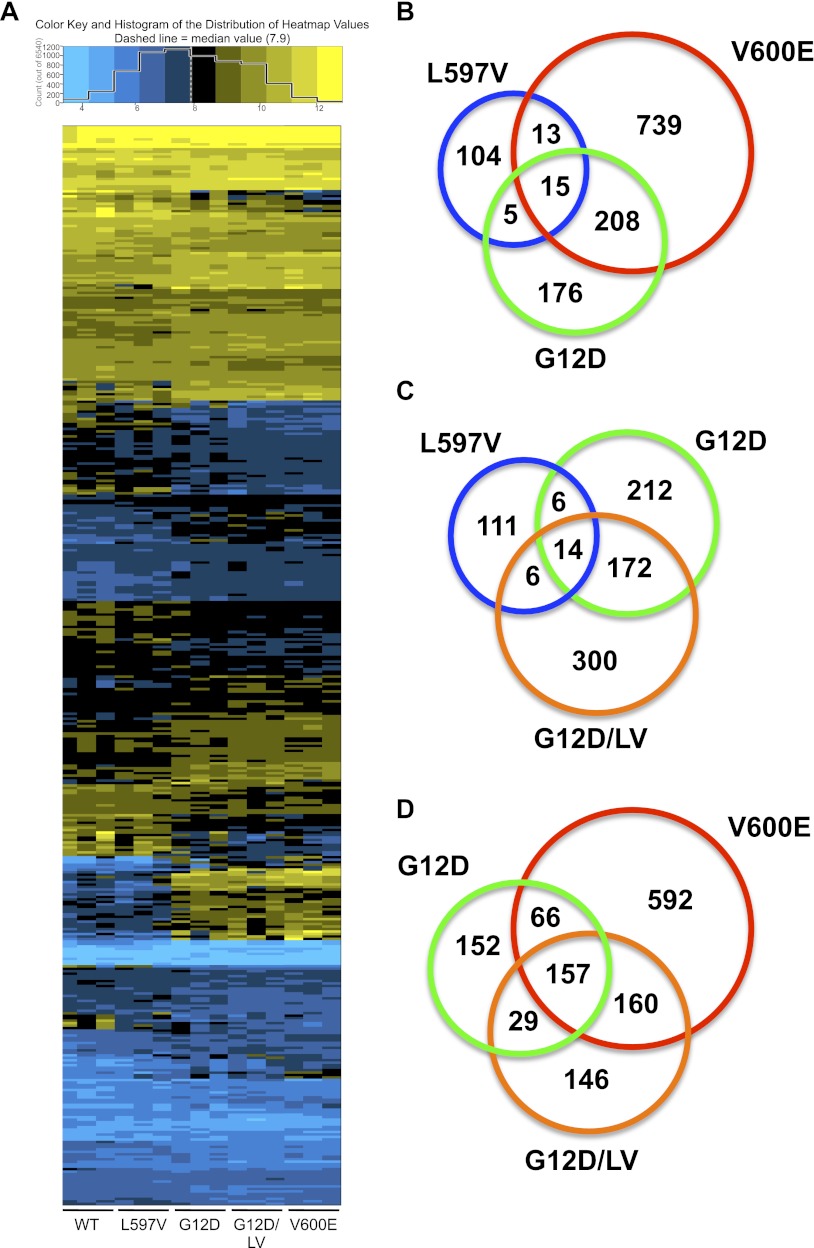
(L597V)BRAF mutations are acquired somatically in human cancer samples and are frequently coincident with RAS mutations. Germline (L597V)BRAF mutations are also found in several autosomal dominant developmental conditions known as RASopathies, raising the important question of how the same mutation can contribute to both pathologies. Using a conditional knock-in mouse model, we show that endogenous expression of (L597V)Braf leads to approximately twofold elevated Braf kinase activity and weak activation of the Mek/Erk pathway. This is associated with induction of RASopathy hallmarks including cardiac abnormalities and facial dysmorphia but is not sufficient for tumor formation. We combined (L597V)Braf with (G12D)Kras and found that (L597V)Braf modified (G12D)Kras oncogenesis such that fibroblast transformation and lung tumor development were more reminiscent of that driven by the high-activity (V600E)Braf mutant. Mek/Erk activation levels were comparable with those driven by (V600E)Braf in the double-mutant cells, and the gene expression signature was more similar to that induced by (V600E)Braf than (G12D)Kras. However, unlike (V600E)Braf, Mek/Erk pathway activation was mediated by both Craf and Braf, and ATP-competitive RAF inhibitors induced paradoxical Mek/Erk pathway activation. Our data show that weak activation of the Mek/Erk pathway underpins RASopathies, but in cancer, (L597V)Braf epistatically modifies the transforming effects of driver oncogenes.


Figures

Figure 1.
Figure 1.
L597VBraf-expressing mice show RASopathy phenotypes. (A) Schematic of the gene-targeting event. The Lox–Stop–Lox (LSL) targeting vector was assembled with mouse Braf exon 15 containing the C1789A mutation and minigene Braf cDNA exons 15–18 (gray box). Splice acceptor (SA) and polyadenylation (pA) sequences were cloned on either side of the minigene. Cre recombinase induces deletion of the LSL cassette flanked by LoxP sequences (large black arrows), allowing expression of L597VBraf from the BrafLox-L597V allele.(A–C) PCR primers to detect wild-type, Lox, and LSL alleles are indicated (small black arrows). (B) Survival of littermate Braf+/+ (+/+) and Braf+/Lox-L597V (+/LV) mice containing the CMV-Cre transgene. (C) Weight comparisons of littermate +/+ and +/LV mice with the CMV-Cre transgene. (D) Gross appearance of 3-mo-old +/+ and +/LV female mice. (E) Gross facial appearance of 3-mo-old +/+ and +/LV female mice illustrating the blunt nose of mutant animals (arrowhead). (F) Enlarged heart. H&E-stained cross-sections of hearts of 3-mo-old mice are shown. Bars, 2 mm. The bar chart indicates the heart weight/body weight ratio of 3-mo-old +/+ (n = 6) and +/LV (n = 3) mice. (*) P < 0.01, Student's t-test. (G) Wheat germ agglutinin-stained cross-sections of cardiomyocytes. Bars, 100 μm. Cross-sectional areas were measured (n = 3 samples per genotype, with 100 cells counted per sample), and the average areas are given below for each genotype.
Figure 2.
Figure 2.
Characterization of MEFs expressing L597VBraf. (A) Braf kinase assays of soluble protein lysates taken from Braf+/+, Braf+/LSL-L597V, and Braf+/LSL-V600E MEFs treated with AdCre for 0–96 h or Adβgal for 96 h. Columns indicate the mean of three samples, and bars indicate the SD. (B) Western blot analysis of protein lysates from Braf+/+, Braf+/LSL-L597V, and Braf+/LSL-V600E MEFs treated with AdCre for 0–96 h or Adβgal for 96 h. Western blots were analyzed with the antibodies indicated. Quantification of Western blot analysis of Mek/Erk phosphorylation for the 96-h time point is shown in the graphs below. P-Mek and P-Erk levels were normalized to Erk2, the fold changes compared with AdCre-infected wild-type (WT) cells are shown, and error bars indicate the SEM. Data were pooled from three MEFs with the same genotype. (C) Representative photographs of Braf+/+, Braf+/LSL-L597V, and Braf+/LSL-V600E MEFs treated with AdCre or Adβgal for 96 h. (D) Growth curves of primary Braf+/+ (wild-type), Braf+/Lox-L597V (LV), and Braf+/Lox-V600E (VE) MEFs over 8 d immediately following 72 h of treatment with AdCre. Mean values of three technical replicates of MEFs of each genotype are shown, and error bars indicate the SEM. These are representative profiles of four different MEFs of each genotype. (E) 3T3 immortalization profiles of primary Braf+/+ (wild-type), Braf+/LSL-L597V (LV), and Braf+/LSL-V600E (VE) MEFs treated with AdCre. Representative profiles of three different MEF lines of each genotypes are shown. For all data, P-values were calculated using the Student's t-test; (*) P < 0.01; (**) P < 0.005; (NS) not significant.
Figure 3.
Figure 3.
Analysis of L597VBraf-expressing lung. (A) H&E-stained lung sections taken from Braf+/+;CMV-Cre+/o mice, Braf+/Lox-L597V;CMV-Cre+/o mice, or Braf+/Lox-L597V mice lacking the CMV-Cre transgene. Bars, 100 μm. (B) H&E-stained lung sections taken from Braf+/+, Braf+/LSL-L597V, and Braf+/LSL-V600E mice treated with 1 × 10⁸ plaque-forming units (pfu) by nasal inhalation 8 wk post-AdCre infection. Bars, 100 μm. (C) Braf kinase assays of protein lysates prepared from the lungs of Braf+/+;CMV-Cre+/o (wild-type) and Braf+/Lox-L597V;CMV-Cre+/o (LV) mice as well as protein lysates prepared from Braf+/LSL-V600E mice treated with 1 × 10⁸ pfu of AdCre by nasal inhalation 8 wk post-AdCre infection (VE). Columns indicate the mean of three technical replicates of three different biological samples, and bars indicate the SD. P-values were calculated using the Student's t-test; (**) P < 0.005; (*) P < 0.01. (D) Western blot analysis of protein lysates prepared from the lungs of Braf+/+;CMV-Cre+/o (wild-type), Braf+/Lox-L597V;CMV-Cre+/o (LV), and Braf+/LSL-V600E mice treated with 1 × 10⁸ pfu of AdCre by nasal inhalation 8 wk post-AdCre infection (VE). Western blots were analyzed with the antibodies indicated.
Figure 4.
Figure 4.
L597VBraf modifies G12DKras MEF transformation. (A) Representative photographs of primary MEFs. (B) Western blot analysis of protein lysates from primary MEFs. Western blots were analyzed with the antibodies indicated. (C) Quantification of Western blot analysis of Mek/Erk phosphorylation and Dusp6/Sprouty2 expression. P-Mek, P-Erk, Dusp6, and Sprouty2 levels were normalized to Erk2, and the fold changes compared with wild-type MEFs are shown, where error bars indicate the SEM. Data were pooled from three MEFs with the same genotype. (D) Growth curves of primary MEFs over 8 d immediately following 72 h of treatment with AdCre. Mean values of three technical replicates of MEFs of each genotype are shown, and error bars indicate the SEM. These are representative profiles of four different MEFs of each genotype. (E) 3T3 immortalization profiles of MEFs treated with AdCre. Representative profiles of three different MEF lines of each genotype are shown. For all data, P-values were calculated using the Student's t-test; (*) P < 0.01; (NS) not significant.
Figure 5.
Figure 5.
L597VBraf modifies G12DKras-driven lung tumorigenesis. (A) H&E staining of representative lung sections from Kras+/LSL-G12D, Braf+/LSL-V600E, and Braf+/LSL-L597V;Kras+/LSL-G12D mice treated with 1 × 10⁸ pfu of AdCre 8 wk post-infection. Bars: top panels, 2 mm; bottom panels, 100 μm. (B) Tumor burden in lungs of Kras+/LSL-G12D, Braf+/LSL-V600E, and Braf+/LSL-L597V;Kras+/LSL-G12D mice at 8 and 12 wk post-infection with 1 × 10⁸ pfu of AdCre. Burden was determined as the percent diseased area per total lung area. Data represent the mean of three samples of each genotype at each time point, and error bars indicate the SD. (C) Percent of pulmonary lesions with respect to the total number of lesions in Kras+/LSL-G12D, Braf+/LSL-V600E, and Braf+/LSL-L597V;Kras+/LSL-G12D mice treated with 1 × 10⁸ pfu of AdCre pooled from 8- and 12-wk time points combined. Data represent the mean of six samples of each genotype, and error bars indicate the SD. For B and C, P-values were calculated using the Student's t-test; (**) P < 0.005; (NS) not significant. (D) Western blot analysis of protein lysates from the lungs of Braf+/+, Kras+/LSL-G12D, Braf+/Lox-V600E, and Braf+/Lox-L597V;Kras+/Lox-G12D mice treated with 1 × 10⁸ pfu of AdCre 8 wk post-infection and lysates from lungs of Braf+/LSL-L597V;CMV-Cre+/o mice. Western blots were analyzed with the antibodies indicated.
Figure 6.
Figure 6.
Microarray analysis. (A) Heat map of 436 genes significantly differentially expressed in G12D/LV MEFs compared with wild-type MEFs at a cutoff raw P-value of <0.01 in each of the biological samples. Values were generated through Affymetrix RMA normalization of all of the arrays, and the expression represents the absolute level of expression. The scale is log2, and the median expression level for the whole genome is ∼7.9. Genes are ordered by magnitude of differential expression. (B–D) Venn diagrams indicating numbers of shared genes differentially expressed in each of the samples indicated compared with wild-type samples at a cutoff raw P-value of <0.01.
Figure 7.
Figure 7.
L597VBraf signals through Craf and Braf. (A) Raf kinase assays of protein lysates isolated from the lungs of Braf+/+ (wild-type), Braf+/LSL-V600E (VE), Kras+/Lox-G12D (G12D), and Braf+/LSL-L597V;Kras+/LSL-G12D (G12D/LV) mice treated with 1 × 10⁸ pfu of AdCre 8 wk post-infection as well as protein lysates from lungs of Braf+/LSL-L597V;CMV-Cre+/o (LV) mice. The mean of three samples is shown, and error bars represent the SD. (B) Raf kinase assays of protein lysates isolated from primary MEFs following 72 h post-AdCre treatment. The mean of three samples is shown, and error bars represent the SEM. (A,B) Student's t-test in comparison with respective Braf/Craf kinase activities for wild-type samples; (*) P < 0.01; (**) P < 0.005; (NS) not significant. (C) Immortalized MEFs of each genotype were transfected with scrambled (Scr) siRNA or Craf, Braf, or both siRNAs, and Western blots were analyzed with the antibodies indicated. Quantification of Mek/Erk phosphorylation following siRNA treatment is shown in the graphs on the right. P-Mek and P-Erk levels were normalized to Erk2, and the fold changes compared with Scr-treated samples are shown, where error bars indicate the SEM. Data were pooled from three experiments. (D) Immortalized MEFs of each genotype were treated with carrier (C), U0126 (U0), PD184352 (PD), PLX4720 (PLX), or SB590885 (885) for 4 h, and Western blots were analyzed with the antibodies indicated. Quantification of Mek/Erk phosphorylation following RAF inhibitor treatment is shown in the graphs below. P-Mek and P-Erk levels were normalized to Erk2, and the fold changes compared with carrier-treated samples are shown, where error bars indicate the SEM. Data were pooled from six samples, representing three different cell lines of each genotype treated with PLX4720 or SB590885. For Western blot quantitations in C and D, P-values were calculated using the Student's t-test; (*) P < 0.01; (**) P < 0.005; (***) P < 0.001. (E) Craf:Braf heterodimer formation. LV and G12D/LV MEFs were treated with either PD184352/PLX4720 (P/X) or carrier control (C), protein lysates were harvested and immunoprecipitated for Braf, and immunoprecipitates were analyzed for Braf and Craf. As a control, the G12D/LV samples were also immunoprecipitated without (−) primary antibody and analyzed with the same antibodies.

Similar articles

Cited by

References

    1. Anastasaki C, Estep AL, Marais R, Rauen KA, Patton EE 2009. Kinase-activating and kinase-impaired cardio–facio–cutaneous syndrome alleles have activity during zebrafish development and are sensitive to small molecule inhibitors. Hum Mol Genet 18: 2543–2554 - PMC - PubMed
    1. Ashworth A, Lord CJ, Reis-Filho JS 2011. Genetic interactions in cancer progression and treatment. Cell 145: 30–38 - PubMed
    1. Basso AD, Kirschmeier P, Bishop WR 2006. Lipid posttranslational modifications. Farnesyl transferase inhibitors. J Lipid Res 47: 15–31 - PubMed
    1. Beerenwinkel N, Antal T, Dingli D, Traulsen A, Kinzler KW, Velculescu VE, Vogelstein B, Nowak MA 2007. Genetic progression and the waiting time to cancer. PLoS Comput Biol 3: e225 doi: 10.1371/journal.pcbi.0030225 - PMC - PubMed
    1. Benjamini Y, Hochberg Y 1995. Controlling the false discovery rate: A practical and powerful approach to multiple testing. J R Stat Soc Ser B Methodol 57: 289–300

Publication types

MeSH terms

Substances