. 2012 Aug 14:5:28.
doi: 10.1186/1756-6606-5-28.

A series of N-terminal epitope tagged Hdh knock-in alleles expressing normal and mutant huntingtin: their application to understanding the effect of increasing the length of normal Huntingtin's polyglutamine stretch on CAG140 mouse model pathogenesis

Affiliations

A series of N-terminal epitope tagged Hdh knock-in alleles expressing normal and mutant huntingtin: their application to understanding the effect of increasing the length of normal Huntingtin's polyglutamine stretch on CAG140 mouse model pathogenesis

Shuqiu Zheng et al. Mol Brain. .

Abstract

Background: Huntington's disease (HD) is an autosomal dominant neurodegenerative disease that is caused by the expansion of a polyglutamine (polyQ) stretch within Huntingtin (htt), the protein product of the HD gene. Although studies in vitro have suggested that the mutant htt can act in a potentially dominant negative fashion by sequestering wild-type htt into insoluble protein aggregates, the role of the length of the normal htt polyQ stretch, and the adjacent proline-rich region (PRR) in modulating HD mouse model pathogenesis is currently unknown.

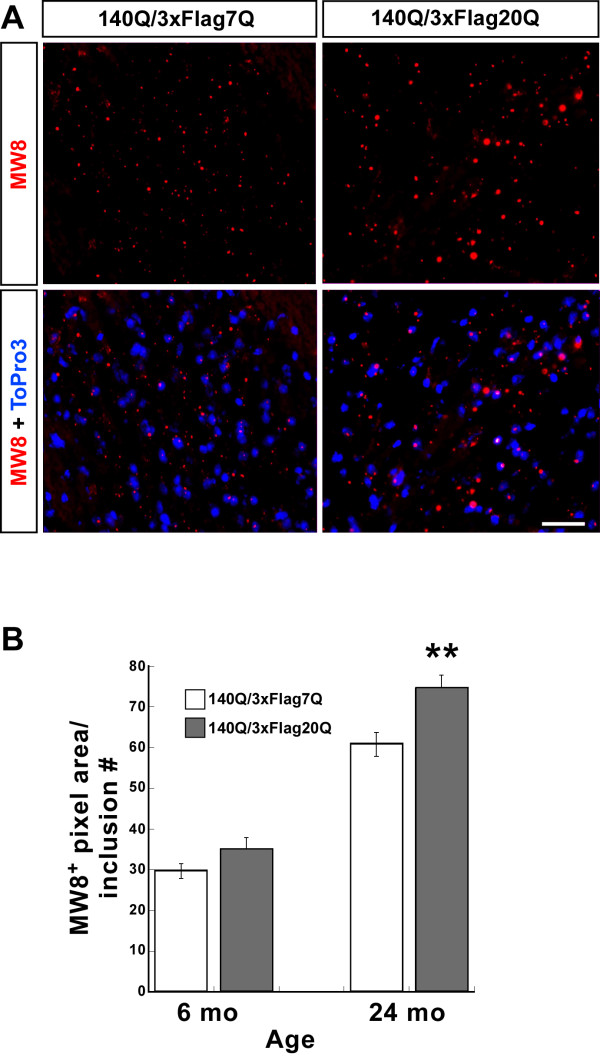
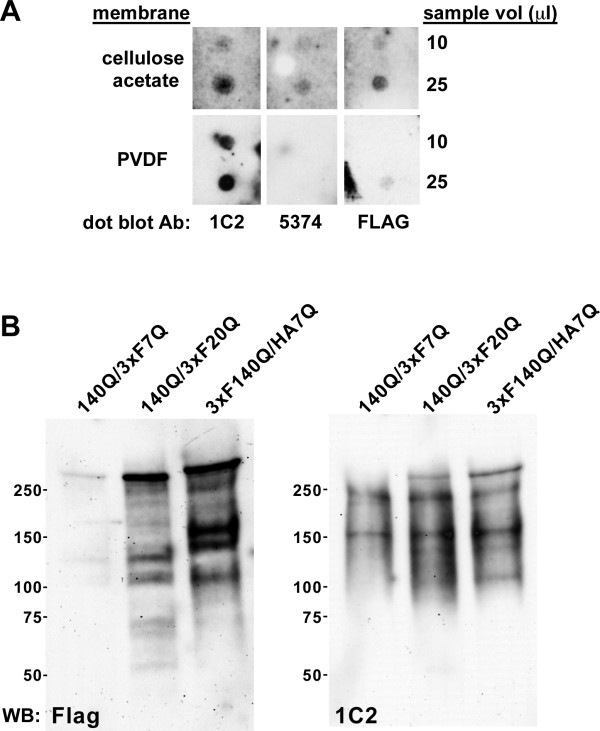
Results: We describe the generation and characterization of a series of knock-in HD mouse models that express versions of the mouse HD gene (Hdh) encoding N-terminal hemaglutinin (HA) or 3xFlag epitope tagged full-length htt with different polyQ lengths (HA7Q-, 3xFlag7Q-, 3xFlag20Q-, and 3xFlag140Q-htt) and substitution of the adjacent mouse PRR with the human PRR (3xFlag20Q- and 3xFlag140Q-htt). Using co-immunoprecipitation and immunohistochemistry analyses, we detect no significant interaction between soluble full-length normal 7Q- htt and mutant (140Q) htt, but we do observe N-terminal fragments of epitope-tagged normal htt in mutant htt aggregates. When the sequences encoding normal mouse htt's polyQ stretch and PRR are replaced with non-pathogenic human sequence in mice also expressing 140Q-htt, aggregation foci within the striatum, and the mean size of htt inclusions are increased, along with an increase in striatal lipofuscin and gliosis.

Conclusion: In mice, soluble full-length normal and mutant htt are predominantly monomeric. In heterozygous knock-in HD mouse models, substituting the normal mouse polyQ and PRR with normal human sequence can exacerbate some neuropathological phenotypes.


Figures

Figure 1
Figure 1
Diagram of the epitope tag-modified Hdh exon 1. The wild-type Hdh exon 1 contains a short polyQ stretch (7Q) and an adjacent proline-rich region (mouse PRR, gray). An HA N-terminal epitope tag (green) was inserted between amino acids 1 and 2 of the Hdh exon 1 containing the wild-type mouse polyQ stretch ( Hdh HA7Q ), while a 3xFlag N-terminal epitope tag (yellow) was inserted in the wild-type Hdh exon 1 ( Hdh 3xFlag7Q ), a chimeric mouse/human exon 1 containing a normal human polyQ stretch ( Hdh 3xFlag20Q ), and a chimeric mouse/human exon 1 with an expanded polyQ stretch (Hdh 3xFlag140Q ). The human portion of the chimeric exon 1 is indicated in light blue and darker blue (the human PRR), while the polyQ stretches are displayed in shades of red. The sequences of the epitope tags are indicated along with key restriction sites used in the construction of the gene targeting vectors. A, AlwN I; X, Xmn I; K, Kpn. I.
Figure 2
Figure 2
Expression of HA7Q-htt and 3xFlag7Q-htt in selected brain regions. (A) Confocal microscopy of HA epitope (HA), 3xFlag7Q epitope (FLAG), and htt (Htt) expression in the 24 month-old Hdh 3xFlag7Q/HA7Q striatum and cortex. Nuclei were visualized with the DNA dye To-Pro-3 (blue). Arrows indicate examples of where co-localization of the HA and 3xFlag epitopes, or of the epitopes with htt occurs. Scale bar = 25 μm. (B) Western blot analysis of HA7Q-htt (left panel) and 3xFlag7Q-htt (right panel) in 50 μg total protein isolated from Hdh HA7Q/+ and Hdh 3xFlag7Q/+ testis and various brain regions (brain stem: br stem, cerebellum: cb, thalamus: thal, striatum: str, and cortex: ctx). The antibodies used (monoclonal antibodies HA.11 and MAb FLAG M2) and the position of a 200 kD protein marker are indicated.
Figure 3
Figure 3
Expression of 3xFlag140Q-htt and HA7Q-htt in 12 month-old Hdh 3xFlag140Q/HA7Q cortex and striatum. (A) Confocal microscopy of fresh frozen brain sections containing the striatum and piriform cortex were immunostained with rabbit anti-Flag (green) and mouse anti-HA antibodies (red), while nuclei were visualized with the DNA dye To-Pro-3 (blue). In both the cortex and striatum, the Flag antibody stains a fraction of the nuclei, punctae, and to a lesser extent, the neuropil. HA staining is found diffusely in both the neuropil and in some nuclei. A few punctae co-stain with both Flag and HA antibodies in the cortex and striatum (open arrowheads), and filled arrowheads mark examples of nuclei co-staining with both antibodies. (B) In striatal sections co-immunostained with both Flag and an aggregation-specific antibody (mEM48; MAB5374), the majority of htt inclusions in the neuropil are stained with both antibodies (open arrowheads). Scale bar = 25 μm.
Figure 4
Figure 4
Full length 3xFlag7Q-htt and HA7Q-htt do not co-immunoprecipitate. 0.5 mg cytoplasmic extract prepared from the cerebellum (Cb) and striatum (Str) of a 1 month-old Hdh 3xFlag7Q/HA7Q mouse (A) and from the forebrain of a 12 month-old Hdh 3xFlag7Q/HA7Q mouse (B) was immunoprecipitated with anti-FLAG M2 agarose beads. The antibody non-bound sample (NB) represents 10% of the total NB fraction, and the antibody-bound sample (B) represents 33% of the total B sample. Protein was resolved on 5% SDS-PAGE, transferred to PVDF membranes, and probed with either FLAG M2 or HA.11 antibodies. In both the 1month- and 12 month-old mice, HA7Q-htt was found entirely in the NB fraction suggesting that there is no stable interaction between full-length soluble 7Q-htt. The positions of htt, and a 250 kD protein size standard are indicated.
Figure 5
Figure 5
A low level of interaction between full-length 140Q-htt and 3xFlag20Q-htt but not 3xFlag 7Q-htt can be detected by co-immunoprecipitation. (A) 700 μg of cytoplasmic protein prepared from the striatum (Str) and cerebellum (Cb) of a 6 month-old Hdh 140Q/3xFlag7Q mouse was immunoprecipitated with anti-Flag agarose beads, and separated into antibody non-bound (NB) and antibody-bound (B) fractions. Duplicate samples (Input Str represents 56 μg protein, while each NB sample represents 8% of the fraction, and each B sample represents 10% of the fraction for the anti-FLAG blot, and 40% of the fraction for the 1C2 blot) were fractionated on 5% SDS-PAGE and analyzed by western blotting with the indicated antibodies. 140Q-htt was not detected in the B-fractions, suggesting that a stable interaction between 140Q-htt and 3xFlag7Q-htt was below detection limits. (B) 500 μg whole brain cytoplasmic extract from a 13 month-old Hdh 3xFlag140Q/HA7Q mouse was immunoprecipitated with anti-FLAG or 1C2 antibodies using Protein G-agarose beads, and the NB- and B-fractions were analyzed by western blotting using 1C2 and 2166 antibodies. (C) 500 μg whole brain cytoplasmic extract from 27 month-old Hdh 140Q/3xFlag7Q and 16 month-old Hdh 140Q/3xFlag20Q mice was immunoprecipitated with anti-FLAG antibody and Protein-G agarose beads, and the NB- and B-fractions were analyzed by western blotting using 1C2 and 2166 antibodies. Shorter and longer exposures of the western blots are shown in the top two panels of (B,C). As a negative control for non-specific binding of htt to the agarose beads, antibody was omitted from the mixture of protein extract and Protein G-agarose beads (No Ab) in (B,C). An arrowhead marks the position of 140Q-htt co-immunoprecipitating with 3xFlag20Q-htt, while an asterisk indicates 3xFlag20Q-htt that is detected inefficiently by the 1C2 antibody when it is present in large amounts (C). The position of a 250 kD protein standard is indicated on the left.
Figure 6
Figure 6
Time course and quantification of htt inclusions in the Hdh 140Q/3xFlag7Q and Hdh 140Q/3xFlag20Q striatum. (A) Representative confocal images of the striatum at 2 months, 4 months, 6 months, and 24 months of age. An image from a 24 month-old wild-type (WT) control is also shown for comparison. 3xFlag7Q- and 3xFlag20Q-htt were detected with the FLAG M2 antibody (green), while htt inclusions were visualized using the MW8 antibody (red). Nuclei were visualized with To-Pro-3 (blue). White arrows indicate inclusions co-staining with the Flag antibody. Scale bar = 25 μm. (B) Quantification of total htt aggregate number/imaging field. (C) Quantification of total htt aggregate number (T), nuclear aggregate number (N) and neuropil aggregate number per imaging field at 6 months and 24 months of age (n=3 mice for each age and genotype). A significant difference in aggregate number between the Hdh 140Q/3xFlag7Q and Hdh 140Q/3xFlag20Q striatum was observed in the nuclear compartment at 6 months of age. Error bars=SEM, * P <0.05.
Figure 7
Figure 7
The mean size of htt inclusions in the Hdh 140Q/3xFlag20Q striatum is significantly larger than that in the Hdh 140Q/3xFlag7Q striatum at 2 years of age. (A) Confocal images of the Hdh 140Q/3xFlag7Q and Hdh 140Q/3xFlag20Q striatum at 24 months of age. Htt inclusions were detected with the MW8 antibody (red) and nuclei with To-Pro-3 (blue). Scale bar = 25 μm. (B) Quantification of the average size (total MW8 + pixels/inclusion number per imaging field) of htt inclusions in the Hdh 140Q/3xFlag7Q and Hdh 140Q/3xFlag20Q striatum at 6 months and 24 months of age (n=3 for each age and genotype, mean ± SEM plotted). ** P <0.01.
Figure 8
Figure 8
Co-localization of 3xFlag7Q- and 3xFlag20Q-htt with 140Q-htt in htt inclusions. (A) Confocal images of the Hdh 140Q/3xFlag7Q and Hdh 140Q/3xFlag20Q striatum at 24 months of age. Htt inclusions were detected with MW8 (red), while a Flag antibody was used to detect htt with the normal polyQ stretch. White arrows indicate examples of inclusions that contain the 3xFlag epitope (yellow). Scale bar = 25 μm. (B) The % co-localization between the Flag epitope and htt inclusions (Flag+ MW8+ inclusions/MW8+ inclusions per microscopic field) (n=4 mice of each genotype, mean ± SEM plotted ). Although there appeared to be a trend for slightly increased co-localization of 3xFlag20Q-htt with the MW8+ inclusions at 24 months of age, a significant difference between the two genotypes was not found ( P =0.06).
Figure 9
Figure 9
Detection of 3xFlag7Q- and 3xFlag20Q-htt in the SDS-insoluble nuclear fractions from Hdh 140Q/3xFlag7Q and Hdh 140Q/3xFlag20Q brains. (A) Aliquots of the crude nuclear fraction obtained from the whole brain of a 24 month-old Hdh 140Q/3xFlag7Q mouse were heated in the presence of SDS and analyzed by cellulose filter trap assay and western blotting. SDS-resistant htt inclusions trapped on the cellulose acetate membrane were detected with 1C2 and MAB5374 antibodies, while sequestered 3xFlag7Q-htt was detected with the FLAG M2 antibody. SDS-soluble 140Q-htt and 3xFlag7Q-htt species were detected on the PVDF membrane using 1C2 and FLAG antibodies. (B) Crude nuclear fractions were obtained 24 month-old Hdh 140Q/3xFlag7Q (140Q/3xF7Q), Hdh 140Q/3xFlag20Q (140Q/3xF20Q), and Hdh 3xFlag140Q/HA7Q (3xF140Q/HA7Q) brains, boiled in the presence of SDS, sonicated, and the remaining SDS-insoluble material was extracted with formic acid. The formic acid-solubilized fractions were analyzed by western blotting using Flag (FLAG M2, left panel), and 1C2 antibodies (right panel). 3xFlag epitope immunoreactivity in the Hdh 140Q/3xFlag20Q nuclear fraction is increased in comparison to the Hdh 140Q/3xFlag7Q fraction. The sizes of protein standards (in kD) are indicated.
Figure 10
Figure 10
Formic acid treatment reveals an increase in small 1C2+inclusions in the Hdh 140Q/3xFlag20Q striatum in comparison to Hdh 140Q/3xFlag7Q striatum. (A) Images of the striatum from 6 month-old and 2 year-old Hdh 140Q/3xFlag7Q and Hdh 140Q/3xFlag20Q mice probed with 1C2 antibody (red) following formic acid treatment. Nuclei were visualized with To-Pro-3. Examples of “aggregate chains” are indicated with white arrows. Scale bar = 25 μm. (B) Quantification of the total 1C2+ pixel area per microscopic field in the striatum of Hdh 140Q/3xFlag7Q and Hdh 140Q/3xFlag20Q mice at 6 months and 24 months of age (n=3 mice for each age and genotype, mean ± SEM). * P <0.05.
Figure 11
Figure 11
Gliosis and lipofuscin accumulation in Hdh 140Q/3xFlag20Q and Hdh 140Q/3xFlag7Q mice. (A) Images of the striatum of 2 year-old wild type (+/+), Hdh 140Q/3xFlag7Q , Hdh 140Q/3xFlag20Q , and Hdh 140Q/3xFlag140Q mice probed with antibodies against GFAP (green) and htt inclusions (MW8, red). Nuclei were visualized with To-Pro-3 (blue). (B) The mean total pixel area of GFAP staining per microscopic field of the ventral striatum was plotted for each genotype (n=3 mice for each genotype). (C) Images of lipofuscin autofluorescence (yellow) in the striatum of 2 year-old wild type (+/+), Hdh 140Q/3xFlag7Q , Hdh 140Q/3xFlag20Q , and Hdh 140Q/3xFlag140Q mice. Nuclei were stained with To-Pro-3. (D) The mean total pixel area of lipofuscin autofluorescence was plotted for each genotype (n=3 mice for each genotype, mean ± SEM plotted). *P<0.05, **P<0.01 in B,D. Scale bar = 25 μm in A,C.

Similar articles

Cited by

References

    1. Huntingto’s Disease Collaborative Research Group. A novel gene containing a trinucleotide repeat that is expanded and unstable on Huntington's disease chromosomes. The Huntington's Disease Collaborative Research Group. Cell. 1993;72:971–983. doi: 10.1016/0092-8674(93)90585-E. - DOI - PubMed
    1. Zuccato C, Valenza M, Cattaneo E. Molecular mechanisms and potential therapeutical targets in Huntington's disease. Physiol Rev. 2010;90:905–981. doi: 10.1152/physrev.00041.2009. - DOI - PubMed
    1. Vonsattel JP, DiFiglia M. Huntington disease. J Neuropathol Exp Neurol. 1998;57:369–384. doi: 10.1097/00005072-199805000-00001. - DOI - PubMed
    1. Davies SW, Turmaine M, Cozens BA, DiFiglia M, Sharp AH, Ross CA, Scherzinger E, Wanker EE, Mangiarini L, Bates GP. Formation of neuronal intranuclear inclusions underlies the neurological dysfunction in mice transgenic for the HD mutation. Cell. 1997;90:537–548. doi: 10.1016/S0092-8674(00)80513-9. - DOI - PubMed
    1. DiFiglia M, Sapp E, Chase KO, Davies SW, Bates GP, Vonsattel JP, Aronin N. Aggregation of huntingtin in neuronal intranuclear inclusions and dystrophic neurites in brain. Science. 1997;277:1990–1993. doi: 10.1126/science.277.5334.1990. - DOI - PubMed

Publication types

MeSH terms