. 2012 Nov;343(2):389-400.
doi: 10.1124/jpet.112.197780. Epub 2012 Aug 14.

Dissociable effects of the cannabinoid receptor agonists Δ9-tetrahydrocannabinol and CP55940 on pain-stimulated versus pain-depressed behavior in rats

Affiliations

Dissociable effects of the cannabinoid receptor agonists Δ9-tetrahydrocannabinol and CP55940 on pain-stimulated versus pain-depressed behavior in rats

Andrew J Kwilasz et al. J Pharmacol Exp Ther. 2012 Nov.

Abstract

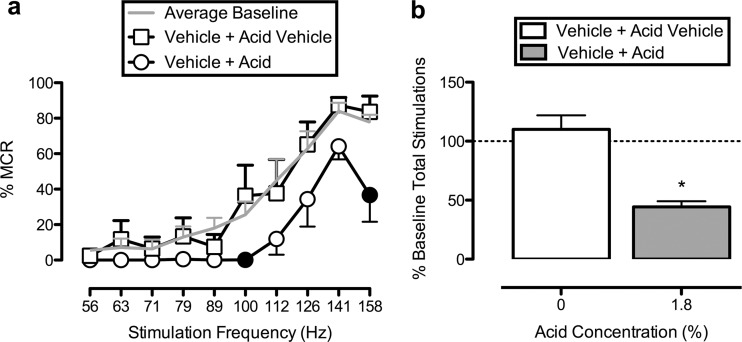
Cannabinoid receptor agonists produce reliable antinociception in most preclinical pain assays but have inconsistent analgesic efficacy in humans. This disparity suggests that conventional preclinical assays of nociception are not sufficient for the prediction of cannabinoid effects related to clinical analgesia. To extend the range of preclinical cannabinoid assessment, this study compared the effects of the marijuana constituent and low-efficacy cannabinoid agonist Δ9-tetrahydrocannabinol (THC) and the high-efficacy synthetic cannabinoid agonist 3-(2-hydroxy-4-(1,1-dimethylheptyl)phenyl)-4-(3-hydroxypropyl)cyclohexanol (CP55940) in assays of pain-stimulated and pain-depressed behavior. Intraperitoneal injection of dilute lactic acid (1.8% in 1 ml/kg) stimulated a stretching response or depressed intracranial self-stimulation (ICSS) in separate groups of male Sprague-Dawley rats. THC (0.1-10 mg/kg) and CP55940 (0.0032-0.32 mg/kg) dose-dependently blocked acid- stimulated stretching but only exacerbated acid-induced depression of ICSS at doses that also decreased control ICSS in the absence of a noxious stimulus. Repeated THC produced tolerance to sedative rate-decreasing effects of THC on control ICSS in the absence of the noxious stimulus but failed to unmask antinociception in the presence of the noxious stimulus. THC and CP55940 also failed to block pain-related depression of feeding in rats, although THC did attenuate satiation-related depression of feeding. In contrast to the effects of the cannabinoid agonists, the clinically effective analgesic and nonsteroidal anti-inflammatory drug ketoprofen (1 mg/kg) blocked acid-stimulated stretching and acid-induced depression of both ICSS and feeding. The poor efficacy of THC and CP55940 to block acute pain-related depression of behavior in rats agrees with the poor efficacy of cannabinoids to treat acute pain in humans.


Figures

Fig. 1.
Fig. 1.
THC produced dose-dependent, time-dependent, and rimonabant-reversible blockade of lactic acid-stimulated stretching. a, effects of THC (0.1–10 mg/kg) or its vehicle administered 30 min before acid treatment. Abscissa, dose of THC in milligrams per kilogram. Ordinates, number of stretches observed during a 30-min observation period. b, effects of THC (3.2 mg/kg) administered 10 min to 24 h before acid treatment. Effects of vehicle administered 30 min before acid treatment are included for comparison. Abscissa, time after THC or vehicle administration. c, the effects of 50-min pretreatment with rimonabant (0.01–1.0 mg/kg) or its vehicle and 30 min pretreatment with THC (3.2 mg/kg) before acid treatment. Effects of rimonabant vehicle + THC vehicle + acid are included for comparison. Abscissa, dose rimonabant in milligrams per kilogram. One-way ANOVA indicated significant main effects of THC treatment in a (F5,25 = 6.63; p < 0.001), time in b (F5,25) = 7.65; p < 0.001), and rimonabant dose in c (F4,20 = 11.21; p < 0.001). *, significantly different from vehicle + acid. $, significantly different from 30-min pretreatment with THC (3.2 mg/kg) in b and THC (3.2 mg/kg) + rimonabant vehicle in c as determined by Newman-Keuls post hoc test; p < 0.05. All bars show mean ± S.E.M. in six rats.
Fig. 2.
Fig. 2.
THC produced dose-dependent, time-dependent, and rimonabant-reversible depression of ICSS in the absence of a noxious stimulus. a, ICSS frequency-rate curves determined 30 min after treatment with THC (0.32–10 mg/kg) or its vehicle. Abscissa, frequency of electrical brain stimulation in hertz (log scale). Ordinate, %MCR. The average baseline ICSS frequency-rate curve for the entire study in this group of rats is shown by the gray line for comparison, but these data were not included in statistical analysis. Two-way ANOVA indicated a significant main effect of THC treatment (F4,20 = 11.78; p < 0.001), a significant main effect of frequency (F9,45 = 19.31; p < 0.001), and a significant frequency × treatment interaction (F36,180 = 4.77; p < 0.001). Filled symbols indicate frequencies at which reinforcement rates after THC treatment were significantly lower than rates after THC vehicle treatment as determined by Holm-Sidak post hoc test; p < 0.05. All data show mean ± S.E.M. in six rats. b, the total number of stimulations per component expressed as a percentage of baseline stimulations per component after treatment with THC (0.32–10.0 mg/kg) or its vehicle at various pretreatment times. Abscissa, time after THC or vehicle administration. Ordinate, percentage of baseline total number of stimulations per component. Two-way ANOVA indicated a significant main effect of THC treatment (F4,20 = 12.35; p < 0.001) and a significant treatment × time interaction (F12,60 = 5.93; p < 0.001). Filled symbols indicate significantly lower than vehicle treatment at the indicated times as determined by Holm-Sidak post hoc test; p < 0.05. All data show mean ± S.E.M. in six rats. c, the total number of stimulations per component expressed as a percentage of baseline stimulations per component after 50-min pretreatment with rimonabant (1 mg/kg) or its vehicle and 30-min pretreatment with THC (3.2 mg/kg) or its vehicle. Abscissa, dose of rimonabant in milligrams per kilogram. Ordinate, percentage of baseline total number of stimulations per component. One-way ANOVA indicated a significant main effect of treatment (F3,12 = 17.04; p < 0.001). *, significantly different from rimonabant vehicle + THC vehicle. $, significantly different from rimonabant vehicle + THC (3.2 mg/kg) as determined by Newman-Keuls post hoc test; p < 0.05. All bars show mean ± S.E.M. in five rats.
Fig. 3.
Fig. 3.
Lactic acid depresses ICSS. a, ICSS frequency-rate curves determined after treatment with THC vehicle 30 min before lactic acid vehicle or 1.8% lactic acid administration. Abscissa, frequency of electrical brain stimulation in hertz (log scale). Ordinate, %MCR. The average baseline ICSS frequency-rate curve for the entire study in this group of rats is shown by the gray line for comparison, but these data were not included in statistical analysis. Two-way ANOVA indicated a significant main effect of frequency (F9,36 = 23.92; p < 0.001) and a significant frequency × treatment interaction (F9,36 = 2.40; p = 0.030). Filled symbols indicate frequencies at which reinforcement rates after acid treatment were significantly lower than rates after acid vehicle treatment as determined by Holm-Sidak post hoc test; p < 0.05. b, the total number of stimulations per component expressed as a percentage of baseline stimulations per component determined after treatment with THC vehicle 30 min before lactic acid vehicle or 1.8% lactic acid administration. Abscissa, lactic acid concentration. Ordinate, percentage of baseline total number of stimulations per component. *, 1.8% lactic acid significantly depressed ICSS compared with 0% lactic acid (i.e., lactic acid vehicle) as determined by paired t test (t4 = 6.95; p = 0.002). All bars show mean ± S.E.M. in five rats.
Fig. 4.
Fig. 4.
THC exacerbates lactic acid-induced depression of ICSS. a, ICSS frequency-rate curves determined after treatment with THC (0.32–3.2 mg/kg) or its vehicle 30 min before acid administration. Abscissa, frequency of electrical brain stimulation in hertz (log scale). Ordinate, %MCR. The THC vehicle + acid vehicle frequency-rate curve is shown by the gray line for comparison, but these data were not included in statistical analysis. Two-way ANOVA indicated a significant main effect of THC treatment (F3,12 = 5.16; p = 0.016), a significant main effect of frequency (F9,36 = 6.68; p < 0.001), and a significant frequency × treatment interaction (F27,108 = 4.62; p < 0.001) Filled symbols indicate frequencies at which reinforcement rates after THC + acid treatment were significantly lower than after vehicle + acid treatment as determined by Holm-Sidak post hoc test; p < 0.05. All data show mean ± S.E.M. in five rats. b, the total number of stimulations per component expressed as a percentage of baseline stimulations per component after treatment with THC (0.32–3.2 mg/kg) or its vehicle 30 min before acid administration. Abscissa, dose THC in milligrams per kilogram. Ordinate, percentage of baseline total number of stimulations per component. One-way ANOVA indicated a significant main effect of treatment (F4,16 = 19.26; p < 0.001). *, treatment with THC vehicle + acid or THC + acid significantly depressed ICSS compared with treatment with THC vehicle + acid vehicle as determined by Newman Keul's post hoc test; p < 0.05. All bars show mean ± S.E.M. in five rats. c, the total number of stimulations per component expressed as a percentage of baseline stimulations per component after treatment with THC vehicle 30 min before acid vehicle or acid administration or THC (3.2 mg/kg) 30 to 300 min before acid administration. Abscissa, time after THC or vehicle administration. Ordinate, percentage of baseline total number of stimulations per component. One-way ANOVA indicated a significant main effect of treatment (F4,12 = 14.43; p < 0.001). *, treatment with THC vehicle + acid or THC (3.2 mg/kg) + acid significantly depressed ICSS compared with treatment with THC vehicle + acid vehicle as determined by Newman Keul's post hoc test; p < 0.05. All bars show mean ± S.E.M. in four rats.
Fig. 5.
Fig. 5.
Effects of CP55940 (a and b) and ketoprofen (c and d) on lactic acid-stimulated stretching and lactic acid-induced depression of ICSS. Abscissae, drug dose in milligram/kilogram. a and c ordinates, number of stretches observed during 30-min observation periods. b and d ordinates, percentage of baseline total number of stimulations per component. a, CP55940 dose-dependently blocked acid-stimulated stretching (F4,16 = 38.80; p < 0.001) as indicated by one-way ANOVA. b, two-way ANOVA on ICSS data in the presence and absence of acid treatment indicated a significant main effect of CP55940 dose (F4,16 = 34.44; p < 0.01) and a significant main effect of acid treatment (F1,4 = 15.69; p = 0.017), but no significant interaction. c, ketoprofen blocked acid-induced stimulation of stretching (t3 = 4.43; p = 0.021) as indicated by t test. d, two-way ANOVA on ICSS data in the presence and absence of acid treatment indicated a significant main effect of ketoprofen dose (F1,3 = 16.95; p = 0.026) and a significant main effect of acid treatment (F1,3 = 13.71; p = 0.034), but no significant interaction. In a and c, *, significant difference from a 0 drug dose (i.e., vehicle) + lactic acid as determined by one-way ANOVA followed by Dunnett's post hoc test (CP55940) or t test (ketoprofen); p < 0.05. In b and d, *, significant difference from a 0 drug dose (i.e., vehicle) + lactic acid vehicle. $, significant difference from a 0 drug dose + lactic acid. #, significant depression of ICSS by lactic acid as determined by two-way ANOVA followed by Holm-Sidak post hoc test; p < 0.05. All bars show mean ± S.E.M. in five rats (CP55940) or four rats (ketoprofen).
Fig. 6.
Fig. 6.
Chronic administration of THC produces tolerance to its rate-decreasing effects on ICSS in the absence of a noxious stimulus. Abscissa, THC challenge dose (milligram/kilogram). Ordinate, percentage of baseline total number of stimulations per component. Two-way ANOVA indicated a significant main effect of chronic THC dose (F3,12 = 16.27; p < 0.001), a significant main effect of THC challenge dose (F3,12 = 55.33; p < 0.001), and a significant interaction (F9,36 = 3.58; p = 0.003). Filled symbols indicate chronic THC + THC challenge dose combinations after which reinforcement rates were significantly higher than rates after the same THC challenge administered during chronic vehicle, as determined by Holm-Sidak post hoc test; p < 0.05. All bars show mean ± S.E.M. in five rats.
Fig. 7.
Fig. 7.
Chronic administration of THC produces partial tolerance to its antinociceptive effects in the assay of acid-stimulated stretching but does not unmask antinociceptive effects in the assay of acid-depressed ICSS. Abscissae, day of THC (3.2 mg/kg/day) administration. a ordinate, number of stretches observed during 30-min observation periods. b ordinate, percentage of baseline total number of stimulations per component. Effects of a 2-week washout period after chronic THC administration are also shown for comparison but were not included in the statistical analysis. a, the effects of chronic administration of THC in the assay of acid-stimulated stretching. One-way ANOVA indicated a significant main of THC treatment duration (F4,20 = 9.41; p < 0.001). *, treatment with THC produced significant antinociception compared with treatment with THC vehicle on days 1, 8, 15, and 22 of chronic THC administration. $, significant tolerance to this antinociceptive effect on day 15 compared with day 1 of chronic THC administration as determined by Newman-Keul's post hoc test; p < 0.05. b, the effects of chronic administration of THC in the assay of acid-depressed ICSS. One-way ANOVA indicated a significant main effect of treatment (F5,20 = 10.08; p < 0.001). *, treatment with acid significantly depressed ICSS compared with treatment with lactic acid vehicle as determined by Newman-Keul's post hoc test; p < 0.05. Chronic THC administration failed to alter THC effects on acid-induced depression of ICSS. All bars show mean ± S.E.M. in six rats (stretching) or five rats (ICSS).
Fig. 8.
Fig. 8.
THC and ketoprofen effects on feeding depressed by acid or prefeeding. a, the effects of lactic acid vehicle, lactic acid (0.56–1.8%), or a 60-min prefeeding session on feeding. Abscissa, percentage of acid concentration. Ordinates, percentage of body weight food consumed in grams during a 30-min feeding session. One-way ANOVA indicated a significant main effect of treatment (F4,20 = 16.30; p < 0.001). *, lactic acid (1–1.8%) or a 60-min prefeeding session significantly decreased feeding as determined by Dunnett's post hoc test; p < 0.05. All bars show mean ± S.E.M. in six rats. b, effects of THC (0.32–3.2 mg/kg), ketoprofen (1 mg/kg), or vehicle administered 30 min before acid vehicle treatment on control feeding. Abscissa, drug dose in milligrams per kilogram. THC and ketoprofen did not significantly alter feeding in the absence of lactic acid or during a 60-min prefeeding session. All bars show mean ± S.E.M. in seven rats. c, the effects of THC (0.32–1 mg/kg), ketoprofen (1 mg/kg), or vehicle administered 30 min before 1.8% lactic acid. Abscissa, drug dose in milligrams per kilogram. One-way ANOVA indicated a significant main effect of treatment (F4,24 = 10.46; p < 0.001). *, ketoprofen significantly blocked acid-induced depression of feeding as determined by Dunnett's post hoc test; p < 0.05. All bars show mean ± S.E.M. in seven rats. d, the effects of THC (0.1–1 mg/kg), ketoprofen (1 mg/kg), or vehicle administered immediately after a 60-min prefeeding session and 30 min before the test session. Abscissa, drug dose in milligrams per kilogram. One-way ANOVA indicated a significant main effect of treatment (F4,28 = 2.88; p = 0.041). *, THC significantly blocked prefeeding-induced depression of feeding as determined by Dunnett's post hoc test; p < 0.05. All bars show mean ± S.E.M. in eight rats. e, the effects of CP55940 (0.0032–0.032 mg/kg or vehicle) administered 30 min before 1.8% lactic acid. One-way ANOVA indicated a significant main effect of acid treatment (F4,28 = 19.64; p < 0.001). *, lactic acid (1.8%) significantly decreased feeding as determined by Newman-Keuls post hoc test; p < 0.05. All means ± S.E.M. represent eight rats. f, the effects of CP55940 (0.0032–0.032 mg/kg or vehicle) administered immediately after a 60-min prefeeding session and 30 min before the test session. One-way ANOVA indicated a significant main effect of prefeeding treatment (F4,28 = 4.25; p = 0.008). *, a 60-min prefeeding session significantly decreased feeding versus CP55940 vehicle alone as determined by Newman-Keuls post hoc test; p < 0.05. CP55940 did not alter feeding under either condition tested. All means ± S.E.M. represent eight rats.

Similar articles

Cited by

References

    1. Anikwue R, Huffman JW, Martin ZL, Welch SP. (2002) Decrease in efficacy and potency of nonsteroidal anti-inflammatory drugs by chronic Δ9-tetrahydrocannabinol administration. J Pharmacol Exp Ther 303:340–346 - PubMed
    1. Beaulieu P. (2006) Effects of nabilone, a synthetic cannabinoid, on postoperative pain. Can J Anaesth 53:769–775 - PubMed
    1. Blackburn-Munro G. (2004) Pain-like behaviours in animals–how human are they? Trends Pharmacol Sci 25:299–305 - PubMed
    1. Booker L, Naidu PS, Razdan RK, Mahadevan A, Lichtman AH. (2009) Evaluation of prevalent phytocannabinoids in the acetic acid model of visceral nociception. Drug Alcohol Depend 105:42–47 - PMC - PubMed
    1. Borsook D, Becerra L. (2011) CNS animal fMRI in pain and analgesia. Neurosci Biobehav Rev 35:1125–1143 - PMC - PubMed

Publication types

MeSH terms