. 2012 Oct;160(2):929-43.
doi: 10.1104/pp.112.203976. Epub 2012 Aug 14.

HSPRO controls early Nicotiana attenuata seedling growth during interaction with the fungus Piriformospora indica

Affiliations

HSPRO controls early Nicotiana attenuata seedling growth during interaction with the fungus Piriformospora indica

Stefan Schuck et al. Plant Physiol. 2012 Oct.

Abstract

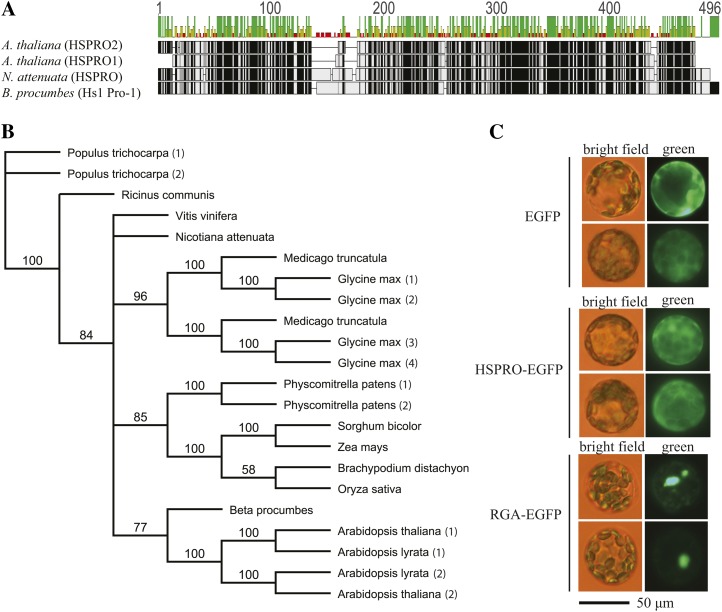
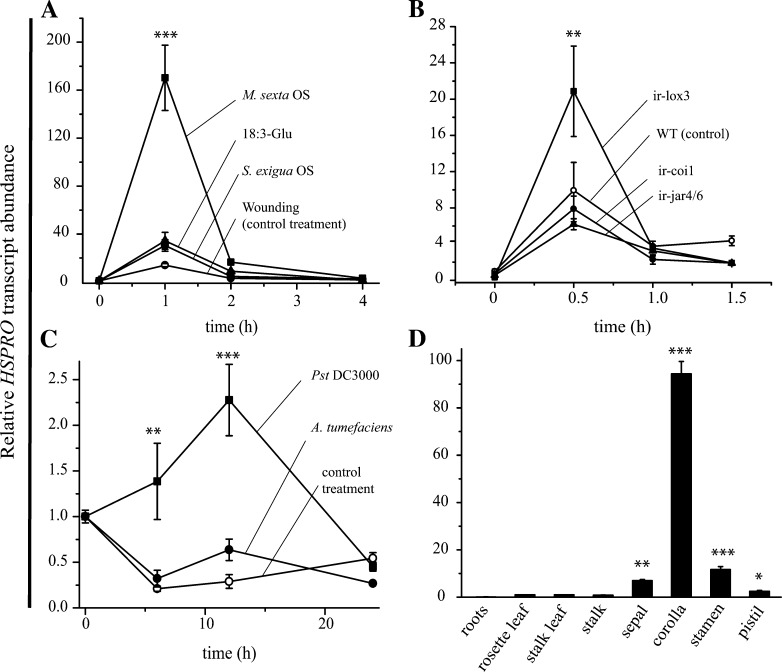
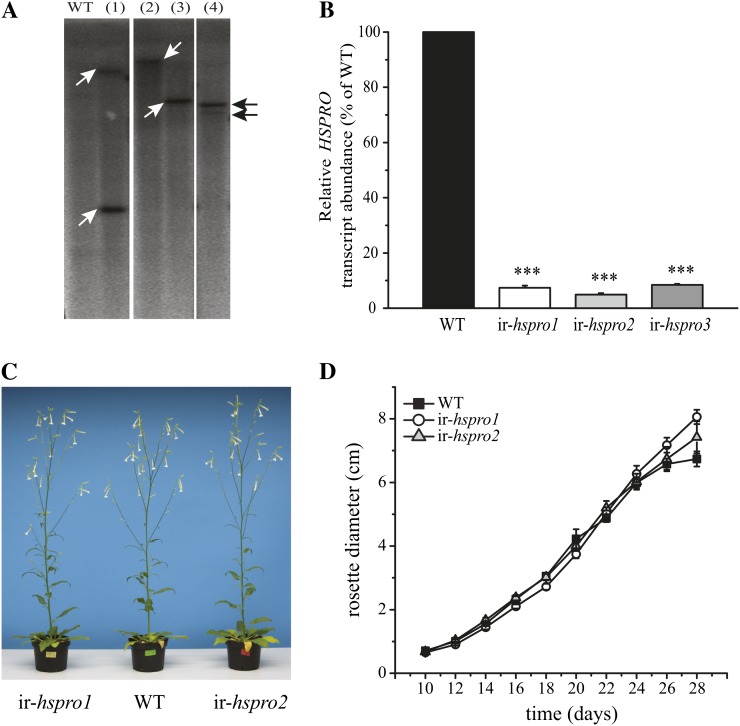
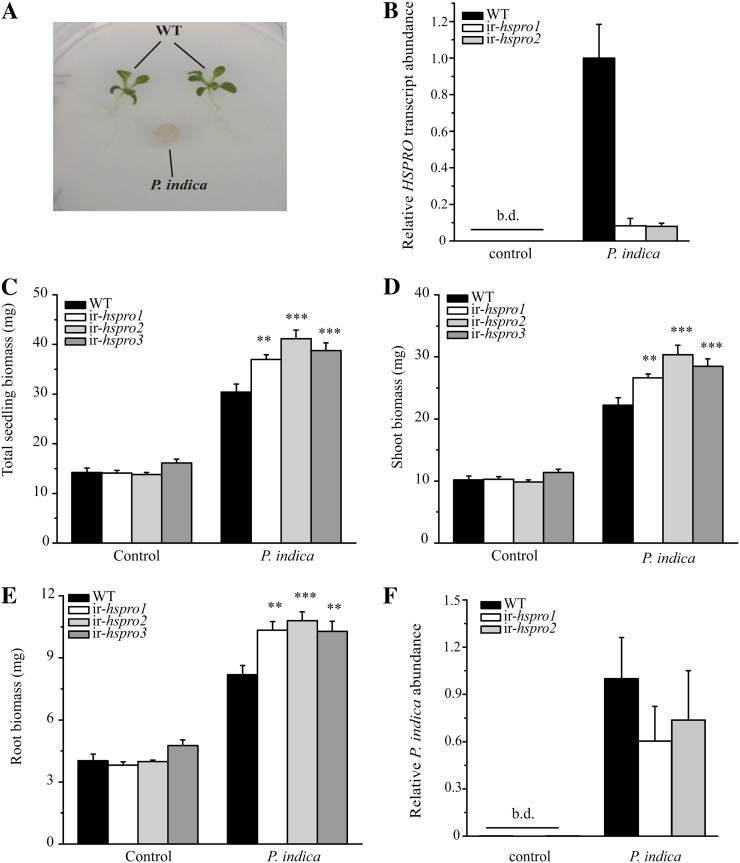
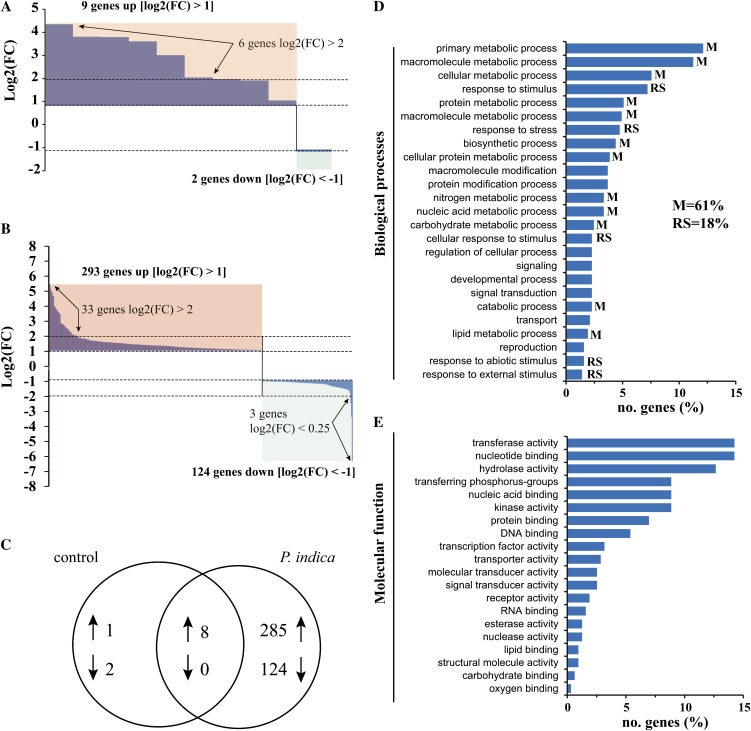
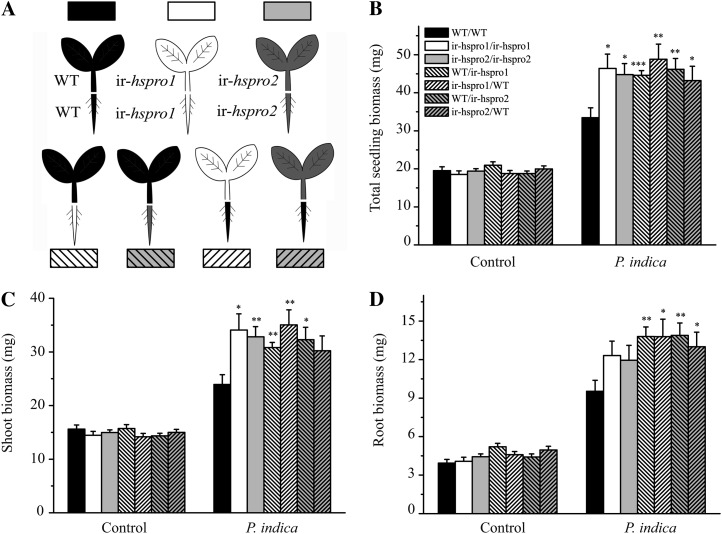
In a previous study aimed at identifying regulators of Nicotiana attenuata responses against chewing insects, a 26-nucleotide tag matching the HSPRO (ORTHOLOG OF SUGAR BEET Hs1(pro)(-)(1)) gene was found to be strongly induced after simulated herbivory (Gilardoni et al., 2010). Here we characterized the function of HSPRO during biotic interactions in transgenic N. attenuata plants silenced in its expression (ir-hspro). In wild-type plants, HSPRO expression was not only induced during simulated herbivory but also when leaves were inoculated with Pseudomonas syringae pv tomato DC3000 and roots with the growth-promoting fungus Piriformospora indica. Reduced HSPRO expression did not affect the regulation of direct defenses against Manduca sexta herbivory or P. syringae pv tomato DC3000 infection rates. However, reduced HSPRO expression positively influenced early seedling growth during interaction with P. indica; fungus-colonized ir-hspro seedlings increased their fresh biomass by 30% compared with the wild type. Grafting experiments demonstrated that reduced HSPRO expression in roots was sufficient to induce differential growth promotion in both roots and shoots. This effect was accompanied by changes in the expression of 417 genes in colonized roots, most of which were metabolic genes. The lack of major differences in the metabolic profiles of ir-hspro and wild-type colonized roots (as analyzed by liquid chromatography time-of-flight mass spectrometry) suggested that accelerated metabolic rates were involved. We conclude that HSPRO participates in a whole-plant change in growth physiology when seedlings interact with P. indica.


Figures

Figure 1.
Figure 1.
Analysis of HSPRO amino acid sequence and cellular localization. A, Schematic protein sequence alignment of N. attenuata HSPRO (JQ354963), Arabidopsis HSPRO1 (At2g4000) and HSPRO2 (At3g55840), and B. procumbes Hs1pro-1 (U79733 plus DQ148271). The cartoon above the sequences shows the percentage of similarity (green bars within the overlapping regions represent identical amino acids in the four sequences). See Supplemental Figure S2 for a detailed amino acid alignment. B, Phylogenetic analysis of HSPRO proteins from different organisms. The tree was constructed using the Geneious Pro software (5.3.4) with the Jukes-Cantor genetic distance model and the neighbor-joining tree building method with bootstrapping (602 random seed, 100 replicates, and 50% support threshold). See Supplemental Figure S1B for a reference to accession numbers. C, Arabidopsis mesophyll protoplasts were isolated and transiently transfected with vectors carrying either EGFP alone (cytosolic localization), EGFP C-terminal fusions with REPRESSOR OF ga1-3 (RGA-EGFP; nuclear localization), and EGFP C-terminal fusions with HSPRO (HSPRO-EGFP) under regulation of the cauliflower mosaic virus 35S promoter. After transfection, protoplasts were incubated for 15 h in the dark at room temperature and images were taken with a Zeiss Axioplan fluorescence microscope with standard settings for EGFP.
Figure 2.
Figure 2.
Analysis of HSPRO expression in wild-type and transgenic N. attenuata plants. The levels of HSPRO mRNA were analyzed by qPCR in leaves of wild-type and transgenic N. attenuata plants after different treatments and in different plant organs and tissues. mRNA levels are expressed relative to the levels of the reference gene Na-EF1A. Quantification was performed by the comparative cycle threshold method (n = 3–6; bars = ±se). A, Elicitation of leaves from wild-type plants with OS from M. sexta and S. exigua larvae, synthetic 18:3-Glu, or wounding. One way-ANOVA with Tukey’s post-hoc test (M. sexta OS versus wounding); ***, P < 0.001. B, Elicitation of leaves from wild-type and transgenic lines with synthetic 18:3-Glu. One way-ANOVA with Tukey’s post-hoc test (ir-lox3 versus the wild type); **, P < 0.01. C, Infection of leaves from wild-type plants with Pst DC3000 and A. tumefaciens (GV3101). One-way ANOVA with Tukey’s post-hoc test (Pst DC3000 versus control); **, P < 0.01; ***, P < 0.001. D, HSPRO mRNA levels in different organs and tissues of wild-type N. attenuata plants. Relative levels of HSPRO mRNA in roots were set arbitrarily to 1. One-way ANOVA with Tukey’s post-hoc test (roots versus other tissues); *, P < 0.05; **, P < 0.01; ***, P < 0.001.
Figure 3.
Figure 3.
Characterization of ir-hspro plants. A, Southern-blot analysis of the ir-hspro transgenic lines. Genomic DNA from four independent ir-hspro N. attenuata lines (1–4) and wild-type plants was digested with EcoRV and resolved by agarose gel electrophoresis. A 32P-labeled fragment corresponding to the hygromycin resistance gene nptII was used as a probe. The white arrows point to individual T-DNA insertions (lane 2: ir-hspro1; lane 3: ir-hspro2; lane 4: ir-hspro3). B, Analysis of HSPRO mRNA levels in leaves of ir-hspro lines at 1 h after 18:3-Glu elicitation (n = 6; bars = ±se). Relative mRNA levels were quantified as detailed in caption of Figure 1. One-way ANOVA with Tukey’s post-hoc test (wild type versus ir-hspro); ***, P < 0.001. C, Morphology of wild-type and ir-hspro plants at the late elongation stage. D, Rosette growth curve (measured as rosette diameter) of wild-type and ir-hspro plants (n = 8–20; bars = ±se). [See online article for color version of this figure.]
Figure 4.
Figure 4.
Induction of differential growth promotion of ir-hspro seedlings by P. indica. A, Plate system used for the experiments. Five days after germination in standard agar media, two seedlings were transferred onto a nylon mesh covering an agar plate at 1 cm distance from a plug transferred from a 2-week-old P. indica culture. B, Analysis of HSPRO mRNA levels in roots of wild-type and ir-hspro seedlings during interaction with P. indica and in control treatment (absence of P. indica). Root samples were harvested at day 14 (n = 3; bars = ±se) and mRNA levels were quantified as detailed in caption of Figure 1. b.d., Below detection limit. C to E, Determination of the fresh biomass of total seedlings, shoots, and roots was performed with a microbalance after 14 d of seedling growth on the plate system (n = 18–20; bars = ±se); one-way ANOVA with Tukey’s post-hoc test (wild type versus ir-hspro during P. indica colonization); **, P < 0.01; ***, P < 0.001. F, Quantification of P. indica root colonization. DNA was extracted from roots of wild-type and ir-hspro seedlings colonized by P. indica at day 14 and fungal colonization was determined by qPCR based on the relative abundance of the π-EF1a gene compared with the Na-EF1a gene (n = 16–18; bars = ±se). b.d., Below detection limit. [See online article for color version of this figure.]
Figure 5.
Figure 5.
Microarray and Gene Ontology (GO) analysis of differentially expressed genes in P. indica-colonized roots of ir-hspro and wild-type seedlings. A, Distribution of FC of genes expressed differentially in roots of ir-hspro seedlings (ir-hspro versus the wild type). B, Distribution of FC of genes expressed differentially in roots of ir-hspro seedlings colonized by P. indica (ir-hspro versus the wild type). C, Venn diagram of the number of genes differentially expressed in control and colonized roots of ir-hspro seedlings compared with the wild type. The number in the intersection represents the genes differentially expressed in the two groups. D and E, Annotated genes differentially expressed in P. indica-colonized roots of ir-hspro seedlings were categorized based on biological processes (D) and molecular function (E), using the Blast2Go software. The numbers between brackets represent the percentage (%) of genes in the metabolism category (M) or in the stress response category (RS). [See online article for color version of this figure.]
Figure 6.
Figure 6.
Reciprocal grafting of ir-hspro and wild-type seedlings and determination of seedling biomass during root colonization by P. indica. A, Scheme of the grafting combinations used. B to D, Determination of the fresh biomass of total seedlings, shoots, and roots was performed with a microbalance after 19 d of seedling growth on the plate system. One way-ANOVA with Tukey’s post-hoc test (wild type versus ir-hspro during P. indica colonization); *, P < 0.05; **, P < 0.01; ***, P < 0.001 (n = 18–20; bars = ±se).

Similar articles

Cited by

References

    1. Achatz B, Kogel KH, Franken P, Waller F. (2010) Piriformospora indica mycorrhization increases grain yield by accelerating early development of barley plants. Plant Signal Behav 5: 1685–1687 - PMC - PubMed
    1. Allmann S, Halitschke R, Schuurink RC, Baldwin IT. (2010) Oxylipin channelling in Nicotiana attenuata: lipoxygenase 2 supplies substrates for green leaf volatile production. Plant Cell Environ 33: 2028–2040 - PubMed
    1. Baena-González E, Sheen J. (2008) Convergent energy and stress signaling. Trends Plant Sci 13: 474–482 - PMC - PubMed
    1. Baldwin IT, Morse L. (1994) Up in smoke 2: germination of Nicotiana attenuata in response to smoke-derived cues and nutrients in burned and unburned soils. J Chem Ecol 20: 2373–2391 - PubMed
    1. Baldwin IT, Preston CA. (1999) The eco-physiological complexity of plant responses to insect herbivores. Planta 208: 137–145

Publication types

MeSH terms