. 2012 Sep;35(7):555-69.
doi: 10.1097/CJI.0b013e31826a73de.

Induction of antitumor immunity ex vivo using dendritic cells transduced with fowl pox vector expressing MUC1, CEA, and a triad of costimulatory molecules (rF-PANVAC)

Affiliations

Induction of antitumor immunity ex vivo using dendritic cells transduced with fowl pox vector expressing MUC1, CEA, and a triad of costimulatory molecules (rF-PANVAC)

Baldev Vasir et al. J Immunother. 2012 Sep.

Abstract

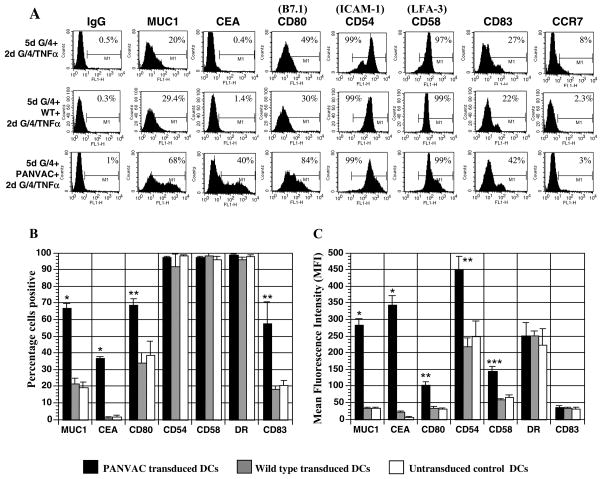
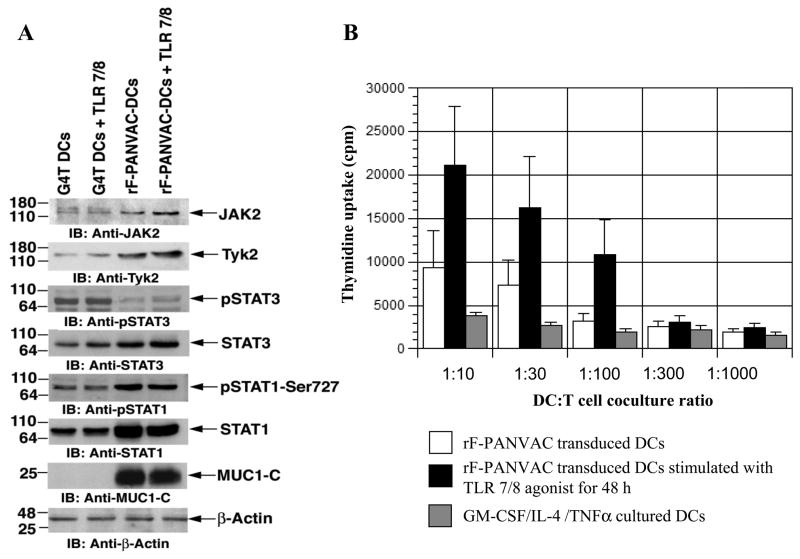
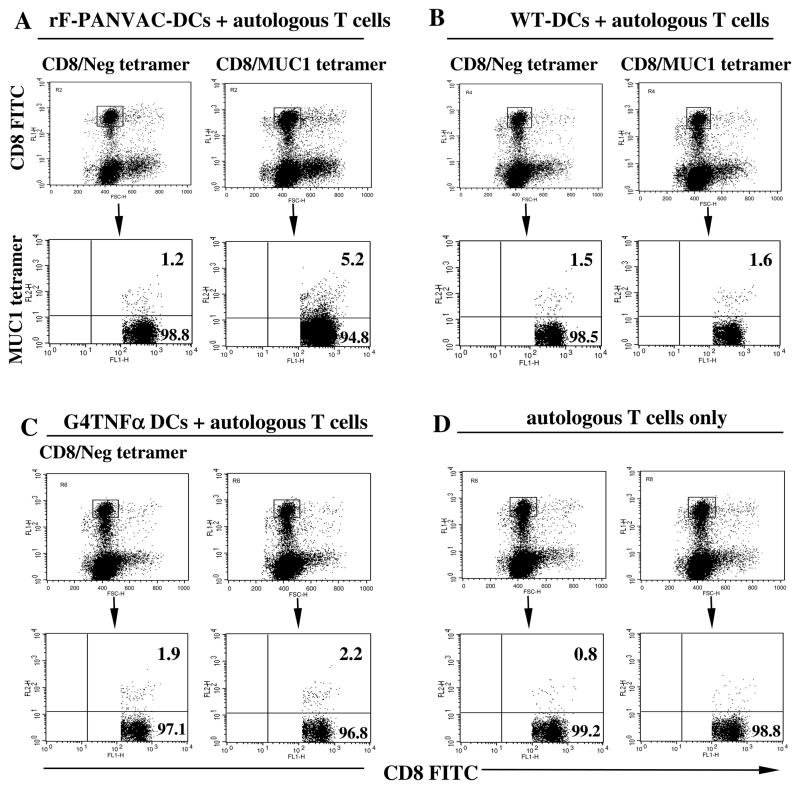
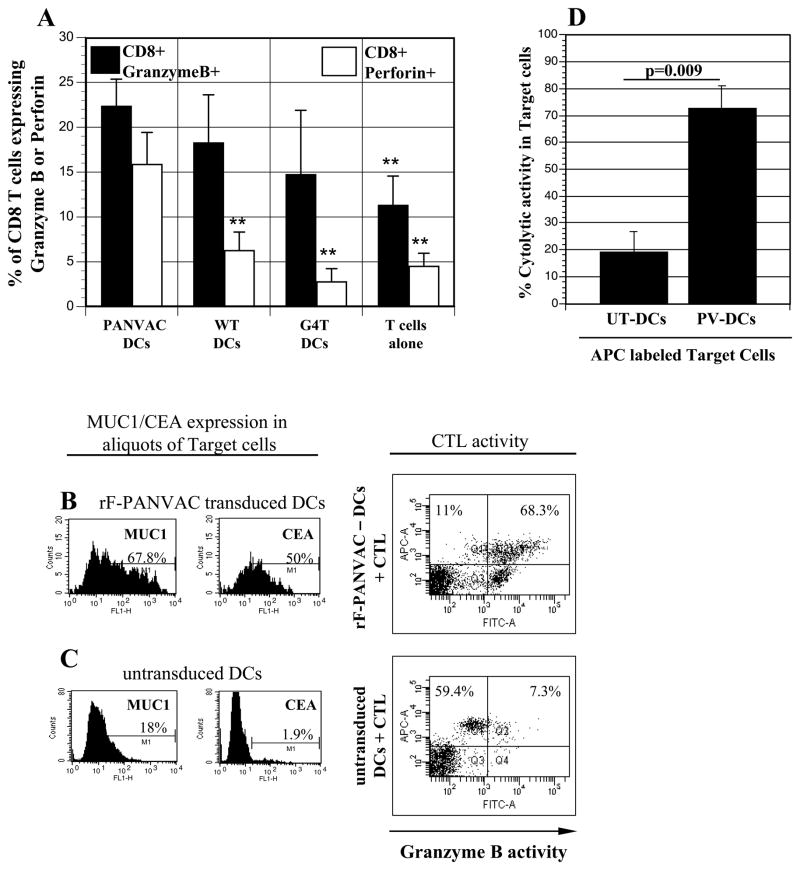
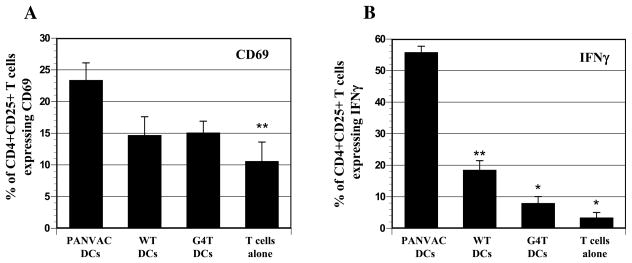
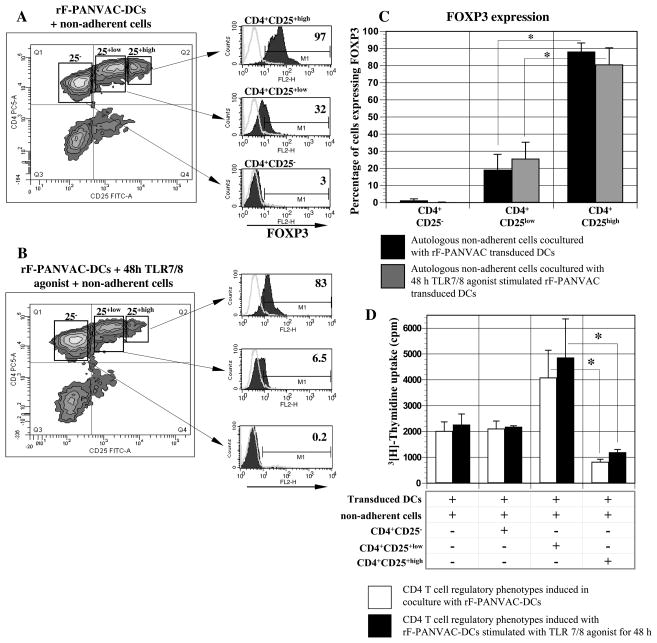
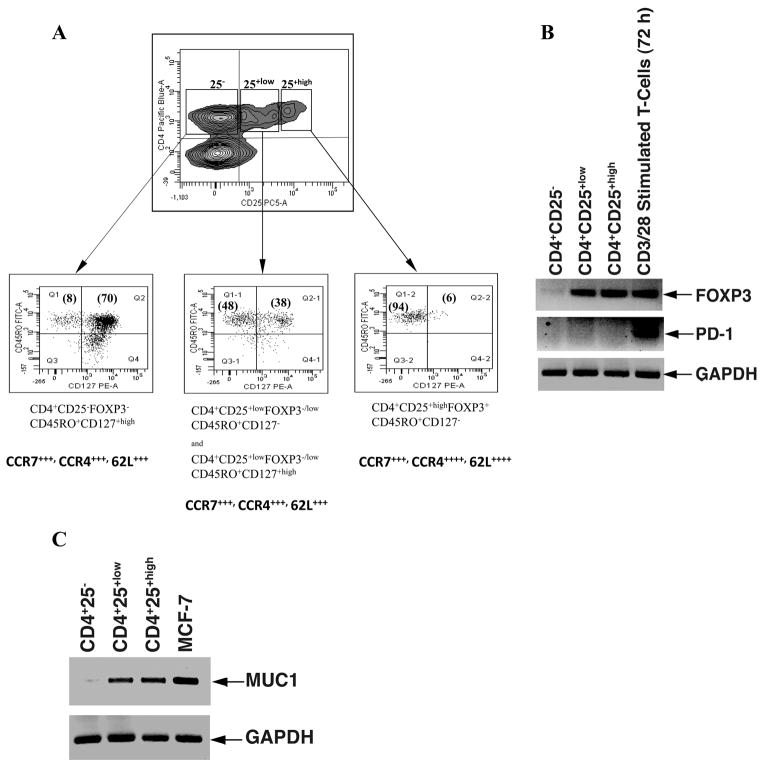
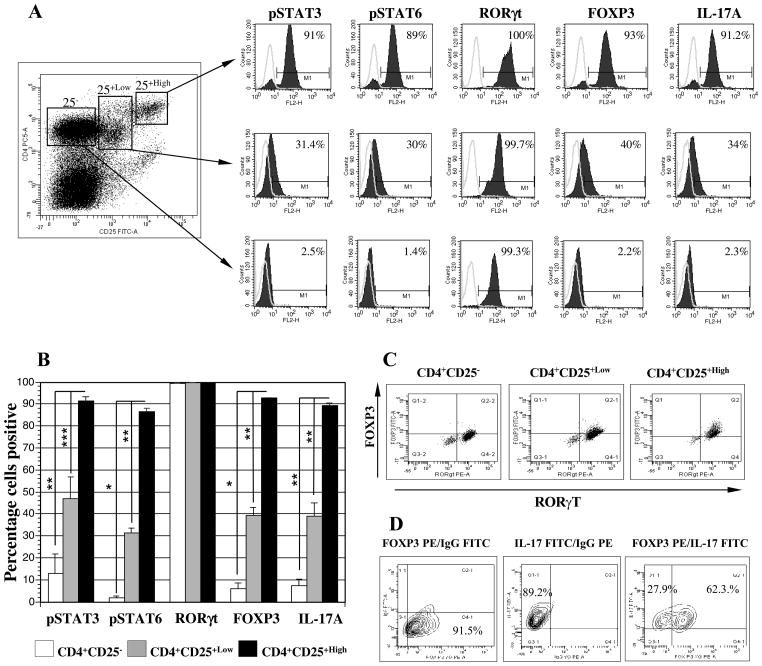
The fowl pox vector expressing the tumor-associated antigens, mucin-1 and carcinoembryonic antigen in the context of costimulatory molecules (rF-PANVAC) has shown promise as a tumor vaccine. However, vaccine-mediated expansion of suppressor T-cell populations may blunt clinical efficacy. We characterized the cellular immune response induced by ex vivo dendritic cells (DCs) transduced with (rF)-PANVAC. Consistent with the functional characteristics of potent antigen-presenting cells, rF-PANVAC-DCs demonstrated strong expression of mucin-1 and carcinoembryonic antigen and costimulatory molecules, CD80, CD86, and CD83; decreased levels of phosphorylated STAT3, and increased levels of Tyk2, Janus kinase 2, and STAT1. rF-PANVAC-DCs stimulated expansion of tumor antigen-specific T cells with potent cytolytic capacity. However, rF-PANVAC-transduced DCs also induced the concurrent expansion of FOXP3 expressing CD4CD25 regulatory T cells (Tregs) that inhibited T-cell activation. Moreover, Tregs expressed high levels of Th2 cytokines [interleukin (IL)-10, IL-4, IL-5, and IL-13] together with phosphorylated STAT3 and STAT6. In contrast, the vaccine-expanded Treg population expressed high levels of Th1 cytokines IL-2 and interferon-γ and the proinflammatory receptor-related orphan receptor γt (RORγt) and IL-17A suggesting that these cells may share effector functions with conventional TH17 T cells. These data suggest that Tregs expanded by rF-PANVAC-DCs, exhibit immunosuppressive properties potentially mediated by Th2 cytokines, but simultaneous expression of Th1 and Th17-associated factors suggests a high degree of plasticity.


Figures

Figure 1
Figure 1. Expression of MUC1, CEA, costimulatory, adhesion and maturation markers on fowlpox transduced and untransduced dendritic cells
(A) Expression of, MUC1, CEA, CD80 (B7.1), CD54 ICAM-1), CD58 (LFA-3), and CD83 by rF-PANVAC-DCs, FP-WT-DCs and untransduced DCs was quantified by flow cytometric analysis. Depicted is a representative FACS analysis for each set. (B and C) Mean percentage (± SEM) of cells expressing the indicated marker and the corresponding mean fluorescence intensity (MFI) is presented. (* p < 0.001; ** p < 0.01; *** p < 0.05).
Figure 2
Figure 2. Expression of Tyk2, JAK2, STAT3, STAT1 proteins and autologous T cell proliferative response to rF-PANVAC-DCs and untranduced DCs
(A) rF-PANVAC-DCs differentiated in the presence or absence of a TLR7/8 agonist for 48 h were harvested, lysed and underwent Western Blot analysis to assess expression of Tyk2, JAK2, STAT3, STAT1 proteins, the phosphorylated forms of STAT1 (pSTAT1) and STAT3 (pSTAT3) and MUC1-C. β-actin antibody was utilized as a loading control. Western blot analysis was also performed for untransduced DCs, untransduced DCs cultured with a TLR7/8 agonist. Depicted are representative results obtained from two independent experiments using DCs generated from different donors. G4T: GM-CSF/IL-4/TNFα cultured DCs; G4T DCs+TLR 7/8: GM-CSF/IL-4/TNFα cultured DCs stimulated for 48 h with TLR 7/8 agonist; rF-PANVAC-DCs: rF-PANVAC transduced DCs; rF-PANVAC-DCs+TLR7/8: rF-PANVAC transduced DCs stimulated for 48 h with TLR 7/8 agonist. (B) rF-PANVAC-DCs and untransduced DCs differentiated in the presence or absence of a TLR7/8 agonist were cocultured with enriched autologous T cells at the indicated DC:T cell ratios. T cell proliferation was determined after 5 days of coculture by incorporation of 3[H] Thymidine (1 μCi/well) added to cocultures 18 h prior to harvesting. T cell proliferation was measured as cpm. Bar graph data (mean cpm ± SEM) is representative of three separate experiments.
Figure 3
Figure 3. Expansion of CD8+MUC1 tetramer+ T cells following stimulation with rF-PANVAC-DCs
(A–D) HLA*0201 autologous nonadherent cells were co-cultured with rF-PANVAC-DCs, FP-WT-DCs, or untransduced DCs for five days. CD8+ T cells were analyzed for binding with the MUC1 tetramer or a control tetramer. Unstimulated enriched autologous T cells were analyzed in parallel as controls. Numbers in the upper quadrant of the indicated bi-dimensional dot plots represent the percentage of dual positive CD8+ MUC1 tetramer+ T cells. Dot blot analysis shows representative results obtained from two independent experiments using DCs generated from different donors.
Figure 4
Figure 4. Cytolytic capacity of expanded T cells following autolgous T cell coculture with rF-PANVAC-DCs
(A) Autologous non-adherent cells were cocultured for 5 days with rF-PANVAC-DCs, rF-WT-DCs, or untransduced DCs at a T:DC ratio of 10:1. T cells alone were cultured and analyzed in parallel. The cells were harvested and CD4+ T cells were positively selected by magnetic bead separation. Bar graphs depicting the mean percentage (± SEM) of CD8+T cells expressing Granzyme B or Perforin from 5 separate experiments. (B–C) Autologous T cells were cultured with rF-PANVAC-DCs or untransduced DCs for 5 days and thereafter enriched using nylon wool columns. rF-PANVAC-DCs and untransduced DCs autologous to enriched T cells were prepared separately and used as target cells in a cell-based fluorogenic cytotoxicity assay. An aliquot of transduced and untransduced DCs were examined for the expression of MUC1 and CEA as shown in the left panel of the figure. Target cells were labeled by a fluorescent dye projecting in the FL-3 channel and co-incubated with enriched autologous T cells in a 5:1 ratio in the presence of a fluorogenic granzyme B substrate. Cell-mediated cytotoxicity results in the uptake of granzyme B by target cells and is detected by the presence of the fluorogenic granzyme B substrate in the FL-1 channel (upper right quadrant) as shown in this representative plot. The proportion of transduced or untransduced DCs targeted by autologous CTLs is calculated as the number of cells in the upper right quadrant divided by the sum of upper left and upper right quadrants. (D) The histograms depict the mean (± SEM) cytolytic activity of three separate experiments of transduced and untransduced DCs by expanded autologous T cells. UT-DCs: untransduced DCs; PV-DCs: panvac transduced DCs (rF-PANVAC-DCs). (** p < 0.01 as compared to rF-PANVAC-DCs).
Figure 5
Figure 5. Expression of CD69 and IFNγ by CD4+CD25+ T cells following stimulation with transduced and untransduced DCs
(A) The histograms depict the mean percentage of CD4+CD25+ T cells that coexpress the activation marker, CD69 from 5 separate experiments (± SEM). (B) Positively selected CD4+ T cells were stained with CD25-FITC, fixed and permeabilized followed by incubation with PE-conjugated IFNγ or matching isotype controls and analyzed by bi-dimensional flow cytometry. Bar graph shows the mean percentage (± SEM) of CD4+CD25+ T cells expressing IFNγ from 5 separate experiments. (* p<0.001; ** p<0.01 as compared to PANVAC transduced DCs).
Figure 6
Figure 6. Expression of FOXP3 and suppressive function of CD4+CD25, CD4+CD25+low, and CD4+CD25+high T cells T cells stimulated by rF-PANVAC-DCs
Autologous non-adherent cells were cocultured with rF-PANVAC-DCs or untransduced DCs in the presence or absence of TLR7/8 agonist at a T:DC ratio of 10:1. After 5 days of coculture, the cells were harvested and incubated with anti-CD4 TC and anti-CD25 FITC. (A & B) T cells were separated into CD4+CD25, CD4+CD25+low, and CD4+CD25+high fractions by bi-dimensional FACS sorting as shown in representative dot plots. Cells then underwent intracellular staining for FOXP3. (C) Mean percentage (± SEM) of CD4+CD25, CD4+CD25+low, and CD4+CD25+high regulatory T cell phenotypes expressing FOXP3 from 3 separate experiments. (D) The capacity of the sorted T cell fractions to suppress T cell proliferation was then determined. rF-PANVAC transduced DCs and transduced DCs exposed to TLR7/8 agonist were cocultured with non-adherent autologous cells in the presence or absence of CD4+CD25, CD4+CD25+low, or CD4+CD25+high T cells in an overall DC:T cell ratio of 1:10. T cell proliferation was quantified after 4 days culture by uptake of [3H]Thymidine (1 μCi [0.037 MBq] per well) following overnight pulsing. Bar graph represents the mean cpm (±SEM) of 3 separate experiments. (* p <0.001).
Figure 7
Figure 7. Expression of CD127 and mRNA transcripts for FOXP3, PD-1 and MUC1 in CD4+CD25, CD4+CD25+low, and CD4+CD25+high T cells
rF-PANVAC-DCs were cocultured with autologous non-adherent cells for 5 days. Cells were harvested and labeled with anti-CD4 Pacific Blue and anti-CD25 PC5, anti-CD45RO FITC and anti-CD127 PE. CD4+ T cells were segregated into CD4+CD25, CD4+CD25+low, and CD4+CD25+high fractions as shown in a representative dot plot. Each of the segregated populations of cells was isolated by gating as shown and further analyzed for the presence of CD45RO+ and CD127+ surface markers. In a separate set of experiments, T cells were harvested from the co-culture and labeled with anti-CD4 TC, anti-CD25 FITC, and anti-CCR7 PE, anti-CCR4 PE or anti-62L PE. (A) CD4+ T cells were segregated into three populations of CD4+CD25, CD4+CD25+low, and CD4+CD25+high and the percentage of these gated isolated cells positive for each of the chemokine and L-select in surface markers was determined. Dot blot analysis shows representative results obtained from two independent experiments using DCs generated from different donors. Numbers in parentheses in the dot plot quadrants indicate the percentage of dual positive cells for the appropriate surface markers. ++++ represents > 90% and +++ > 80% of the cells positive for the indicated markers. (B) RT-PCR for mRNA for FOXP3 and PD-1 and (C) MUC1 for each of the fractions of CD4+ T cells. Enriched T cells stimulated for 48h with CD3/CD28 antibodies was used as controls. MCF7 breast carcinoma cell line was used as positive control for MUC1 as shown. Data is representative of 3 independent experiments.
Figure 8
Figure 8. Enhanced expression of phosphorylated STAT3 and STAT6 and RORγt, FOXP3 and IL-17A in isolated CD4+CD25+high regulatory T cells
rF-PANVAC-DCs were cocultured with autologous non-adherent cells at a 1:10 ratio for 5 days. 3 h prior to harvesting, the cells were treated with 1ug/ml of GolgiPlug, after which the cells were harvested, labeled with anti-CD4 Pacific Blue and anti-CD25 PC5 and segregated into CD4+CD25, CD4+CD25+low and CD4+CD25+high fractions by FACS Aria sorting as shown in a representative dot plot. (A) Each of the segregated populations of CD4+ T cells were fixed, permeabilized and subjected to intracellular staining with the appropriate antibody and its matching isotype control and thereafter analyzed on a single FL2-H channel. Histogram peaks are depicted with an overlay of the matching isotype control for the appropriate antibody. Percentage numbers shown in histogram boxes indicate positive cells for the appropriate marker. (B) The bar graphs show the mean (± SEM) percentage positive cells for three separate experiments. (C) In a separate set of experiments, the cells were labeled with anti-CD4 Pacific Blue and anti-CD25 PC5, fixed and permeabilized and than intracellulary labeled with FITC-conjugated FOXP3 and PE-conjugated RORγt in parallel with matching isotype controls and subjected to four color analysis by FACSAria sorter. CD4+ T cells were segregated into three populations of CD4+CD25, CD4+CD25+low, and CD4+CD25+high, isolated by gating and analyzed to determine the percentage of dual expressing FOXP3 and RORγt T cells. Numbers in quadrants of the dot plot indicate the percentage of positive cells for the appropriate marker. Dot plots represent similar results obtained from two separate experiments. (D) In a set of three separate experiments, CD4+CD25+high fraction was segregated following coculture with autologous rF-PANVAC-DCs and stained with PE-conjugated FOXP3 and FITC-conjugated IL-17 antibodies. A representative contour plot is depicted showing single FOXP3 and IL-17 with the appropriate IgGs and a dual color stain depicting the presence of dual FOXP3 and IL-17 positive cells. (* p < 0.001; ** p < 0.01; *** p < 0.05).

Similar articles

Cited by

References

    1. Tsang KY, Palena C, Yokokawa J, et al. Analyses of recombinant vaccinia and fowlpox vaccine vectors expressing transgenes for two human tumor antigens and three human costimulatory molecules. Clin Cancer Res. 2005;11:1597–1607. - PubMed
    1. Kass E, Schlom J, Thompson J, et al. Induction of protective host immunity to carcinoembryonic antigen (CEA), a self-antigen in CEA transgenic mice, by immunizing with a recombinant vaccinia-CEA virus. Cancer Res. 1999;59:676–83. - PubMed
    1. Marshall JL, Gulley JL, Arlen PM, et al. Phase I study of sequential vaccinations with fowlpox-CEA(6D)-TRICOM alone and sequentially with vaccinia-CEA(6D)-TRICOM, with and without granulocyte-macrophage colony-stimulating factor, in patients with carcinoembryonic antigen-expressing carcinomas. J Clin Oncol. 2005;23:720–731. - PubMed
    1. Kudo-Saito C, Hodge JW, Kwak H, et al. 4-1BB ligand enhances tumor-specific immunity of poxvirus vaccines. Vaccine. 2006;24:4975–4986. - PMC - PubMed
    1. Kaufman HL, Kim-Schulze S, Manson K, et al. Poxvirus-based vaccine therapy for patients with advanced pancreatic cancer. J Transl Med. 2007;5:60. - PMC - PubMed

Publication types

MeSH terms