. 2012 Sep 12;31(18):3730-44.
doi: 10.1038/emboj.2012.226. Epub 2012 Aug 14.

Cacnb4 directly couples electrical activity to gene expression, a process defective in juvenile epilepsy

Affiliations

Cacnb4 directly couples electrical activity to gene expression, a process defective in juvenile epilepsy

Abir Tadmouri et al. EMBO J. .

Abstract

Calcium current through voltage-gated calcium channels (VGCC) controls gene expression. Here, we describe a novel signalling pathway in which the VGCC Cacnb4 subunit directly couples neuronal excitability to transcription. Electrical activity induces Cacnb4 association to Ppp2r5d, a regulatory subunit of PP2A phosphatase, followed by (i) nuclear translocation of Cacnb4/Ppp2r5d/PP2A, (ii) association with the tyrosine hydroxylase (TH) gene promoter through the nuclear transcription factor thyroid hormone receptor alpha (TRα), and (iii) histone binding through association of Cacnb4 with HP1γ concomitantly with Ser(10) histone H3 dephosphorylation by PP2A. This signalling cascade leads to TH gene repression by Cacnb4 and is controlled by the state of interaction between the SH3 and guanylate kinase (GK) modules of Cacnb4. The human R482X CACNB4 mutation, responsible for a form of juvenile myoclonic epilepsy, prevents association with Ppp2r5 and nuclear targeting of the complex by altering Cacnb4 conformation. These findings demonstrate that an intact VGCC subunit acts as a repressor recruiting platform to control neuronal gene expression.


Conflict of interest statement

The authors declare that they have no conflict of interest.

Figures

Figure 1
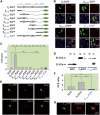
Figure 1
Presence of β4 in the nucleus of neurons. (A) Immunohistochemical confocal images of 20 μm coronal sections of adult wt (upper panels) or lh (lower panels) mice brains showing the distribution of endogenous β4 in the dentate gyrus (green, left panels). Neuronal nuclei were labelled with NeuN (blue, middle panels). Right panels illustrate merged images. The inserts show × 5 images of the CA3 region (initially × 20). (B) Western blots of adult wt and lh mice brain lysates indicating the presence of β4 only in wt mice. Actin staining was used as an internal control. (C) β4 immunoblotting from cytoplasmic and nuclear fractions of adult wt mice brain. β-Tubulin and nucleolin are used as indicators of nuclear and cytoplasmic fraction purities, respectively. (D) EM image of an ultrathin cryosection of the CA1 hippocampal region showing the intranuclear presence of β4 labelled with antibody-coated 15 nm gold particles. Black and white arrows indicate the position of gold particles associated to heterochromatin and euchromatin, respectively. (E) Confocal images of hippocampal neurons from embryonic E18 mice brains in primary culture at 5 DIV (left panels) and 18 DIV (right panels). Green: immunocytochemical staining of β4; red: membrane staining with concanavalin A (ConA) conjugated to rhodamine; blue: nuclear staining with ToPro3. (F) DIV-dependent evolution of β4 NCR values in neurons (n=50 cells for each data point). (G) Nuclear density of β4 in hippocampal neurons at 5 and 18 DIV as assessed by EM (n=28 and 20 nuclei, respectively). (H) Confocal images of NG108.15 cells 1 day before (−1 DIV) and 13 days (13 DIV) after induction of neuronal differentiation with 1 mM cAMP and serum reduction. Colour code is as in (E). Differentiated NG108-15 cells have larger nuclei than non-differentiated cells. (I) Mean NCR values expressed in percent as a function of culture time in vitro. DIV 0 represents the induction time of neuronal differentiation.
Figure 2
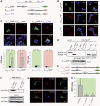
Figure 2
Nuclear targeting and structural integrity of β4 are disrupted by the human juvenile epilepsy mutation. (A) Schematic representation of different truncated β4 constructs in pEGFP-C1. The β1–481-EGFP mutant is also shown. (B) Confocal images of CHO cells expressing some representative constructs, including β4-EGFP and mutant β1–481-EGFP. Expression time is 24 h after transfection. (C) Mean NCR values of EGFP fluorescence for each condition in transfected CHO cells. ***P≤0.01. (D) Western blot detecting EGFP in nuclear and cytoplasmic fractions of CHO cells after 2 days of transfection with EGFP, β4-EGFP or β1–481-EGFP. Cytoplasmic β1–481-EGFP is less stable than cytoplasmic β4-EGFP, as witnessed by the presence of lower molecular weight bands. These truncated constructs are deficient in nuclear accumulation as shown in (C), possibly because containing GK domains. (E) Confocal images of hippocampal neurones transfected at 7 DIV with β1–481-EGFP (upper panels) or β4-EGFP (lower panels). Images were acquired at 9 DIV on β-tubulin III-positive cells. (F) NCR values for each construct. ***P⩽0.01. (G) Confocal images of hippocampal neurons transfected with β1–481-EGFP showing the comparative distribution of endogenous β4 (red) and exogenous β1–481-EGFP (green).
Figure 3
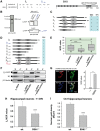
Figure 3
The SH3/GK interaction is required for β4 nuclear localization. (A) EGFP- or myc-tagged β4-truncated constructs used for confocal microscopy and co-immunoprecipitation experiments. (B) Confocal images of CHO cells transfected with individual constructs. (C) Confocal images of CHO cells expressing β1–166-EGFP with β200–519-myc, or β1–166-EGFP with β200-481-myc (upper panels). Mean NCR values of EGFP or anti-myc fluorescence summarizing the effect of the co-expressions on nuclear localization (lower panels). ***P⩽0.001. (D) Immunoprecipitation experiments in CHO cells investigating the association of β1–166-EGFP with β200–519-myc or β200–481-myc. Left panel: immunoprecipitation via anti-myc antibodies and western blot of EGFP, except first lane showing β4-EGFP expression level in cell lysates. Right panel: western blot with polyclonal anti-β antibody (Bichet et al, 2000) indicating equivalent β200–519-myc and β200–481-myc immunoprecipitation levels. β1–166-EGFP expression confirmed by cell EGFP fluorescence. (E) Schematic representation of βL125P-EGFP, β1–166-L125P-EGFP and βP225R-EGFP mutants. (F) Lack of co-immunoprecipitation shows the absence of β200–519-myc/β1–166-L125P-EGFP interaction. Expression of β1–166-EGFP and β200–519-myc was verified by the cell fluorescence and western blot as in (D). (G) Confocal images of hippocampal neurons showing the cytoplasmic localization of βL125P-EGFP and βP225R-EGFP. Cells were transfected for 48 h at 6 DIV. (H) Mean NCR values for β4-EGFP, βL125P-EGFP and βP225R-EGFP fluorescence in hippocampal neurons. ***P⩽0.001.
Figure 4
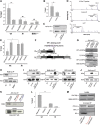
Figure 4
B56δ/β4 interaction contributes to β4 nuclear localization. (A) Yeast two-hybrid results indicating the interaction level of β4 and β1–481 with B56δ as a function of time (left). The interactions were scored as the ratio of β-galactosidase activity to His prototrophy. Schematic representation of mouse B56δ showing the NLS amino-acid sequence (right). The position of seven HEAT repeats is shown by homology with B56γ (Magnusdottir et al, 2009). (B) Co-immunoprecipitation experiments determining the interaction between β4-EGFP or β1-481-EGFP with B56δ-myc in HEK293 cells. Left panel: expression of B56δ-myc was confirmed by western blot (Mr 69 kDa). Right panel: pull-down with anti-myc antibody, and western blot with anti-EGFP antibody. (C) Interactions of β isoforms with B56δ and HP1γ in yeast two-hybrid assay. (D) Interactions of truncated and mutated β4 constructs with B56δ using yeast two-hybrid assay. (E) Effect of B56δ shRNA and control shRNA on the NCR value of β4-EGFP in CHO cells. ***P⩽0.001; NS, P⩾0.1. (F) Effect of B56δ shRNA and control shRNA on the nuclear/cytoplasmic distribution of β4-EGFP in CHO cells, as assessed by WB. Histone H3 and β-tubulin are used as markers of the nucleus (N) and cytoplasm (C), respectively. Performed in duplicate. Average ratios of 4.2±0.32 (β4-EGFP) and 0.97±0.81 (β4-EGFP+shRNA B56δ). (G) Confocal images showing the cell distribution of endogenous β4 in undifferentiated NG108.15 cells in the absence or presence of B56δ-myc (left panels). B56δ-myc was transfected 24 h before confocal imaging. Panels in green present the endogenous β4 detected with an anti-β4. Mean NCR values showing that B56δ-myc induces the redistribution of endogenous β4 to the nucleus (right panel). ***P⩽0.001. (H) Mean NCR values of endogenous β4 from wt and B56δ−/− hippocampal neurons at 11 DIV. ***P⩽0.001. (I) Average immunogold-labelled endogenous β4 in nuclei from pyramidal neurons from wt and B56δ−/− mice hippocampus measured by EM (n=36 and 51 nuclei, respectively). ***P⩽0.001. Control counts in lh hippocampus were 0.51±0.36 gold particles/μm2.
Figure 5
Figure 5
β4 association to B56δ/PP2A is inhibited by channel expression and activated by membrane depolarization. (A) β4 immunoprecipitates B56δ and PP2A from wt mice brain but not from lh or B56δ−/− mice as shown by western blots. (B) Left panel: immunoprecipitation of endogenous PP2A by B56δ-myc or β4-myc±B56δ-EGFP expressed in HEK293 cells. Right panel: similar experiments using β1–481-myc±B56δ-EGFP. (C) Endogenous PP2A phosphatase activity associated to immunoprecipitated β4-myc±B56δ-EGFP expressed in HEK293 cells. Dephosphorylation of p-nitrophenyl phosphate (pNPP), a generic phosphatase substrate, was measured by absorbance of the metabolite at 405 nm. Experiment in duplicate. (D) Confocal images of HEK293 cells 2 days after transfection with β4-EGFP together with Cacna1a and Cacna2d2 subunits (VGCC) (left panel). Mean NCR values of EGFP fluorescence in various transfection conditions (n=50 for each condition, right panel). (E) Western blot analysis of β4-EGFP subunit immunoprecipitated by B56δ-myc±VGCC expressed in HEK293 cells. Control IP represents precipitation in absence of anti-myc antibodies. (F) Western blot analysis of B56δ-EGFP immunoprecipitated by β4-myc (left panels) or β1–481-myc (right panels) expressed in HEK293 cells together with VGCC, without or with a 30-min depolarization by 140 mM KCl. (G) Effect of HEK293 membrane depolarization (140 mM KCl, 30 min) on β4-myc or β1–481-myc complex formation with PP2A in the presence of B56δ-EGFP and VGCC. (H) Mean NCR values of β4 immunofluorescence in wt or B56δ−/− hippocampal neurons at 18 DIV (control or 1 μM TTX). TTX was added at 11 DIV in the culture media (n=50 for each condition). (I) Effect of a 1-h application of 40 μM biccuculine and 400 μM 4-AP on average β4 NCR value in wt and B56δ−/− hippocampal neurons. NS, non significant; ***P<0.001.
Figure 6
Figure 6
β4 regulates gene expression by interacting with a transcription factor. (A) Histogram showing upregulated (in red) and downregulated (in green) genes displaying a >2-fold change in lh versus wt cerebellum mRNA levels as detected with transcriptomic probe sets. (B) qRT–PCR experiments showing upregulation of TH, TAC1, KLB and downregulation of BC031748 and RIF1 in lh versus wt cerebellum. Mean±s.d. of three experiments performed in triplicate. Data were normalized using three housekeeping genes (glyceraldehyde 3-phosphate dehydrogenase, transferin receptor and peptidylprolyl isomerase A). (C) Agarose gel of representative ChIP assay on hippocampal neurons at 1 or 18 DIV with anti-β4 antibodies. (D) TH promoter immunoprecipitation in presence or absence (control) of anti-β4 antibodies, expressed as percentage of input, from wt or lh mice brain (n=4–22, left panel). ***P<0.001. (E) Yeast two-hybrid results indicating the interaction level of β4 with TRα as a function of time (upper panel). The interactions were scored as the ratio of β-galactosidase activity to His prototrophy. Schematic representation of mouse TRα showing the localization of the DNA Binding Domain (DBD) and the Ligand Binding Domain (LBD) (lower panel). (F) Western blot analysis of TRα-EGFP immunoprecipitated by β4-myc expressed in HEK293 cells. (G) TH promoter immunoprecipitation by anti-TRα antibodies, expressed as percentage of input, from wt, lh or B56δ−/− mice brain (n=4–20, left panel). ***P<0.001. (H) Schematic representation of the luciferase reporter system under the control of TH promoter (upper panel). Luciferase expression measured in the absence and presence of T3 in HEK293 cells transfected with the luciferase reporter alone or together with TRα±β4 (lower panel). An everted repeat type 6 TRE is present in the promoter region of TH gene (TGGCCTTGCCTGAGGCCA) at position −341 to −323.
Figure 7
Figure 7
Association of β4 to HP1γ and histones requires B56δ. (A) TH promoter immunoprecipitation by anti-B56δ antibodies, expressed as percentage of input, from wt, lh or B56δ−/− mice brain (n=2–8). **P<0.05. (B) TH promoter immunoprecipitation by anti-PP2A antibodies, expressed as percentage of input, from wt mice brain (n=12). **P<0.05. (C) Western blot of H3 and H3 Ser10P in HEK293 cells expressing β4-myc alone or with B56δ-EGFP. (D) Mass spectrometry data showing dephosphorylation of the phosphorylated N-terminal histone H3 peptide (amino acids 5–13 phosphorylated on Ser10) by β4-myc immunoprecipitated from HEK293 cells, co-transfected with B56δ-EGFP and PP2A-HA. (E) TH promoter immunoprecipitation by anti-Ser10P H3 or anti-H3 antibodies, expressed as percentage of input, from wt or lh mice brain (n=3–22). *P<0.1. (F) Schematic representation of β4c and β4 illustrating the localization of the HP1γ binding motif (critical residues are shadowed). (G) Western blot of HP1γ-EGFP following immunoprecipitation by anti-myc antibodies from HEK293 cells expressing various combinations of HP1γ-EGFP, B56δ-EGFP and β4-myc. (H) Immunoprecipitation of histone H3 from wt, lh or B56δ−/− brain by anti-β4 antibodies. (I) Immunoprecipitation of H3, H2B and H4 histones from HEK293 cells by β4-myc in the absence or presence of B56δ-EGFP. Control: immunoprecipitation in non-transfected cells (NT). (J) Immunoprecipitation of histone H3 in HEK293 cells by B56δ-myc in the absence or presence of β4-EGFP. (K) Lack of co-immunoprecipitation of histone H4 and B56δ-myc in HEK293 cells in the presence of βL125P-EGFP or β1–481-EGFP mutants. (L) TH promoter immunoprecipitation by anti-HP1γ antibodies, expressed as percentage of input, from wt or lh mice brain (n=4–14). **P<0.05. (M) Mutation of the HP1γ binding motif prevents β4-myc association to histone H3 in the presence of B56δ-EGFP.
Figure 8
Figure 8
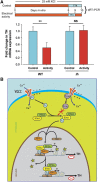
Experimental validation and schematic illustration of the novel excitation-transcription pathway mediated by β4. (A) Electrical activity reduces TH mRNA levels in primary cultures of cerebellar granule neuronal from wt mice but not from lh mice. Upper panel represents the experimental protocol. First condition in which TTX is added for 2 days (8–10 DIV) is used as control condition without electrical activity (blue colour), whereas second condition in which TTX is washed out at 9 DIV is used as the condition in which electrical activity is restored (red colour). Lower panel illustrates the fold-change in TH mRNA level induced by electrical activity using rpl27 as housekeeping gene and normalization to control condition. **P<0.05. (B) Schematic representation of the new signalling pathway and of the defective steps produced by the epileptic truncation of β4.

References

    1. Ahn JH, McAvoy T, Rakhilin SV, Nishi A, Greengard P, Nairn AC (2007) Protein kinase A activates protein phosphatase 2A by phosphorylation of the B56delta subunit. Proc Natl Acad Sci USA 104: 2979–2984 - PMC - PubMed
    1. Arikkath J, Campbell KP (2003) Auxiliary subunits: essential components of the voltage-gated calcium channel complex. Curr Opin Neurobiol 13: 298–307 - PubMed
    1. Beguin P, Mahalakshmi RN, Nagashima K, Cher DH, Ikeda H, Yamada Y, Seino Y, Hunziker W (2006) Nuclear sequestration of beta-subunits by Rad and Rem is controlled by 14-3-3 and calmodulin and reveals a novel mechanism for Ca2+ channel regulation. J Mol Biol 355: 34–46 - PubMed
    1. Bengzon J, Hansson SR, Hoffman BJ, Lindvall O (1999) Regulation of norepinephrine transporter and tyrosine hydroxylase mRNAs after kainic acid-induced seizures. Brain Res 842: 239–242 - PubMed
    1. Bichet D, Cornet V, Geib S, Carlier E, Volsen S, Hoshi T, Mori Y, De Waard M (2000) The I-II loop of the Ca2+ channel alpha1 subunit contains an endoplasmic reticulum retention signal antagonized by the beta subunit. Neuron 25: 177–190 - PubMed

MeSH terms