. 2012:8:602.
doi: 10.1038/msb.2012.34.

Quantitative measurement of allele-specific protein expression in a diploid yeast hybrid by LC-MS

Affiliations

Quantitative measurement of allele-specific protein expression in a diploid yeast hybrid by LC-MS

Zia Khan et al. Mol Syst Biol. 2012.

Abstract

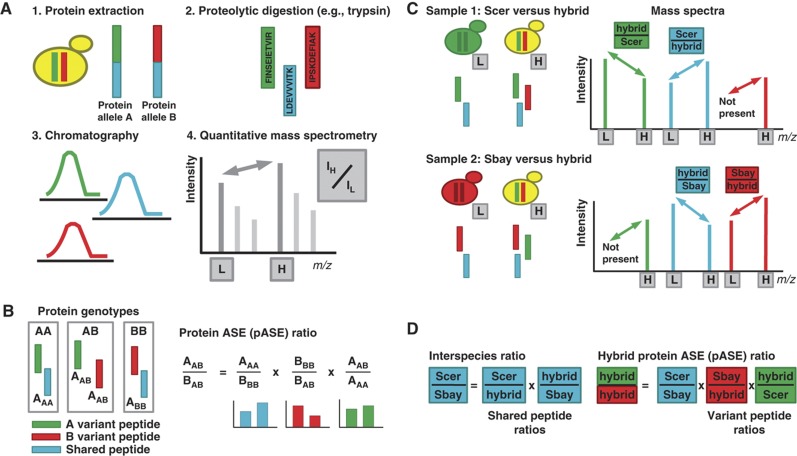
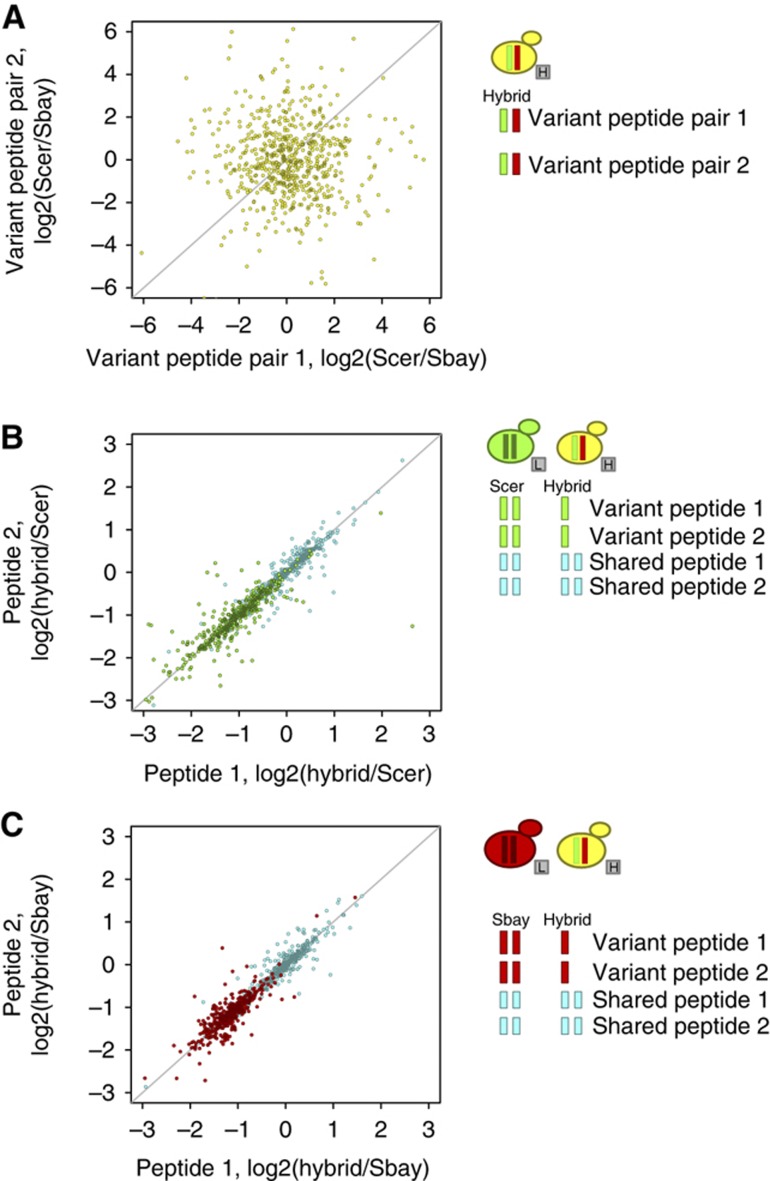
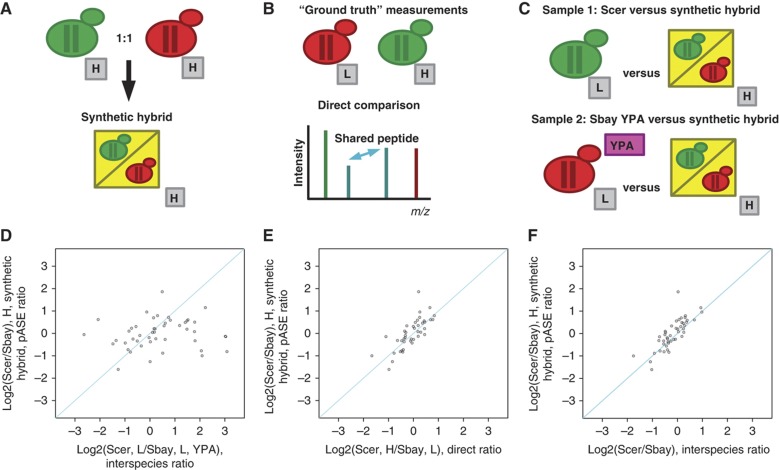
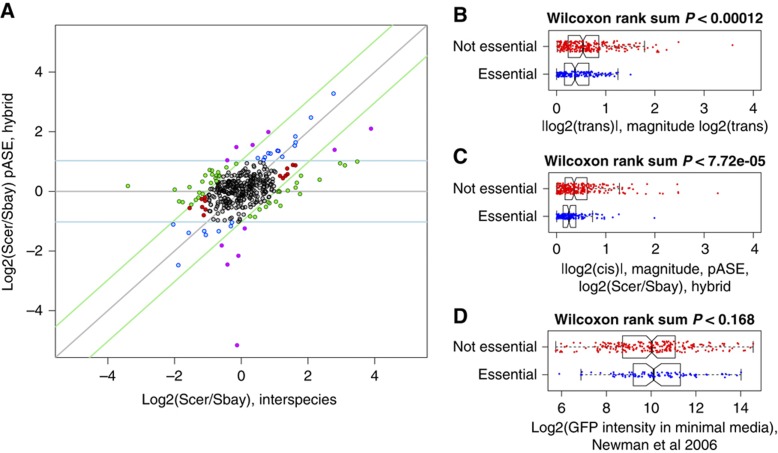
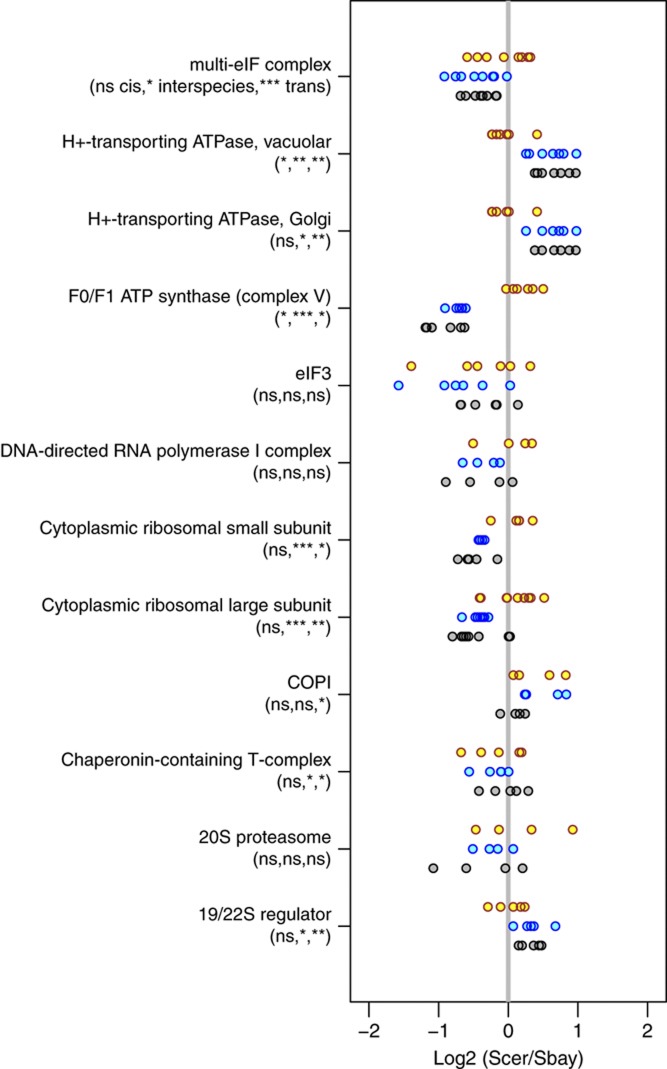
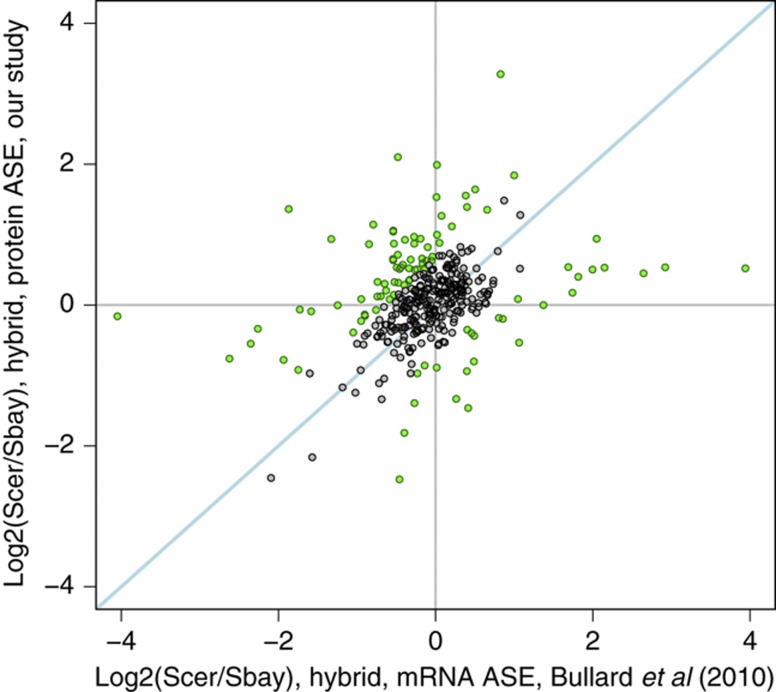
Understanding the genetic basis of gene regulatory variation is a key goal of evolutionary and medical genetics. Regulatory variation can act in an allele-specific manner (cis-acting) or it can affect both alleles of a gene (trans-acting). Differential allele-specific expression (ASE), in which the expression of one allele differs from another in a diploid, implies the presence of cis-acting regulatory variation. While microarrays and high-throughput sequencing have enabled genome-wide measurements of transcriptional ASE, methods for measurement of protein ASE (pASE) have lagged far behind. We describe a flexible, accurate, and scalable strategy for measurement of pASE by liquid chromatography-coupled mass spectrometry (LC-MS). We apply this approach to a hybrid between the yeast species Saccharomyces cerevisiae and Saccharomyces bayanus. Our results provide the first analysis of the relative contribution of cis-acting and trans-acting regulatory differences to protein expression divergence between yeast species.


Conflict of interest statement

The authors declare that they have no conflict of interest.

Figures

Figure 1
Figure 1
Measuring protein allele-specific expression (pASE) by liquid chromatography-coupled mass spectrometry (LC-MS). (A) Main experimental steps of protein sample analysis by LC-MS. Protein alleles are extracted from a heterozygous diploid. These alleles may have amino-acid subsequences that are in common (cyan) and subsequences that allow allele A (green) and allele B (red) to be distinguished. The extracted proteins are proteolytically digested by an enzyme such as trypsin. The resulting peptides originate from allele A or allele B (red or green, variant peptides), or they will originate from shared amino-acid sequence (cyan, shared peptides). These three classes of peptides are separated by chromatography. Last, they are analyzed by quantitative mass spectrometry strategies that allow accurate measurement of ratios between a stable isotope labeled, heavy (H), and an unlabeled, light (L) sample through peptides with the same underlying sequence. (B) Our experimental strategy for measuring protein ASE in an AB heterozygous diploid by LC-MS relies on the availability of protein samples from AA and BB homozygotes for the protein of interest. After proteolytic digestion, peptides can be classified as follows: A variant peptides (green), B variant peptides (red), and shared peptides (cyan). Our approach assures that only peptides with the same sequence are compared to derive a ratio between peptides with differing sequence. The approach is based on the observation that variant peptides and shared peptides in the homozygous samples are in a one-to-one ratio. A and B designate the expression level of each allele. The corresponding subscript designates the expression level of each allele under each protein genotype. Note that AAA and BBB terms cancel in the right of the equation, leaving only the protein ASE ratio. Colors of the bar plots below designate which peptide is used to compute the ratio. (C) We used a quantitative proteomics strategy where the interspecies hybrid (yellow) was heavy isotope labeled (heavy, H) and each of the parental species S. cerevisiae (Scer, green) and S. bayanus (Sbay, red) were not labeled (light, L). The hybrid sample was split and combined one-to-one with each parental sample to generate two LC-MS data sets. To the right are example spectra for two protein alleles with both variant peptides (red and green) and shared peptides (cyan). Heavy and light doublets, with an expected isotope shift, are always present for shared peptides, but they are present for variant peptides only when the corresponding allele matches the parental species sample. The peak heights, quantified through LC-MS chromatographic peak areas, are used to derive the protein ASE ratio. (D) The mass spectra provide the necessary ratios for the computation of an interspecies expression ratio and, subsequently, a within hybrid pASE ratio (compare with B in this figure).
Figure 2
Figure 2
Accuracy of protein allele-specific expression (pASE) measurements. (A) Direct comparison of the log2 ratios of chromatographic peak areas computed from two variant peptide pairs from the interspecies hybrid. (B) The log2 ratios of chromatographic peak areas measured between two distinct shared peptides (cyan) and S. cerevisiae (Scer) variant peptides (green) for the hybrid versus Scer sample. Each point corresponds to 404 proteins from technical replicate 1 for which pASE measurements were derived and two or more distinct shared and variant peptides were quantified. (C) The same plot for the hybrid versus S. bayanus (Sbay) sample for Sbay variant peptides (red) and shared peptides (cyan). The peptides compared are illustrated to the right. H, heavy and L, light reflect the isotope label that allows the two samples to be differentiated within an LC-MS data set.
Figure 3
Figure 3
Accuracy of protein allele-specific expression (pASE) measurements using a ‘synthetic hybrid.’ (A) We combined a 1:1 mixture of protein samples from heavy, H, labeled parental strains, S. cerevisiae (Scer, green) and S. bayanus (Sbay, red), grown in minimal labeling media to create a ‘synthetic hybrid’ protein sample (yellow) from which we measured ‘mock’ pASE ratios using our method. (B) The resulting ‘mock’ pASE ratios were compared with ‘ground-truth’ interspecies expression ratios obtained from an independent experiment in which S. cerevisiae was heavy, H, labeled in minimal media and compared with an unlabeled, L, protein sample from S. bayanus grown in unlabeled minimal media. The ‘ground-truth’ interspecies expression ratios were obtained from paired peak heights generated by peptides shared between the two species. (C) Instead of using unlabeled parental samples grown under the same conditions as internal standards (e.g., Figure 1C), we used a pair of internal standards where the S. bayanus standard was grown in rich media with acetate, instead of glucose, as a carbon source (YPA). This design assured that the interspecies ratios, computed by normalizing out the ‘synthetic hybrid’ (e.g., Figure 1D, left), reflected both a species and condition effect; they were uncorrelated with the ‘ground-truth’ measurements. Thus, any ratios used to compute ‘mock’ pASE ratios (e.g., Figure 1D, right) were uncorrelated with the ‘ground-truth’ ratios obtained by direct comparison of the strains. (D) Scatterplot of ratios, derived by normalizing out the contribution of the ‘synthetic hybrid,’ on the x axis and the pASE ratios from the ‘synthetic hybrid’ on the y axis. (E) Scatterplot of ‘mock’ pASE ratios from the synthetic hybrid (y axis) with the corresponding ‘ground-truth’ interspecies ratios (x axis). (F) A second set of ‘ground-truth’ measurements plotted with the synthetic hybrid pASE ratios. This second set of ‘ground-truth’ interspecies ratios, from unlabeled S. cerevisiae and S. bayanus samples both grown in minimal media, was obtained in our previous experiment by normalizing out the contribution of the interspecies hybrid (e.g., Figure 1C and D).
Figure 4
Figure 4
Protein expression divergence attributable to cis- and trans-regulatory variation. (A) Plot of protein allele-specific expression (pASE) in the hybrid and the corresponding expression ratios between the parental strains S. cerevisiae (Scer) and S. bayanus (Sbay). Blue points highlight proteins where the interspecies expression divergence is to cis-effects, green points highlight proteins were the divergence is primarily attributable to trans-effects, and purple points highlight proteins where the protein expression divergence is due to both cis-effects and trans-effects. Red points designate proteins with significant interspecies differences, but no significant cis-effect (pASE difference) or trans-effect (off diagonal component). Gray points designate proteins that are conserved, with no significant cis- or trans-effect. Diagonal light green lines designate empirically determined 5% FDR log2-fold cutoffs for significant trans-effects. Horizontal light blue lines designate empirically determined 5% FDR log2-fold cutoffs for significant cis-effects. (B) Distribution of |log2(trans)| the magnitude protein expression divergence attributable to trans-regulatory variation and (C) the distribution of |log2(cis)| the magnitude protein expression divergence attributable to cis-regulatory variation for essential genes (blue points) and non-essential genes (red points). (D) GFP intensity in minimal media measurements from (Newman et al, 2006) divided by essential and non-essential for the same proteins shown in (B) and (C). In each of the boxplots, center line designates the median, ends of boxes designate quartiles, whiskers designate 1.5 times the interquartile range for the respective quartile, and notches designate the ∼95% confidence interval of the median. Essential genes were obtained from Giaever et al (2002).
Figure 5
Figure 5
Coordination of protein allele-specific expression (pASE) measurements. Interspecies ratios between the S. cerevisiae (Scer) and S. bayanus parental species (blue points), pASE ratios within the hybrid (yellow points), and the corresponding trans-effect (gray points) grouped by known protein complex. Only complexes with four or more subunits quantified are shown. Complexes were obtained from a curated set by Pu et al (2009). The notation below the complex name designates the statistical significance of the coordination of the expression ratios. The coordination was measured by the standard deviation of the log2 ratios. P-values were computed by permuting the expression ratios to generate a null distribution over the standard deviation of complexes with the same number of measured subunits. The results of the permutation tests are listed as follows: (cis-effects/pASE, interspecies ratios, trans-effects) where ns designates not significant; *P<0.05; **P<0.01; ***P<0.001.
Figure 6
Figure 6
Comparative analysis of steady-state mRNA allele-specific expression (ASE) and our protein ASE measurements. mRNA ASE measurements were obtained from a recent study (Bullard et al, 2010) of an interspecies hybrid between S. cerevisiae and S. bayanus, the same two species we analyzed. A total of 358 proteins had both mRNA ASE and protein ASE measurements. The Spearman’s correlation for this data is 0.373, and the Pearson’s correlation is 0.331. Green points designate proteins that may reflect cis-acting post-transcriptional regulatory divergence.

References

    1. Aebersold R, Mann M (2003) Mass spectrometry-based proteomics. Nature 422: 198–207 - PubMed
    1. Bullard JH, Mostovoy Y, Dudoit S, Brem RB (2010) Polygenic and directional regulatory evolution across pathways in Saccharomyces. Proc Natl Acad Sci 107: 5058–5063 - PMC - PubMed
    1. Cowles CR, Hirschhorn JN, Altshuler D, Lander ES (2002) Detection of regulatory variation in mouse genes. Nat Genet 32: 432–437 - PubMed
    1. Damerval C, Maurice A, Josse JM, de-Vienne D (1994) Quantitative trait loci underlying gene product variation: a novel perspective for analyzing regulation of genome expression. Genetics 137: 289–301 - PMC - PubMed
    1. DeVeale B, van der Kooy D, Babak T (2012) Critical evaluation of imprinted gene expression by RNA-Seq: a new perspective. PLoS Genet 8: e1002600. - PMC - PubMed

Publication types

MeSH terms

Substances