. 2012:8:604.
doi: 10.1038/msb.2012.35.

Dissecting sources of quantitative gene expression pattern divergence between Drosophila species

Affiliations

Dissecting sources of quantitative gene expression pattern divergence between Drosophila species

Zeba Wunderlich et al. Mol Syst Biol. 2012.

Abstract

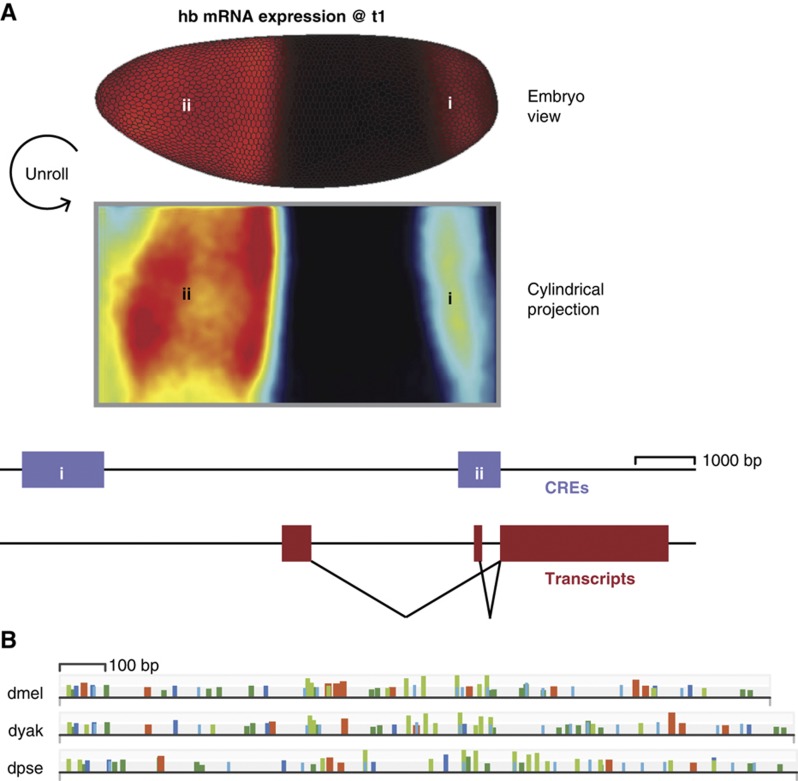
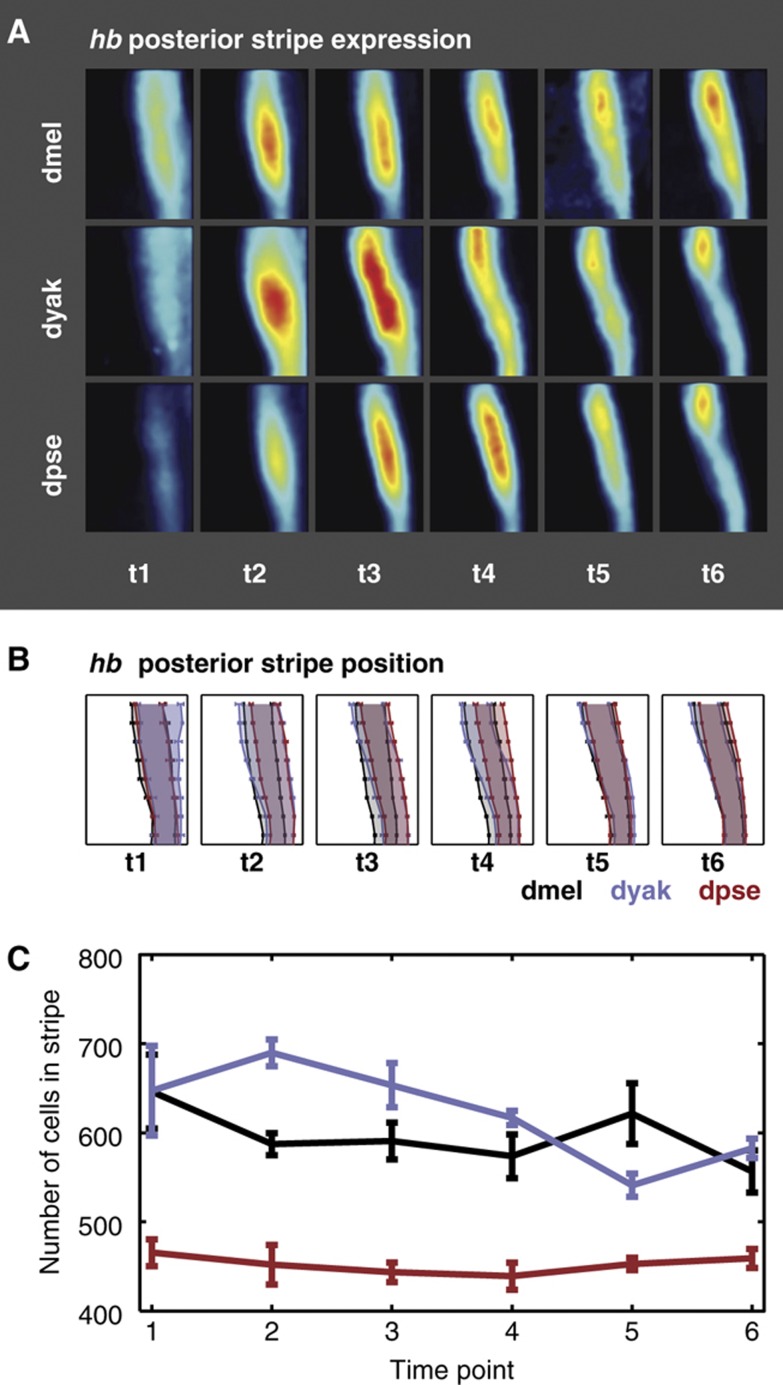
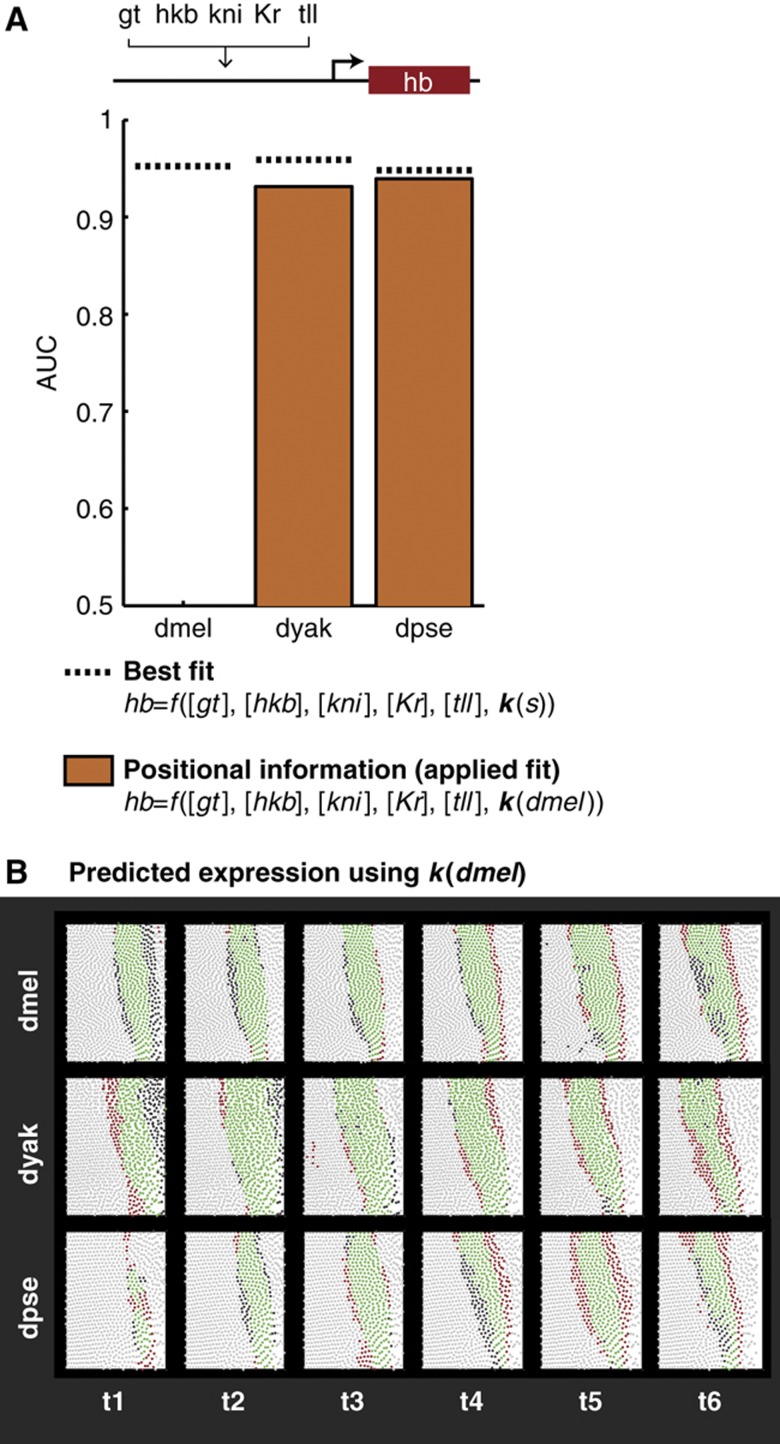
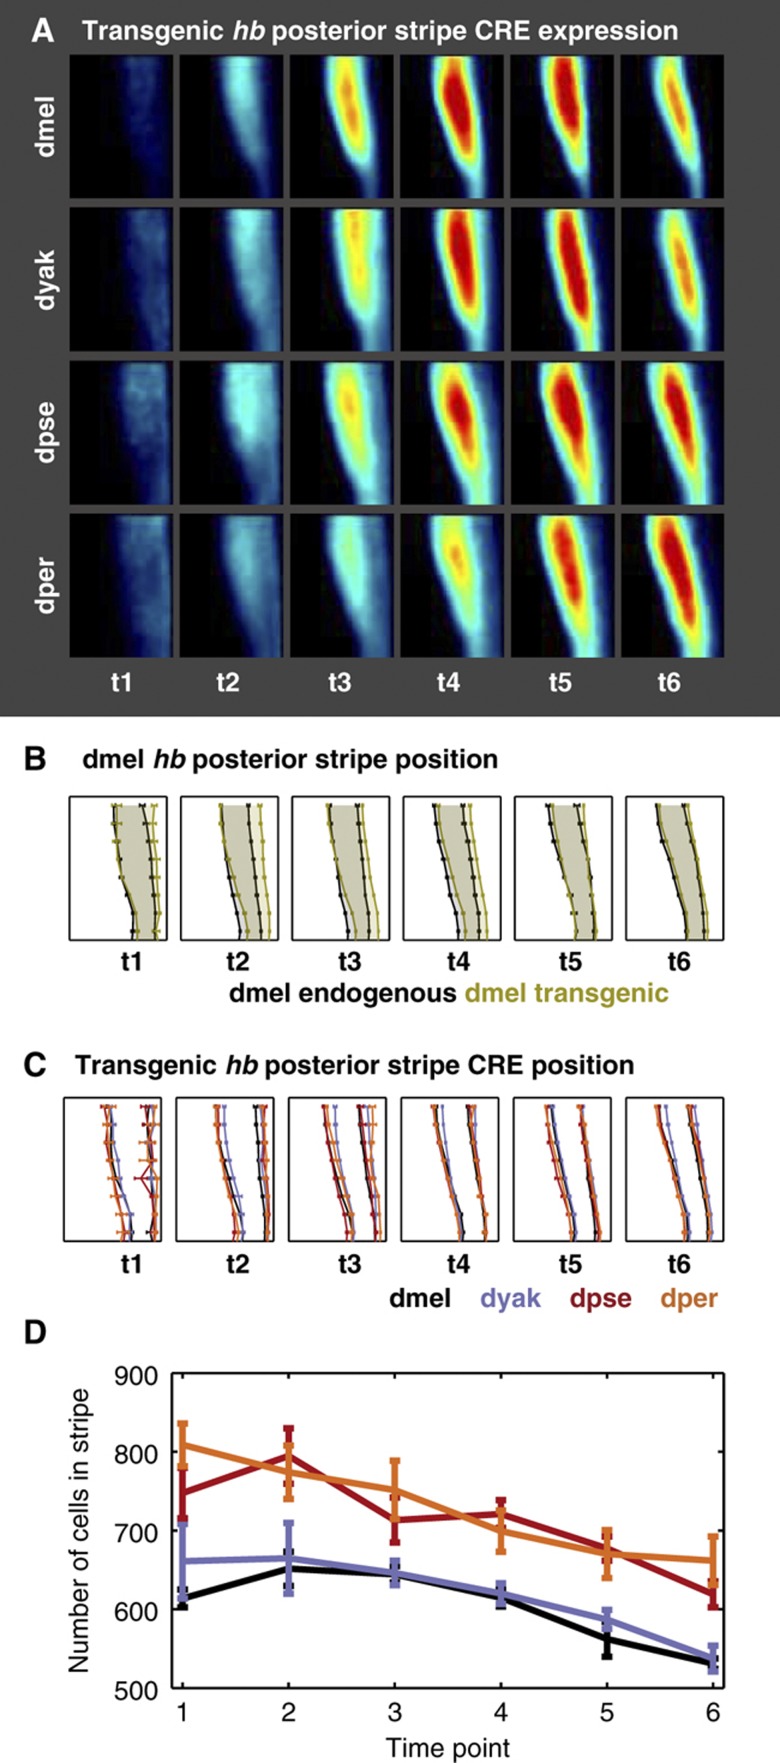
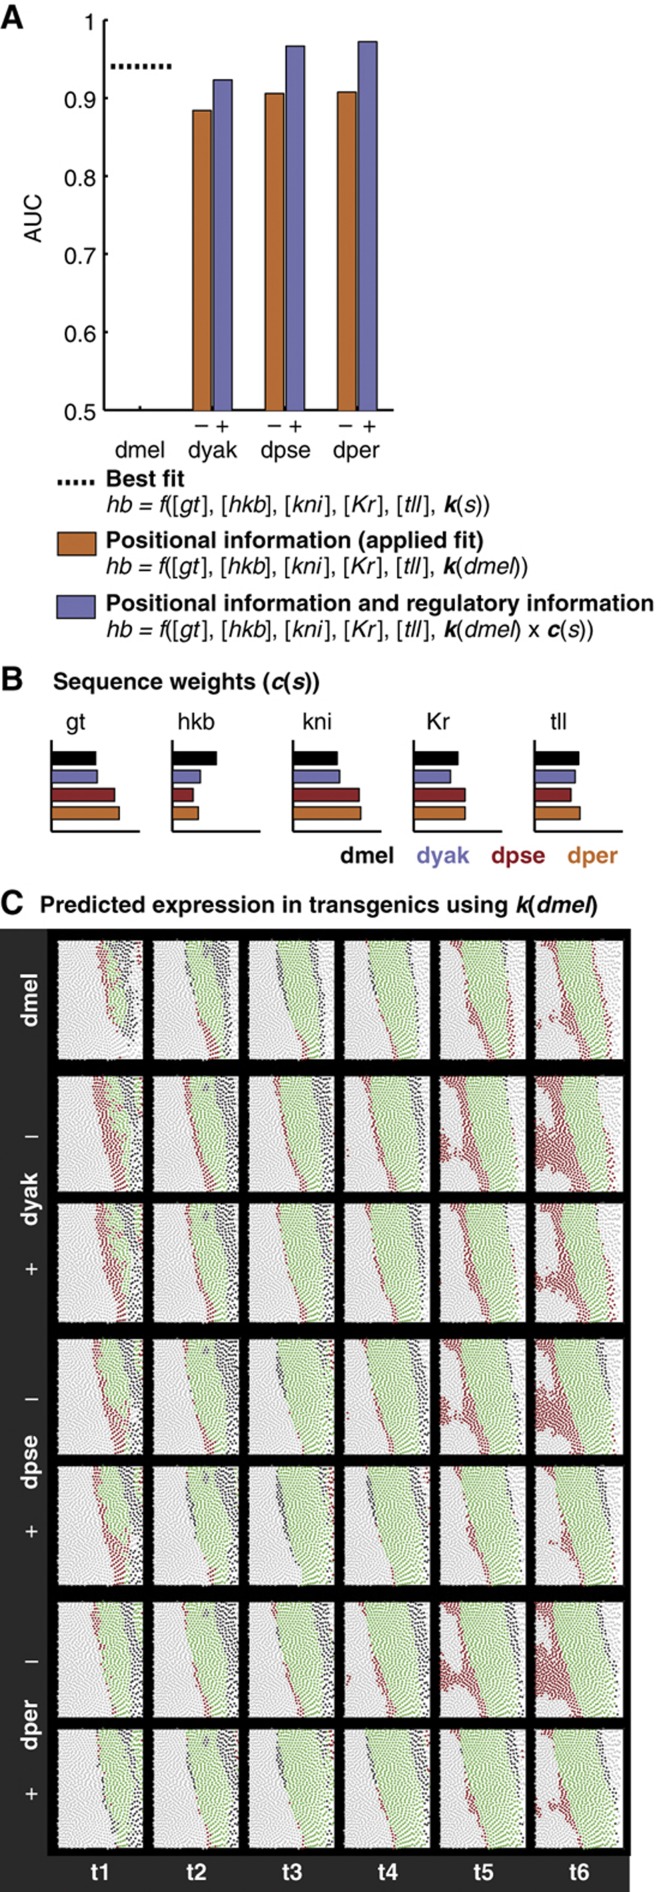
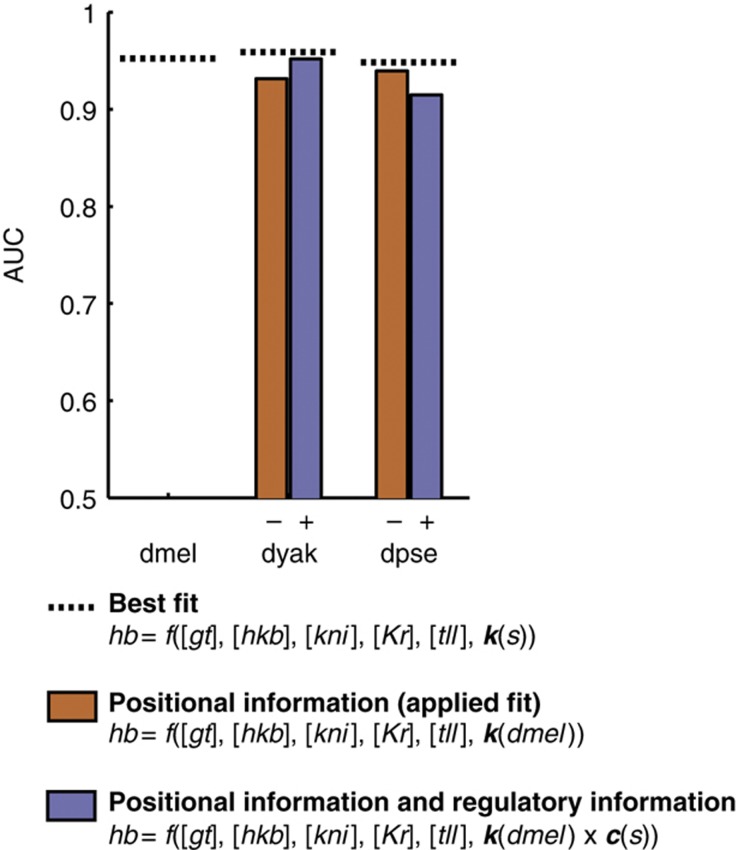
Gene expression patterns can diverge between species due to changes in a gene's regulatory DNA or changes in the proteins, e.g., transcription factors (TFs), that regulate the gene. We developed a modeling framework to uncover the sources of expression differences in blastoderm embryos of three Drosophila species, focusing on the regulatory circuit controlling expression of the hunchback (hb) posterior stripe. Using this framework and cellular-resolution expression measurements of hb and its regulating TFs, we found that changes in the expression patterns of hb's TFs account for much of the expression divergence. We confirmed our predictions using transgenic D. melanogaster lines, which demonstrate that this set of orthologous cis-regulatory elements (CREs) direct similar, but not identical, expression patterns. We related expression pattern differences to sequence changes in the CRE using a calculation of the CRE's TF binding site content. By applying this calculation in both the transgenic and endogenous contexts, we found that changes in binding site content affect sensitivity to regulating TFs and that compensatory evolution may occur in circuit components other than the CRE.


Figures

Figure 1
Figure 1
The two spatial domains of the hb expression pattern are driven by two CREs. (A) hb is expressed in a broad anterior domain and a posterior stripe in blastoderm-age embryos. We show two views of the dmel hb mRNA expression pattern at the first time point from the dmel atlas (Fowlkes et al, 2008). On top is a rendering in a typical dorsolateral embryo view, where expression is in red with brightness proportional to level. On bottom is a cylindrical projection, where high expression is in red and low expression is in blue. In both views, anterior is to the left and dorsal is up. Below the expression patterns, we show the structure of the hb locus, with regulatory elements in purple and transcripts in red. The expression pattern is controlled by two CREs, one driving the anterior domain (ii) and one driving the posterior stripe (i). The two hb transcript isoforms are functionally identical, and both transcripts contribute to both spatial expression domains (Margolis et al, 1995). (B) The binding site content of the hb posterior stripe CRE varies between species. We plot the predicted TF binding sites of hb’s regulators in the sequences of orthologous hb posterior stripe CREs from D. melanogaster (dmel), D. yakuba (dyak), and D. pseudoobscura (dpse) (see Materials and methods). hkb sites are highlighted in orange and tll, kni, Kr, and gt sites are shown as light blue, dark blue, light green, and dark green rectangles, respectively. The height of the rectangle is proportional to binding site strength and the width of the rectangle is proportional to the length of the binding site.
Figure 2
Figure 2
hb patterns differ between three Drosophila species. (A) The hb posterior stripe expression pattern diverges between three species. We show the average expression patterns in the posterior 36% of embryos for the endogenous hb pattern in dmel, dyak, and dpse, at six time points spanning the hour of blastoderm-stage development. The panels are oriented with the anterior end to the left and the dorsal side on the top, and the levels are indicated by the color, where black is no expression and red is high expression. The shape and dynamics of the hb posterior stripe expression pattern vary between the three species. (B) The average hb posterior stripe boundary locations vary between species at early time points. We plot the average boundary locations of the hb posterior stripe in percentage egg length. The panels are oriented in the same manner as (A). Average boundary positions are shown for dmel in black, dyak in purple, and dpse in red, for six time points. Error bars denote the standard error of the mean. (C) The average number of cells in the hb posterior stripe varies between species at all time points. We plot the average number of cells in the hb posterior stripe for dmel, dyak, and dpse for six time points. Error bars denote the standard error of the mean. dpse embryos have fewer total cells than dmel and dyak embryos. Therefore, the number of cells in the dpse hb posterior stripe is much smaller than in dyak and dmel stripes, even though its size as a fraction of egg length is similar. Source data is available for this figure in the Supplementary information.
Figure 3
Figure 3
A linear model fits endogenous hb expression patterns with high accuracy. (A) Changes in positional information account for a large portion of hb expression pattern divergence. Here, we show the results of fitting a multiple linear regression model to the endogenous hb pattern in each species (dotted line, best fit) and by fitting to dmel and applying the resulting coefficients to the hb patterns in dyak and dpse (orange bars, positional information). Performance of the model was measured using the area under the ROC curve (AUC), and the results are plotted for the species in order or increasing phylogenetic distance from dmel. (B) Differences in the hb expression pattern can be explained using a common parameter set. We show the detailed results of the positional information model, using k(dmel). For the sake of visualization, we found a threshold for each species that yielded an 80% true positive rate. This corresponds to a single point on the ROC curve that we integrated to calculate the AUC scores shown in (A). Each circle in the subpanels corresponds to a cell, with green and light gray circles corresponding to correct predictions in which the cell is on (green) or off (light gray) in the experimental data. The red and dark gray cells correspond to incorrect predictions, in which the cell is off (red) or on (dark gray) in the experimental data.
Figure 4
Figure 4
Orthologous CREs drive similar, but not identical expression patterns in transgenic dmel lines. (A) Expression patterns driven by orthologous hb posterior stripe CREs vary quantitatively. We show the average lacZ expression pattern in the posterior 36% of transgenic flies using the same conventions as Figure 2A. These patterns are measured in transgenic dmel lines containing the hb posterior stripe CRE from each of four species, driving a lacZ reporter. (B) The transgenic and endogenous dmel hb posterior stripe patterns are not identical. A comparison of the stripe boundary locations of the endogenous and transgenic hb posterior stripe indicate that the patterns are different, particularly at early time points. Here, we plot the average stripe boundary position for the dmel endogenous (black) and transgenic (olive) patterns, relative to total egg length, for six time points. The error bars show the standard error of the mean. (C) The transgenic hb posterior stripe boundary locations vary subtly between species. We plot the average boundary locations of the hb posterior stripe CRE in percentage egg length. Average boundary positions are shown for the dmel CRE in black, dyak in purple, and dpse in red, and dper in orange, for six time points. Error bars denote the standard error of the mean. (D) The average number of cells in the hb posterior stripe varies between some species at all time points. We plot the average number of cells in the hb posterior stripe CRE for dmel, dyak, dpse, and dper CREs for six time points. Error bars denote the standard error of the mean. This plot shows that a change in boundary position of ∼1% egg length corresponds to a change of ∼100 cells contained within the stripe. Source data is available for this figure in the Supplementary information.
Figure 5
Figure 5
The addition of sequence weights improves the fit of a linear model to the transgenic data. (A) Including CRE sequence information improves the fit of the linear model to the transgenic expression pattern. We show the results of fitting a multiple linear regression model to the transgenic line expressing lacZ under the control of the dmel hb posterior stripe CRE and applying the resulting coefficients to the other transgenic lines (orange bars, positional information). Adding a sequence weight, a scaling parameter that accounts for the differences in binding site content of the different posterior stripe CREs, improves the fit of the model to the data (purple bars, regulatory logic). (B) Sequence weights for the hb posterior stripe CRE. We plot the sequence weight for each TF and CRE, which roughly corresponds to the total binding potential for each TF along the CRE. The sequence weights are normalized so that they are 1 in dmel (black bars). (C) The addition of the sequence weight lowers the false positive predication rate. As in Figure 3, we visualize the results of the model at the 80% true positive rate. In each sub-panel, each circle corresponds to a cell, with the color indicating whether or not the model is correct. Green circles are cells that are correctly predicted to be on, light gray circles are cells that are correctly predicted to be off. Red circles are cells that are incorrectly predicted be to on, and dark gray circles are cells that are incorrectly predicted to be off. For each species, excluding dmel, we show the model performance without (−, top row) and with (+, bottom row) the sequence weight.
Figure 6
Figure 6
The addition of the sequence weight improves endogenous dyak predictions. We show the results of fitting a multiple linear regression model to the endogenous hb pattern using a species-specific parameter vector k(s) (dotted line, best fit), the dmel parameter vector (orange bars, positional information), the dmel parameter vector and sequence weights (purple bars, regulatory information). The addition of a sequence weight improves the model fit in dyak and worsens the model fit in dpse.

Similar articles

Cited by

References

    1. Ardehali MB, Lis JT (2009) Tracking rates of transcription and splicing in vivo. Nat Struct Mol Biol 16: 1123–1124 - PubMed
    1. Arnosti DN, Barolo S, Levine M, Small S (1996) The eve stripe 2 enhancer employs multiple modes of transcriptional synergy. Development 122: 205–214 - PubMed
    1. Ashyraliyev M, Siggens K, Janssens H, Blom J, Akam M, Jaeger J (2009) Gene circuit analysis of the terminal gap gene huckebein. PLoS Comput Biol 5: e1000548. - PMC - PubMed
    1. Barolo S (2012) Shadow enhancers: frequently asked questions about distributed cis-regulatory information and enhancer redundancy. Bioessays 34: 135–141 - PMC - PubMed
    1. Ben-Tabou de-Leon S, Davidson EH (2007) Gene regulation: gene control network in development. Annu Rev Biophys Biomol Struct 36: 191. - PubMed

MeSH terms