

Glyoxalase 1 and glyoxalase 2 activities in blood and neuronal tissue samples from experimental animal models of obesity and type 2 diabetes mellitus
- PMID: 22893478
- PMCID: PMC10717385
- DOI: 10.1007/s12576-012-0224-9
Glyoxalase 1 and glyoxalase 2 activities in blood and neuronal tissue samples from experimental animal models of obesity and type 2 diabetes mellitus
Abstract
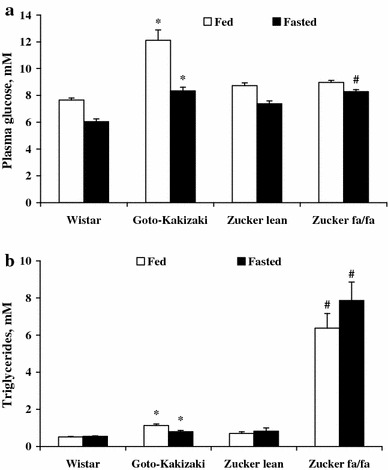
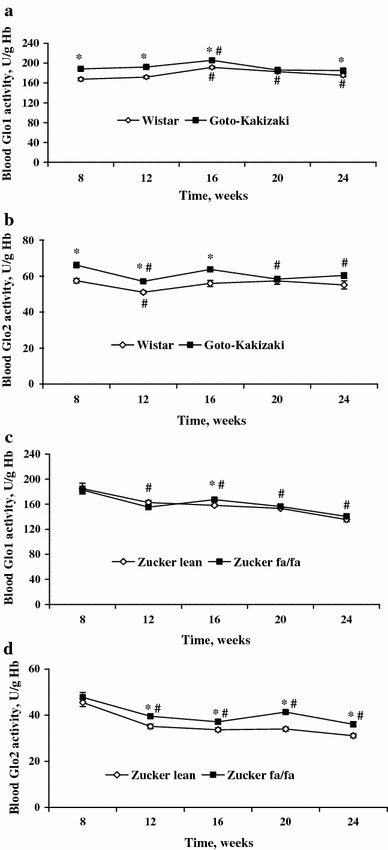
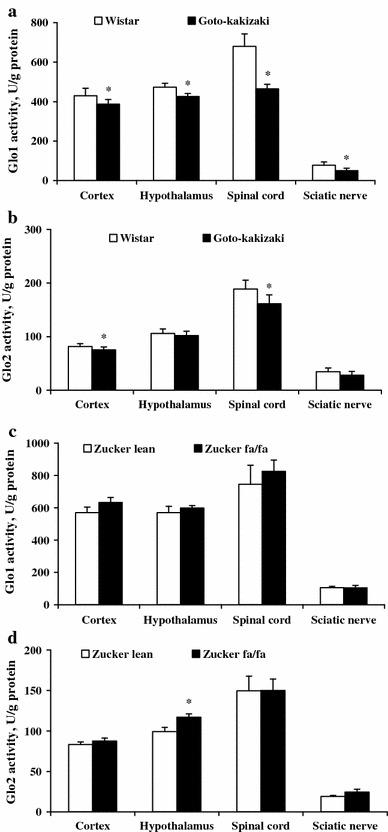
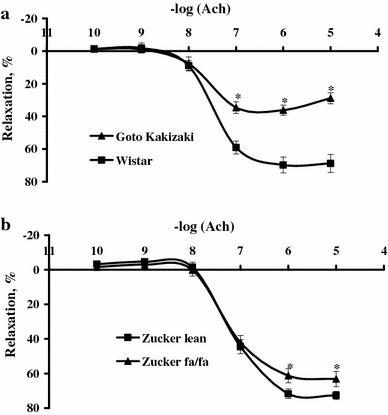
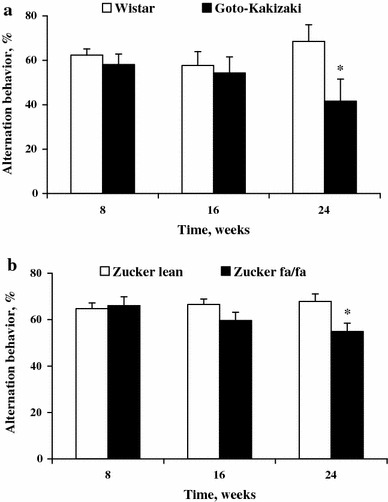
The glyoxalase enzymes catalyse the conversion of reactive glucose metabolites into non-toxic products as a part of the cellular defence system against glycation. This study investigated changes in glyoxalase 1 and glyoxalase 2 activities and the development of diabetic complications in experimental animal models of obesity (Zucker fa/fa rats) and type 2 diabetes mellitus (Goto-Kakizaki rats). In contrast to Zucker rats, in Goto-Kakizaki rats the glyoxalase 1 activities in brain, spinal cord and sciatic nerve tissues were significantly reduced by 10, 32 and 36 %, respectively. Lower glyoxalase 1 activity in the neuronal tissues was associated with a higher blood glucose concentration and impaired endothelium-dependent relaxation to acetylcholine in aortic rings in Goto-Kakizaki rats. This study provides evidence for disturbed neuronal glyoxalase 1 activity under conditions of hyperglycaemia in the presence of impaired endothelium-dependent relaxation and cognitive function.
Conflict of interest statement
The authors declare that there are no conflicts of interest.
Figures
Similar articles
-
The human red blood cell glyoxalase system in diabetes mellitus.Diabetes Res Clin Pract. 1989 Aug 1;7(2):115-20. doi: 10.1016/0168-8227(89)90101-0. Diabetes Res Clin Pract. 1989. PMID: 2776650
-
Modification of the glyoxalase system in clinical diabetes mellitus.Biochem Soc Trans. 1993 May;21(2):158S. doi: 10.1042/bst021158s. Biochem Soc Trans. 1993. PMID: 8359411 No abstract available.
-
Modification of the glyoxalase system in streptozotocin-induced diabetic rats. Effect of the aldose reductase inhibitor Statil.Biochem Pharmacol. 1993 Sep 1;46(5):805-11. doi: 10.1016/0006-2952(93)90488-i. Biochem Pharmacol. 1993. PMID: 8373434
-
Dicarbonyl stress in clinical obesity.Glycoconj J. 2016 Aug;33(4):581-9. doi: 10.1007/s10719-016-9692-0. Epub 2016 Jun 24. Glycoconj J. 2016. PMID: 27338619 Free PMC article. Review.
-
Activity, regulation, copy number and function in the glyoxalase system.Biochem Soc Trans. 2014 Apr;42(2):419-24. doi: 10.1042/BST20140008. Biochem Soc Trans. 2014. PMID: 24646254 Review.
Cited by
-
Mangiferin Upregulates Glyoxalase 1 Through Activation of Nrf2/ARE Signaling in Central Neurons Cultured with High Glucose.Mol Neurobiol. 2017 Aug;54(6):4060-4070. doi: 10.1007/s12035-016-9978-z. Epub 2016 Jun 18. Mol Neurobiol. 2017. PMID: 27318675
-
N-acetylcysteine attenuates systemic platelet activation and cerebral vessel thrombosis in diabetes.Redox Biol. 2018 Apr;14:218-228. doi: 10.1016/j.redox.2017.09.005. Epub 2017 Sep 20. Redox Biol. 2018. PMID: 28961512 Free PMC article.
-
Use of physiologically based kinetic modeling to predict neurotoxicity and genotoxicity of methylglyoxal in humans.NPJ Sci Food. 2024 Oct 6;8(1):79. doi: 10.1038/s41538-024-00322-6. NPJ Sci Food. 2024. PMID: 39368970 Free PMC article.
-
Anti-obesity and hepatoprotective effects of pyridoxal phosphate in rats with metabolic syndrome by raising anti-oxidant potential in both serum and liver tissue, while also decreasing hepatic nuclear factor expression.Iran J Basic Med Sci. 2025;28(8):1012-1018. doi: 10.22038/ijbms.2025.81836.17702. Iran J Basic Med Sci. 2025. PMID: 40584440 Free PMC article.
-
A new method for quantifying glyoxalase II activity in biological samples.Biol Methods Protoc. 2024 Sep 18;9(1):bpae069. doi: 10.1093/biomethods/bpae069. eCollection 2024. Biol Methods Protoc. 2024. PMID: 39351318 Free PMC article.
References
-
- Fleming TH, Humpert PM, Nawroth PP, Bierhaus A. Reactive metabolites and AGE/RAGE-mediated cellular dysfunction affect the aging process: a mini-review. Gerontology. 2011;57:435–443. - PubMed
Publication types
MeSH terms
Substances
LinkOut - more resources
Full Text Sources
Medical
Molecular Biology Databases
Research Materials
