. 2012 Oct;81(10):922-8.
doi: 10.1002/cyto.a.22155. Epub 2012 Aug 14.

A high-throughput, flow cytometry-based method to quantify DNA-end resection in mammalian cells

Affiliations
Free PMC article

A high-throughput, flow cytometry-based method to quantify DNA-end resection in mammalian cells

Josep V Forment et al. Cytometry A. 2012 Oct.
Free PMC article

Abstract

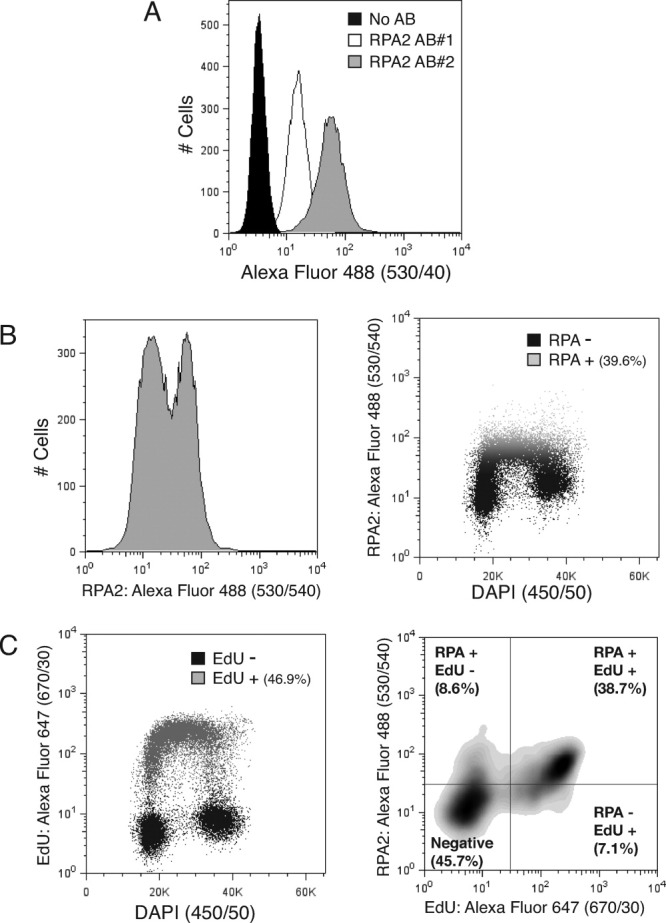
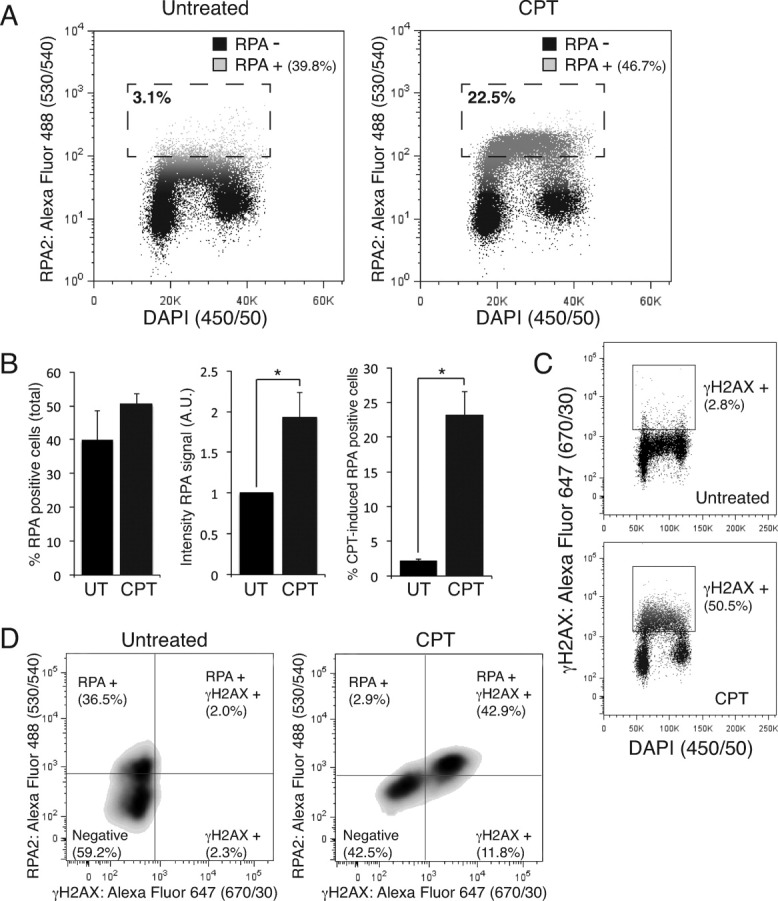
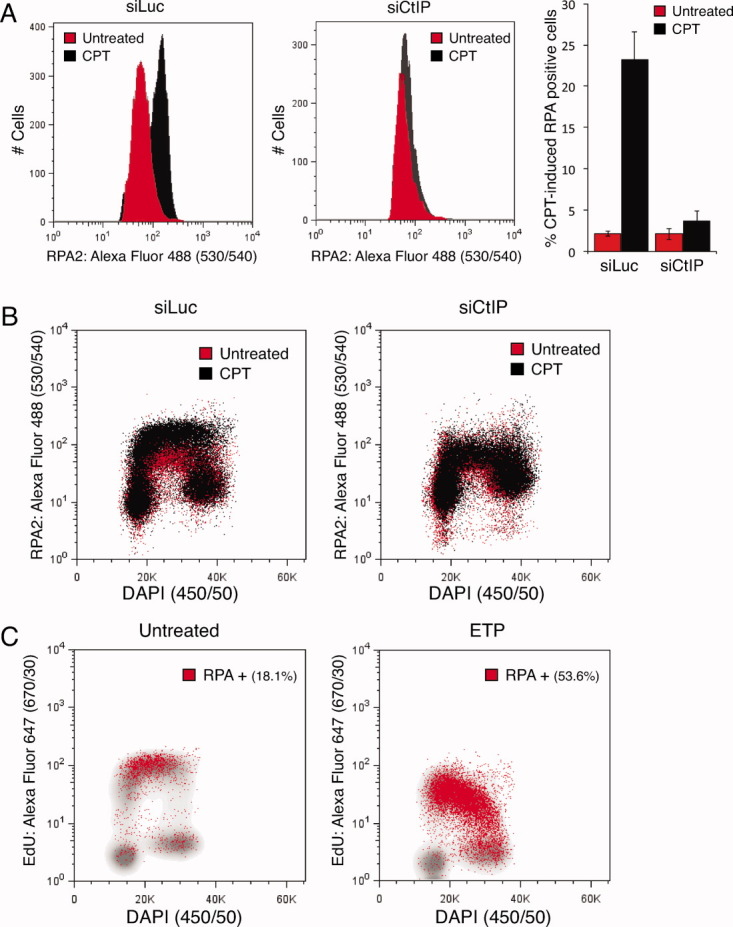
Replication protein A (RPA) is an essential trimeric protein complex that binds to single-stranded DNA (ssDNA) in eukaryotic cells and is involved in various aspects of cellular DNA metabolism, including replication and repair. Although RPA is ubiquitously expressed throughout the cell cycle, it localizes to DNA replication forks during S phase, and is recruited to sites of DNA damage when regions of ssDNA are exposed. During DNA double-strand break (DSB) repair by homologous recombination (HR), RPA recruitment to DNA damage sites depends on a process termed DNA-end resection. Consequently, RPA recruitment to sub-nuclear regions bearing DSBs has been used as readout for resection and for ongoing HR. Quantification of RPA recruitment by immunofluorescence-based microscopy techniques is time consuming and requires extensive image analysis of relatively small populations of cells. Here, we present a high-throughput flow-cytometry method that allows the use of RPA staining to measure cell proliferation and DNA-damage repair by HR in an unprecedented, unbiased and quantitative manner.


Figures

Figure 1
Figure 1
A: Anti-RPA2 antibodies can be used in flow cytometry. The x axis represents the intensity of RPA2 signals (logarithmic scale). In the control sample (No Ab) only the secondary antibody was used. B: Extraction of samples prior to fixation differentiates between two populations of cells with regards RPA2 staining (left panel). When RPA2 signals are compared with total DNA content (DAPI), the RPA2-positive cells correspond to those in S phase (right panel). C: Most cells that are RPA2 positive are also positive for EdU incorporation. Left panel: extent of EdU incorporation compared with DNA content (DAPI). Right panel: comparison of EdU incorporation and RPA2-positive cells. Gating in the right panel was established using the gating in the left panel (for EdU) and in the right panel in (B) (for RPA2). In A, 10,000 events were counted per condition. In the rest of panels, 30,000 events were counted per condition.
Figure 2
Figure 2
A: DNA damage increases the intensity of RPA2 signals. Cells were treated with 1 μM of camptothecin (CPT) for 1 h before harvesting. The dashed square marks the gate (showing the percentage of cells in it) used for quantification in the right panel in (B). B: Quantification of total amounts of RPA2-positive cells (left panel), the intensities of RPA2 signals (normalized to the intensity in untreated samples; middle panel), and the total amounts of DNA-damage induced RPA-positive cells (using the population gated in (A); right panel). For an example of the gating scheme, see Supporting Information Figure S1. Results are averages of at least three independent experiments and the error bars correspond to standard deviations. (*) Denotes statistically significant differences (P value < 0.05). C: DNA damage causes the appearance of γH2AX signals. Cells were treated as in (A). D: Comparison between RPA2 and γH2AX signals. Most RPA2-positive cells are also positive for γH2AX. In all panels 30,000 events were counted per condition.
Figure 3
Figure 3
A: CPT-induced increase in RPA2 staining reflects DNA-end resection. Cells were transfected with control (luciferase, Luc) or CtIP siRNAs 48 h before the experiment. Cells were treated as in Figure 2A. Quantifications (right panel) were performed with the same gating scheme as in Figure 2B (see Supporting Information Fig. S1). Results are averages of at least three independent experiments and the error bars correspond to standard deviations. B: CtIP depletion only affects DNA-damage induced RPA2 staining. Cells were treated as in (A). C: Etoposide (ETP) increases the amount of RPA2-positive cells in S and G2 phases of the cell cycle. Cells were treated with 5 μM ETP for 4 h before harvesting. RPA2-positive populations (red dots) are plotted on top of the EdU incorporation profiles (in gray). In all panels 30,000 events were counted per condition. [Color figure can be viewed in the online issue, which is available at wileyonlinelibrary.com.]

References

    1. Jackson SP, Bartek J. The DNA-damage response in human biology and disease. Nature. 2009;461:1071–1078. - PMC - PubMed
    1. Ciccia A, Elledge SJ. The DNA damage response: Making it safe to play with knives. Mol Cell. 2010;40:179–204. - PMC - PubMed
    1. Symington LS, Gautier J. Double-strand break end resection and repair pathway choice. Annu Rev Genet. 2011;45:247–271. - PubMed
    1. Lieber MR. The mechanism of double-strand DNA break repair by the nonhomologous DNA end-joining pathway. Annu Rev Biochem. 2010;79:181–211. - PMC - PubMed
    1. San Filippo J, Sung P, Klein H. Mechanism of eukaryotic homologous recombination. Annu Rev Biochem. 2008;77:229–257. - PubMed

Publication types

LinkOut - more resources