. 2012 Aug 28;109(35):14063-8.
doi: 10.1073/pnas.1210251109. Epub 2012 Aug 14.

Protected areas facilitate species' range expansions

Affiliations

Protected areas facilitate species' range expansions

Chris D Thomas et al. Proc Natl Acad Sci U S A. .

Abstract

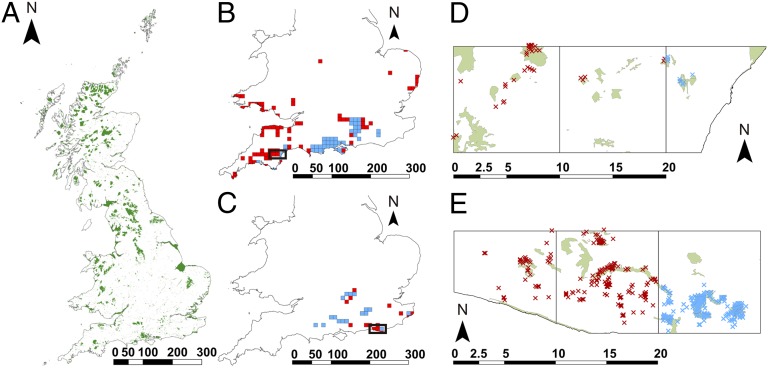
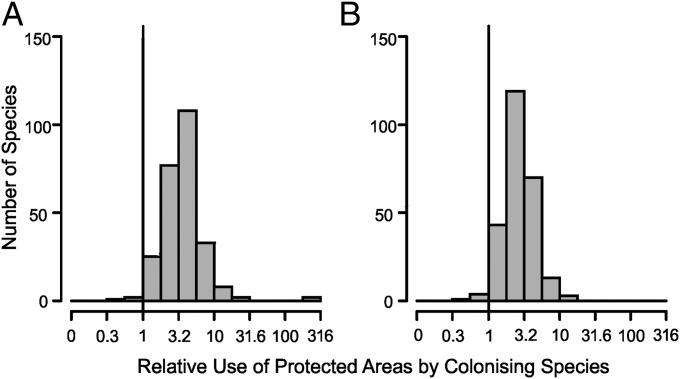
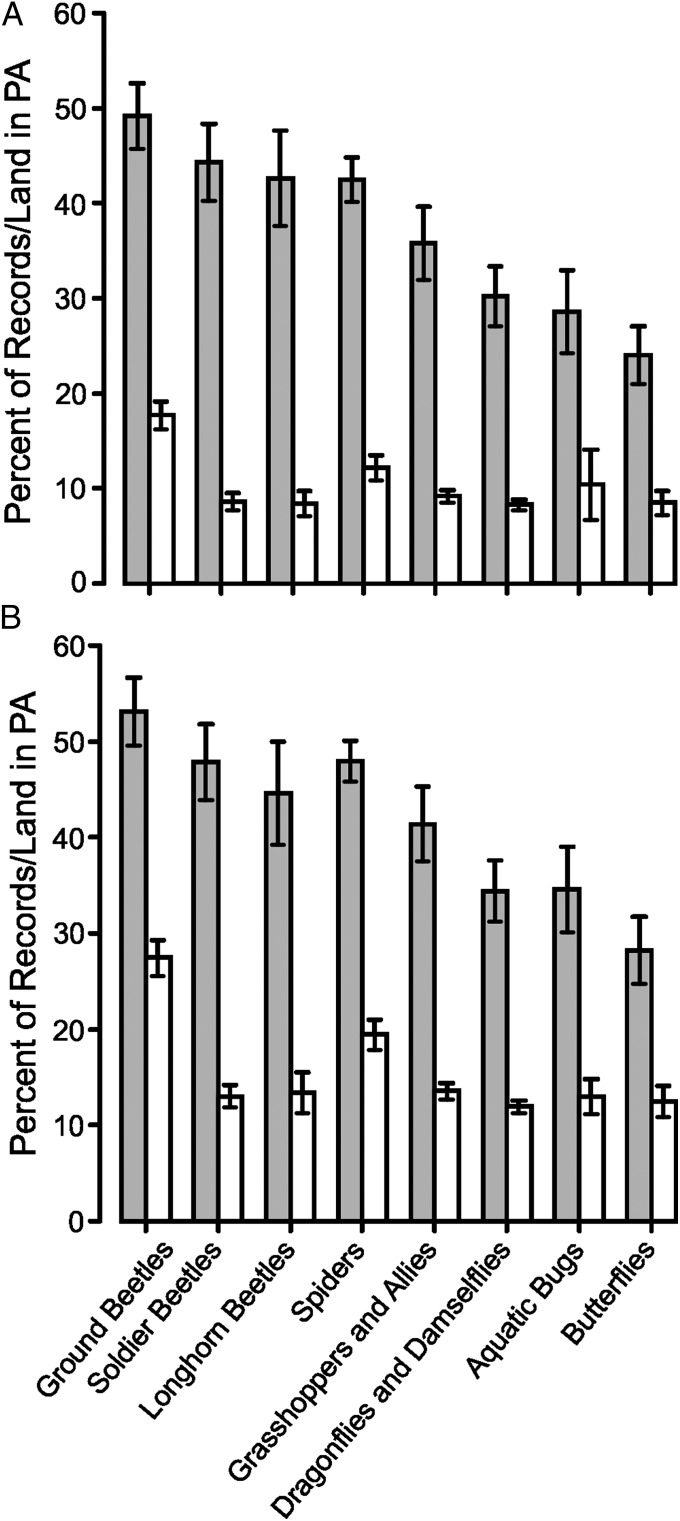
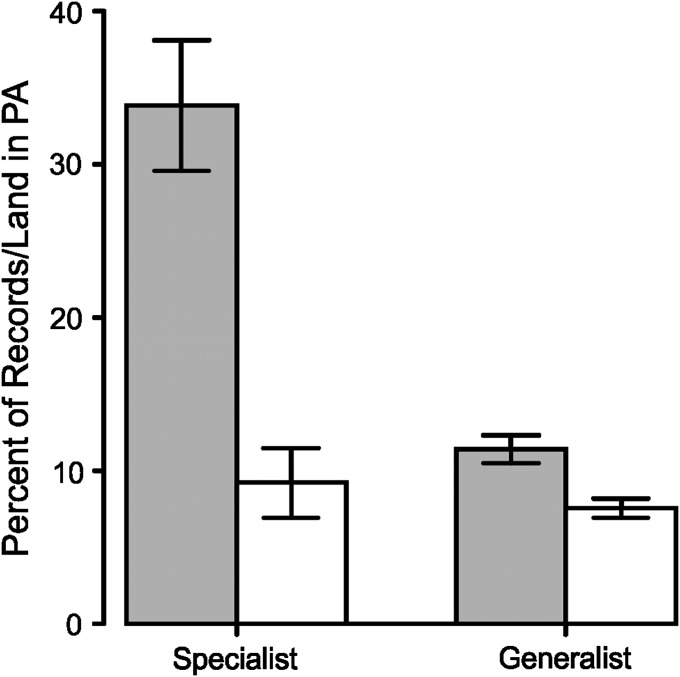
The benefits of protected areas (PAs) for biodiversity have been questioned in the context of climate change because PAs are static, whereas the distributions of species are dynamic. Current PAs may, however, continue to be important if they provide suitable locations for species to colonize at their leading-edge range boundaries, thereby enabling spread into new regions. Here, we present an empirical assessment of the role of PAs as targets for colonization during recent range expansions. Records from intensive surveys revealed that seven bird and butterfly species have colonized PAs 4.2 (median) times more frequently than expected from the availability of PAs in the landscapes colonized. Records of an additional 256 invertebrate species with less-intensive surveys supported these findings and showed that 98% of species are disproportionately associated with PAs in newly colonized parts of their ranges. Although colonizing species favor PAs in general, species vary greatly in their reliance on PAs, reflecting differences in the dependence of individual species on particular habitats and other conditions that are available only in PAs. These findings highlight the importance of current PAs for facilitating range expansions and show that a small subset of the landscape receives a high proportion of colonizations by range-expanding species.


Conflict of interest statement

The authors declare no conflict of interest.

Figures

Fig. 1.
Fig. 1.
(A) Locations of PAs (Sites of Special Scientific Interest) within Great Britain. (B) Dartford warbler S. undata distribution change, showing 10 × 10-km grid squares considered to be core (occupied before and since the end of 1991; blue squares) and colonized (occupied since 1991 only; red squares). (C) Silver-spotted skipper H. comma distribution change, showing 10 × 10-km grid squares considered to be core (occupied during 1970–1982 and 1995–2010; blue squares) and colonized (not occupied 1970–1982 but occupied 1995–2010; red squares). (D) Expanded view of the 10 × 10-km grid squares highlighted in B showing the location of PAs in green, the locations of S. undata records in core areas (blue), and the locations of records in colonized areas (red). (E) Expanded view of the 10 × 10-km grid squares highlighted in C showing the location of PAs in green, the locations of H. comma records in core areas (blue), and the locations of records in colonized areas (red). Scale bars are in kilometers.
Fig. 2.
Fig. 2.
The association of colonizing invertebrate species with PAs. (A) Colonization of PAs relative to PA availability (i.e., fraction of records from PAs ÷ fraction of land covered by PAs); a value greater than one (vertical black line) indicates that a colonizing species was recorded in PAs more frequently than expected from the availability of PA land in colonized 10 × 10-km grid squares (10 indicates 10 times more frequently; n = 256 species). (B) The same as in A after the exclusion of urban, suburban, and arable land (n = 255 species).
Fig. 3.
Fig. 3.
Mean (± SE) percentages of records per species from PAs for the eight taxonomic groups considered (gray bars), compared with the background availability of PA land (open bars). (A) The 100 × 100-m resolution records of colonizing species are more likely to be in PAs than at random given the availability of PA land in the colonized 10 × 10-km squares (Wilcoxon signed rank tests, P < 0.001 for each taxon). (B) The same as in A after the exclusion of urban, suburban, and arable land (Wilcoxon signed rank tests, P < 0.001 for each taxon).
Fig. 4.
Fig. 4.
Mean (± SE) percentages of records per butterfly species (gray bars) from PAs for colonizing habitat specialists (n = 18 species) and generalists (wider countryside species; n = 14), compared with the background availability of PA land in areas of colonization (open bars). Specialists are more strongly associated than generalists with PAs (Mann–Whitney U test comparison of specialist vs. generalist PA use ratios; W = 26, n1 = 18, n2 = 14, P < 0.0001).

References

    1. Chape S, Harrison J, Spalding M, Lysenko I. Measuring the extent and effectiveness of protected areas as an indicator for meeting global biodiversity targets. Philos Trans R Soc Lond B Biol Sci. 2005;360:443–455. - PMC - PubMed
    1. Soutullo A. Extent of the global network of terrestrial protected areas. Conserv Biol. 2010;24:362–363. - PubMed
    1. Convention on Biological Diversity 2010. Decision Adopted by the Conference of the Parties to the Convention of Biological Diversity at its Tenth meeting. Available at http://www.cbd.int/doc/decisions/COP-10/cop-10-dec-02-en.pdf. Accessed June, 2011.
    1. Harrop SR. Living in harmony with nature? Outcomes of the 2010 Nagoya Conference of the Convention on Biodiversity. J Environ Law. 2011;23:117–128.
    1. Parmesan C, Yohe G. A globally coherent fingerprint of climate change impacts across natural systems. Nature. 2003;421:37–42. - PubMed

Publication types