

Polymorphic fibrillation of the destabilized fourth fasciclin-1 domain mutant A546T of the Transforming growth factor-β-induced protein (TGFBIp) occurs through multiple pathways with different oligomeric intermediates
- PMID: 22893702
- PMCID: PMC3464576
- DOI: 10.1074/jbc.M112.379552
Polymorphic fibrillation of the destabilized fourth fasciclin-1 domain mutant A546T of the Transforming growth factor-β-induced protein (TGFBIp) occurs through multiple pathways with different oligomeric intermediates
Abstract
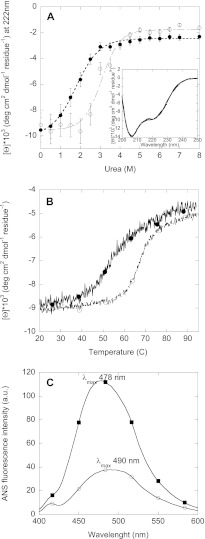
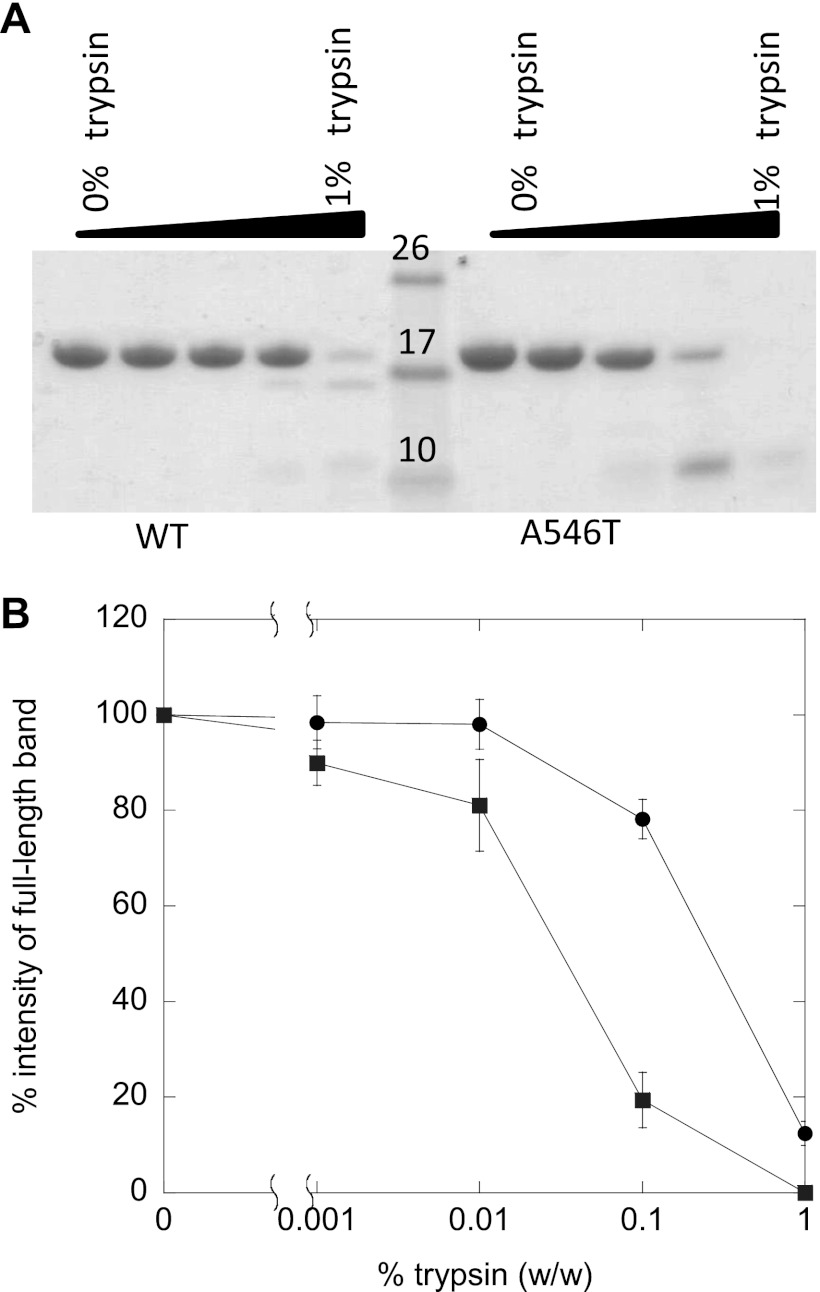
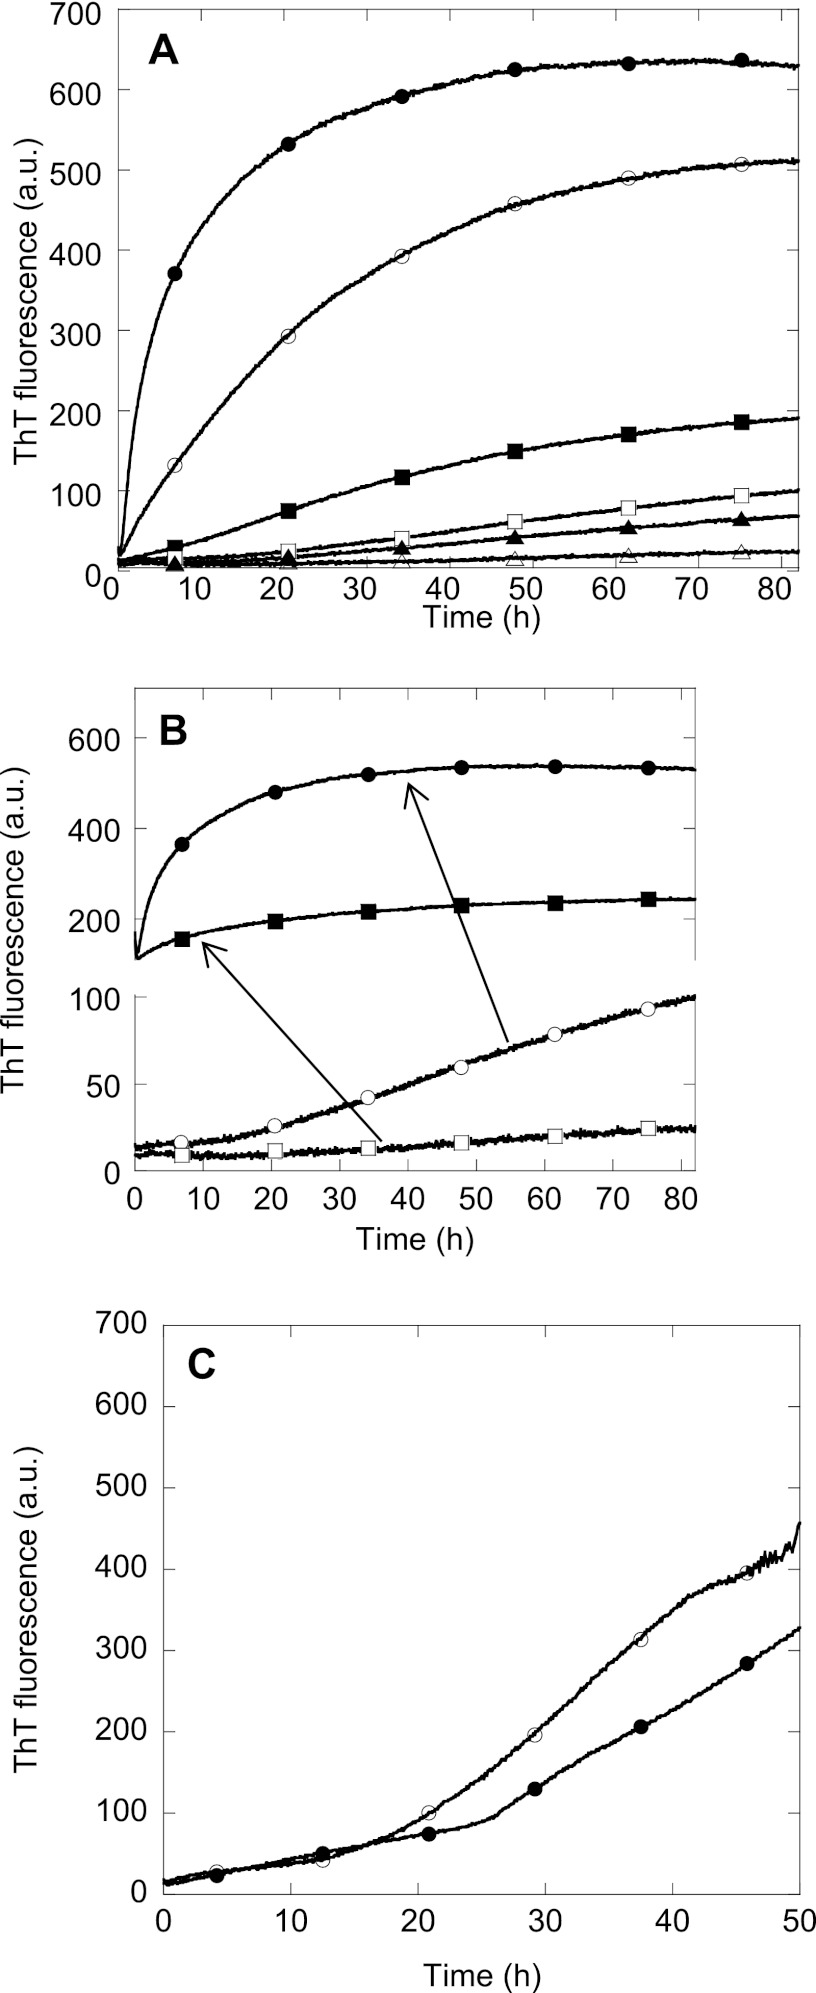
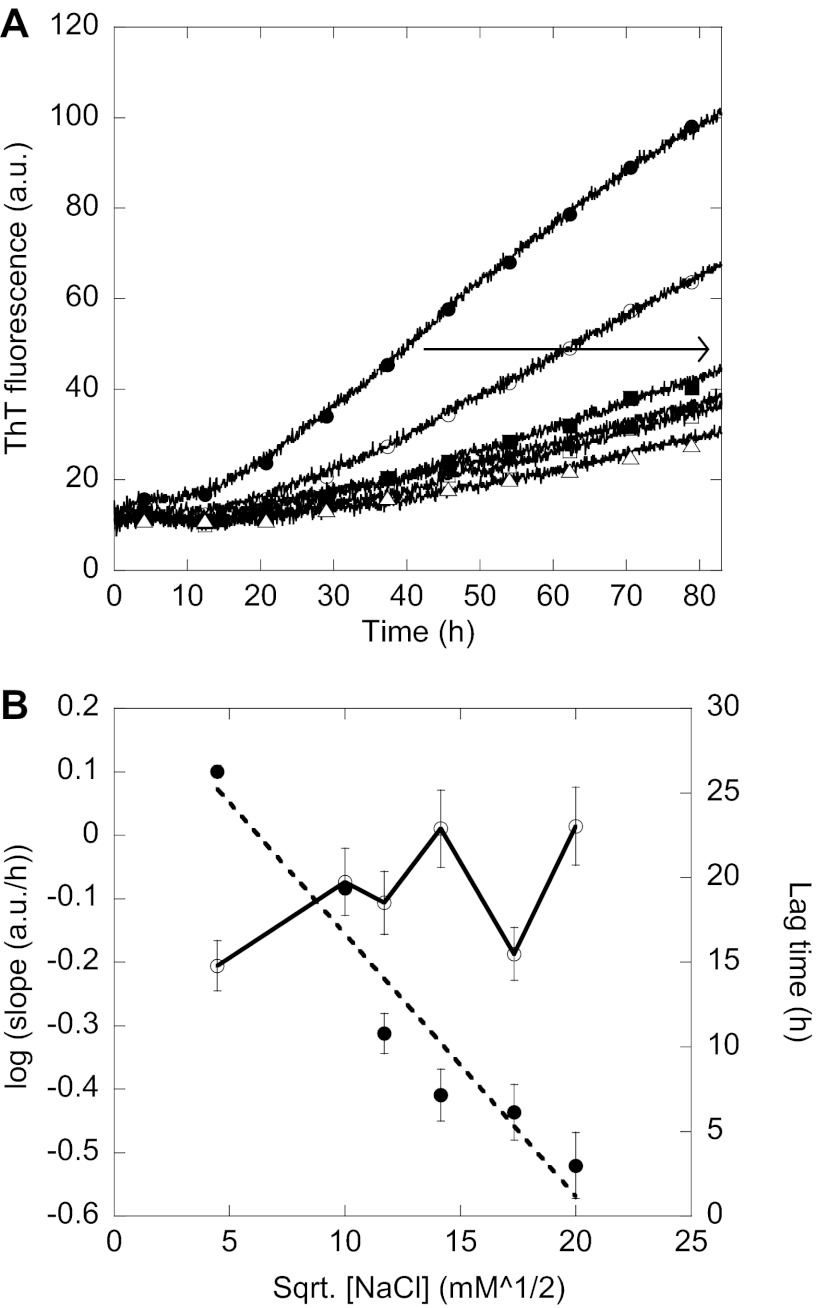
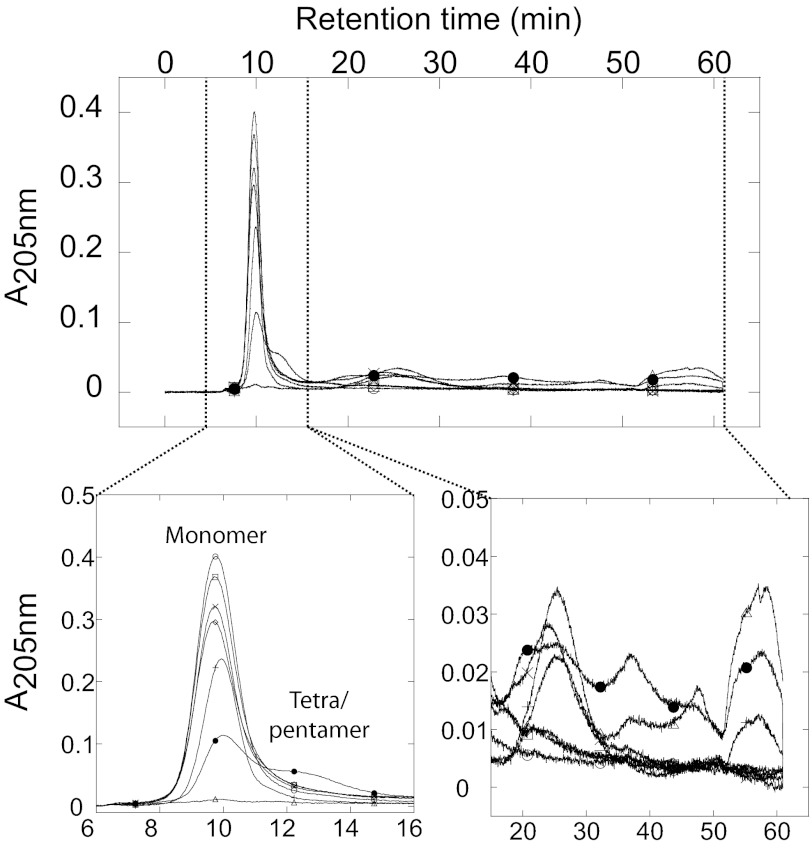
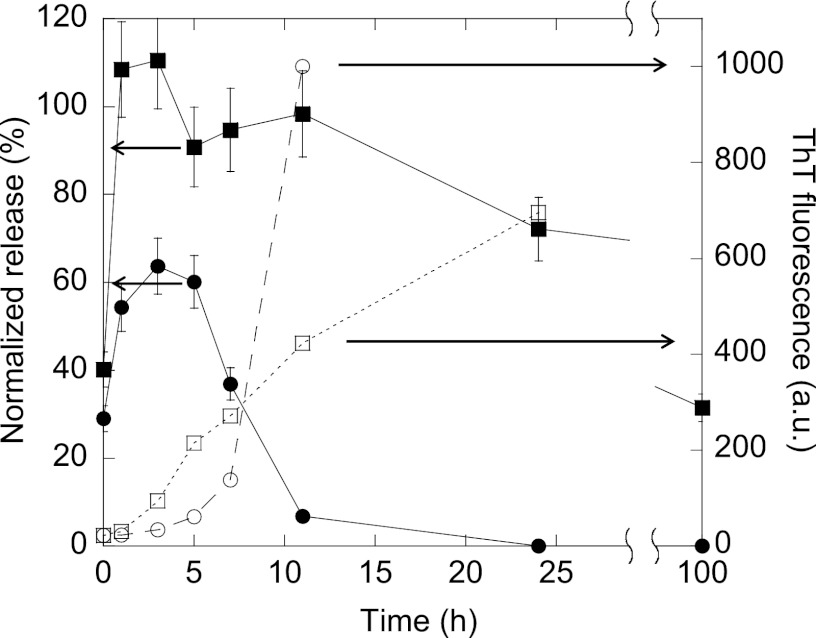
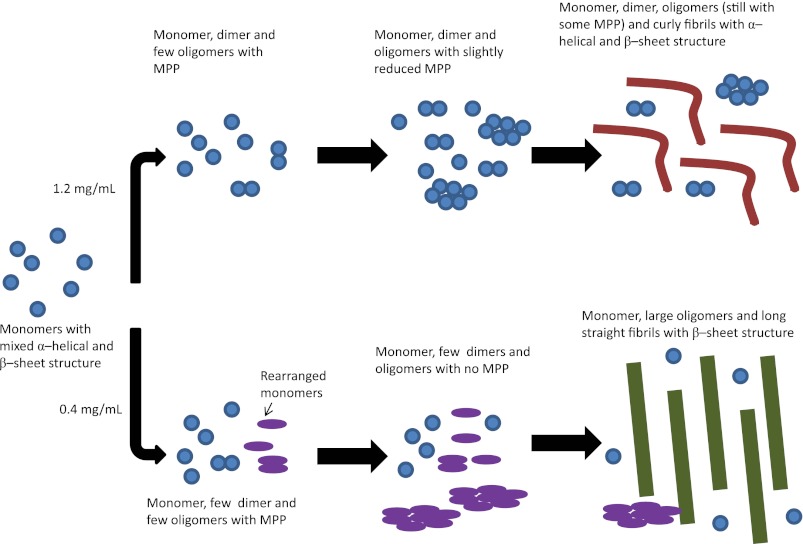
Mutations in the transforming growth factor β-induced protein (TGFBIp) are linked to the development of corneal dystrophies in which abnormal protein deposition in the cornea leads to a loss of corneal transparency and ultimately blindness. Different mutations give rise to phenotypically distinct corneal dystrophies. Most mutations are located in the fourth fasciclin-1 domain (FAS1-4). The amino acid substitution A546T in the FAS1-4 domain is linked to the development of lattice corneal dystrophy with amyloid deposits in the superficial and deep stroma, classifying it as an amyloid disease. Here we provide a detailed description of the fibrillation of the isolated FAS1-4 domain carrying the A546T substitution. The A546T substitution leads to a significant destabilization of FAS1-4 and induces a partially folded structure with increased surface exposure of hydrophobic patches. The mutation also leads to two distinct fibril morphologies. Long straight fibrils composed of pure β-sheet structure are formed at lower concentrations, whereas short and curly fibrils containing a mixture of α-helical and β-sheet structures are formed at higher concentrations. The formation of short and curly fibrils is preceded by the formation of a small number of oligomeric species with high membrane permeabilization potential and rapid fibril formation. The long straight fibrils are formed more slowly and through progressively bigger oligomers that lose their membrane permeabilization potential as fibrillation proceeds beyond the lag phase. These different fibril classes and associated biochemical differences may lead to different clinical symptoms associated with the mutation.
Figures
Similar articles
-
Fibril Core of Transforming Growth Factor Beta-Induced Protein (TGFBIp) Facilitates Aggregation of Corneal TGFBIp.Biochemistry. 2015 May 19;54(19):2943-56. doi: 10.1021/acs.biochem.5b00292. Epub 2015 May 6. Biochemistry. 2015. PMID: 25910219 Free PMC article.
-
Human phenotypically distinct TGFBI corneal dystrophies are linked to the stability of the fourth FAS1 domain of TGFBIp.J Biol Chem. 2011 Feb 18;286(7):4951-8. doi: 10.1074/jbc.M110.181099. Epub 2010 Dec 6. J Biol Chem. 2011. PMID: 21135107 Free PMC article.
-
Epigallocatechin Gallate Remodels Fibrils of Lattice Corneal Dystrophy Protein, Facilitating Proteolytic Degradation and Preventing Formation of Membrane-Permeabilizing Species.Biochemistry. 2016 Apr 26;55(16):2344-57. doi: 10.1021/acs.biochem.6b00063. Epub 2016 Apr 14. Biochemistry. 2016. PMID: 27042751
-
Biochemical mechanisms of aggregation in TGFBI-linked corneal dystrophies.Prog Retin Eye Res. 2020 Jul;77:100843. doi: 10.1016/j.preteyeres.2020.100843. Epub 2020 Jan 29. Prog Retin Eye Res. 2020. PMID: 32004730 Review.
-
Biochemical properties and aggregation propensity of transforming growth factor-induced protein (TGFBIp) and the amyloid forming mutants.Ocul Surf. 2015 Jan;13(1):9-25. doi: 10.1016/j.jtos.2014.04.003. Epub 2014 Oct 8. Ocul Surf. 2015. PMID: 25557343 Review.
Cited by
-
Formation of dynamic soluble surfactant-induced amyloid β peptide aggregation intermediates.J Biol Chem. 2013 Aug 9;288(32):23518-28. doi: 10.1074/jbc.M113.470450. Epub 2013 Jun 17. J Biol Chem. 2013. PMID: 23775077 Free PMC article.
-
pH Induced Conformational Transitions in the Transforming Growth Factor β-Induced Protein (TGFβIp) Associated Corneal Dystrophy Mutants.Sci Rep. 2016 Mar 31;6:23836. doi: 10.1038/srep23836. Sci Rep. 2016. PMID: 27030015 Free PMC article.
-
Pharmaceutical modulation of the proteolytic profile of Transforming Growth Factor Beta induced protein (TGFBIp) offers a new avenue for treatment of TGFBI-corneal dystrophy.J Adv Res. 2020 May 22;24:529-543. doi: 10.1016/j.jare.2020.05.012. eCollection 2020 Jul. J Adv Res. 2020. PMID: 32637173 Free PMC article.
-
Conservation of the Amyloid Interactome Across Diverse Fibrillar Structures.Sci Rep. 2019 Mar 7;9(1):3863. doi: 10.1038/s41598-019-40483-z. Sci Rep. 2019. PMID: 30846764 Free PMC article.
-
Early Events in the Amyloid Formation of the A546T Mutant of Transforming Growth Factor β-Induced Protein in Corneal Dystrophies Compared to the Nonfibrillating R555W and R555Q Mutants.Biochemistry. 2015 Sep 15;54(36):5546-56. doi: 10.1021/acs.biochem.5b00473. Epub 2015 Sep 2. Biochemistry. 2015. PMID: 26305369 Free PMC article.
References
-
- Skonier J., Neubauer M., Madisen L., Bennett K., Plowman G. D., Purchio A. F. (1992) cDNA cloning and sequence analysis of β ig-h3, a novel gene induced in a human adenocarcinoma cell line after treatment with transforming growth factor-β. DNA Cell Biol. 11, 511–522 - PubMed
-
- Escribano J., Hernando N., Ghosh S., Crabb J., Coca-Prados M. (1994) cDNA from human ocular ciliary epithelium homologous to β ig-h3 is preferentially expressed as an extracellular protein in the corneal epithelium. J. Cell. Physiol. 160, 511–521 - PubMed
-
- Andersen R. B., Karring H., Møller-Pedersen T., Valnickova Z., Thøgersen I. B., Hedegaard C. J., Kristensen T., Klintworth G. K., Enghild J. J. (2004) Purification and structural characterization of transforming growth factor β induced protein (TGFBIp) from porcine and human corneas. Biochemistry 43, 16374–16384 - PubMed
-
- Basaiawmoit R. V., Oliveira C. L., Runager K., Sørensen C. S., Behrens M. A., Jonsson B. H., Kristensen T., Klintworth G. K., Enghild J. J., Pedersen J. S., Otzen D. E. (2011) SAXS models of TGFBIp reveal a trimeric structure and show that the overall shape is not affected by the R124H mutation. J. Mol. Biol. 408, 503–513 - PubMed
Publication types
MeSH terms
Substances
LinkOut - more resources
Full Text Sources
Research Materials
