

A maximum-likelihood procedure for estimating psychometric functions: thresholds, slopes, and lapses of attention
- PMID: 22894217
- PMCID: PMC3427362
- DOI: 10.1121/1.4733540
A maximum-likelihood procedure for estimating psychometric functions: thresholds, slopes, and lapses of attention
Abstract
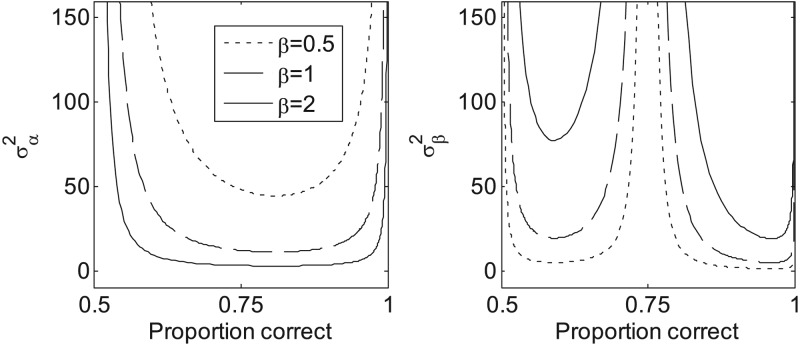
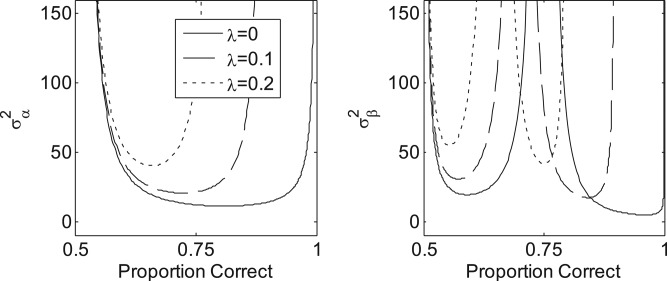
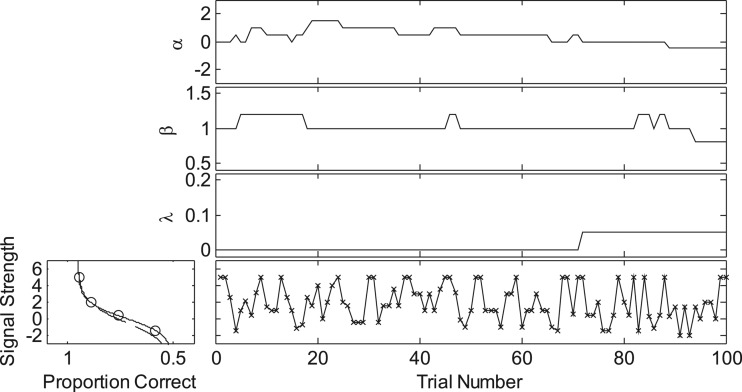
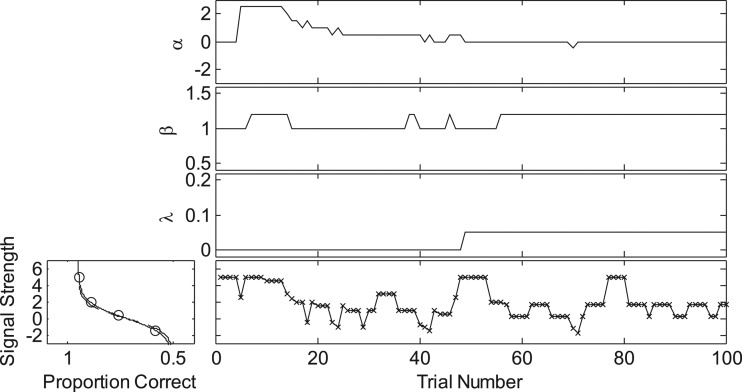
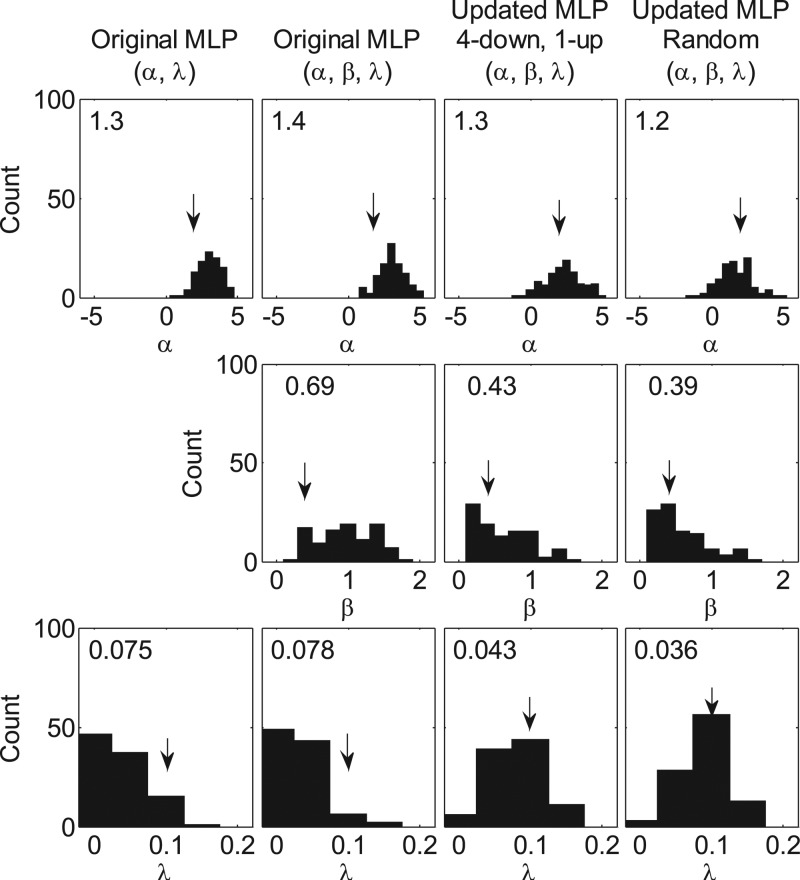
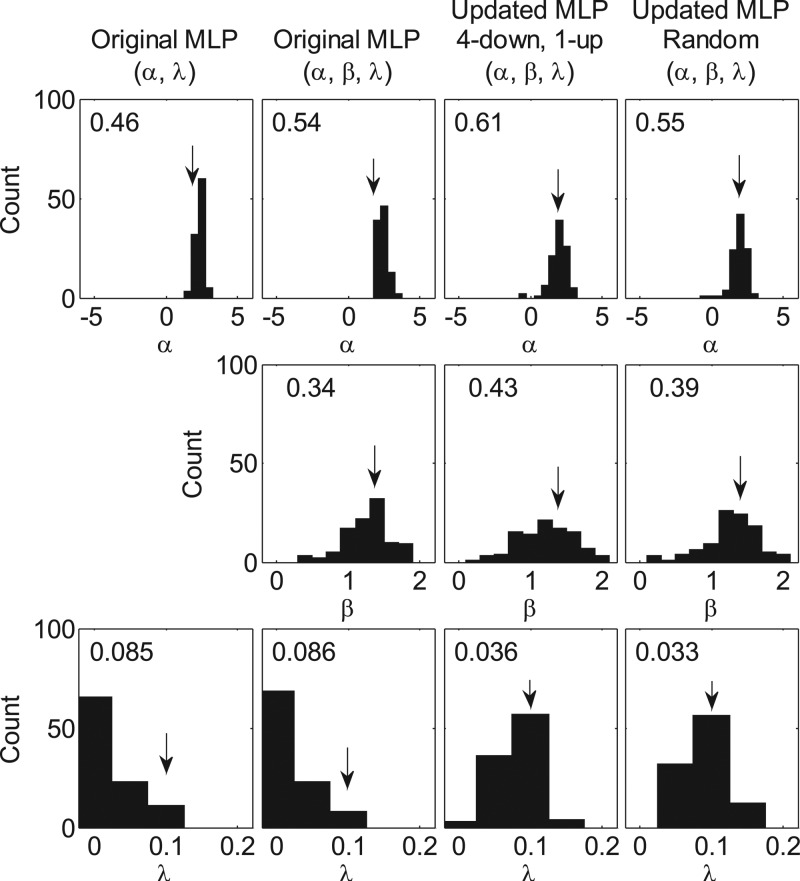
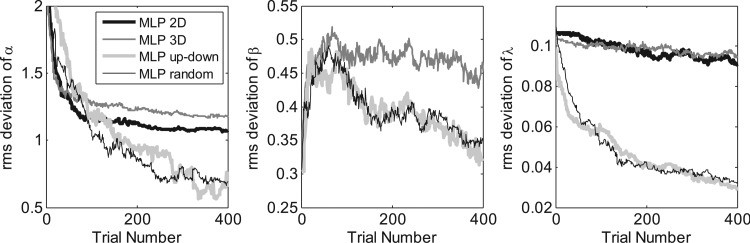
Green [J. Acoust. Soc. Am. 87, 2662-2674 (1990)] suggested an efficient, maximum-likelihood-based approach for adaptively estimating thresholds. Such procedures determine the signal strength on each trial by first identifying the most likely psychometric functions among the pre-proposed alternatives based on responses from previous trials, and then finding the signal strength at the "sweet point" on that most likely function. The sweet point is the point on the psychometric function that is associated with the minimum expected variance. Here, that procedure is extended to reduce poor estimates that result from lapses in attention. The sweet points for the threshold, slope, and lapse parameters of a transformed logistic psychometric function are derived. In addition, alternative stimulus placement algorithms are considered. The result is a relatively fast and robust estimation of a three-parameter psychometric function.
Figures
Similar articles
-
Bayesian adaptive estimation of the auditory filter.J Acoust Soc Am. 2013 Aug;134(2):1134-45. doi: 10.1121/1.4812856. J Acoust Soc Am. 2013. PMID: 23927113 Free PMC article.
-
Robust and efficient Bayesian adaptive psychometric function estimation.J Acoust Soc Am. 2017 Apr;141(4):2501. doi: 10.1121/1.4979580. J Acoust Soc Am. 2017. PMID: 28464623
-
Experience with a yes-no single-interval maximum-likelihood procedure.J Acoust Soc Am. 2000 May;107(5 Pt 1):2674-84. doi: 10.1121/1.428653. J Acoust Soc Am. 2000. PMID: 10830389
-
Statistical approaches to identifying lapses in psychometric response data.Psychon Bull Rev. 2021 Oct;28(5):1433-1457. doi: 10.3758/s13423-021-01876-2. Epub 2021 Apr 6. Psychon Bull Rev. 2021. PMID: 33825094 Review.
-
A detection-theoretic model of echo inhibition.Psychol Rev. 2004 Jan;111(1):52-66. doi: 10.1037/0033-295X.111.1.52. Psychol Rev. 2004. PMID: 14756585 Review.
Cited by
-
Saccade Adaptation and Visual Uncertainty.Front Hum Neurosci. 2016 May 24;10:227. doi: 10.3389/fnhum.2016.00227. eCollection 2016. Front Hum Neurosci. 2016. PMID: 27252635 Free PMC article.
-
Neural Speech Tracking in the Theta and in the Delta Frequency Band Differentially Encode Clarity and Comprehension of Speech in Noise.J Neurosci. 2019 Jul 17;39(29):5750-5759. doi: 10.1523/JNEUROSCI.1828-18.2019. Epub 2019 May 20. J Neurosci. 2019. PMID: 31109963 Free PMC article.
-
Efficiency in glimpsing vowel sequences in fluctuating makers: Effects of temporal fine structure and temporal regularity.J Acoust Soc Am. 2019 Apr;145(4):2518. doi: 10.1121/1.5098949. J Acoust Soc Am. 2019. PMID: 31046353 Free PMC article.
-
BPACE: A Bayesian, Patient-Centered Procedure for Matrix Speech Tests in Noise.Trends Hear. 2023 Jan-Dec;27:23312165231191382. doi: 10.1177/23312165231191382. Trends Hear. 2023. PMID: 37501653 Free PMC article.
-
A quantitative confidence signal detection model: 1. Fitting psychometric functions.J Neurophysiol. 2016 Apr;115(4):1932-45. doi: 10.1152/jn.00318.2015. Epub 2016 Jan 13. J Neurophysiol. 2016. PMID: 26763777 Free PMC article.
References
-
- Allen, P., and Wightman, F. (1994). “ Psychometric functions for children’s detection of tones in noise,” J. Speech Hear. Res. 37, 205–215. - PubMed
-
- Engen, T. (1971). “ Psychophysics. I. Discrimination and detection,” in Experimental Psychology, 3rd ed., edited by Kling J. W. and Riggs L. A. (Holt, Rinehard, and Winston, New York), Chap. 2, pp. 23–32.
Publication types
MeSH terms
Grants and funding
LinkOut - more resources
Full Text Sources