. 2012 Aug;132(2):1078-87.
doi: 10.1121/1.4730905.

Use of a compound approach to derive auditory-filter-wide frequency-importance functions for vowels and consonants

Affiliations

Use of a compound approach to derive auditory-filter-wide frequency-importance functions for vowels and consonants

Frédéric Apoux et al. J Acoust Soc Am. 2012 Aug.

Abstract

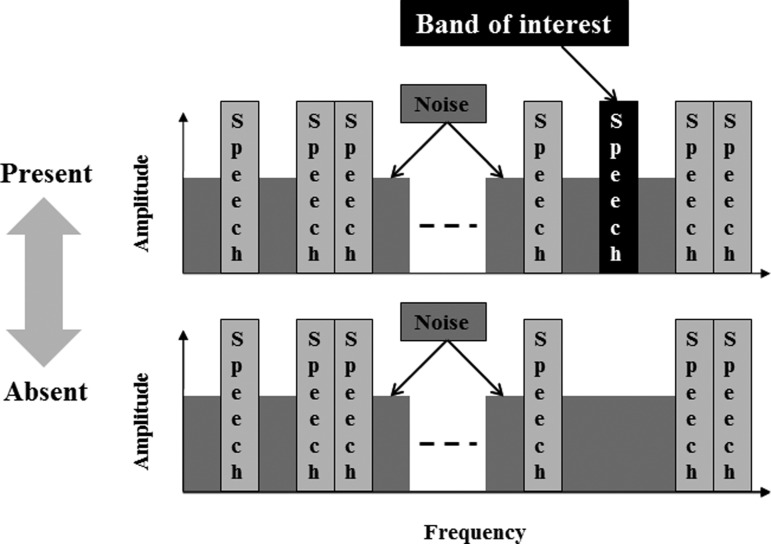
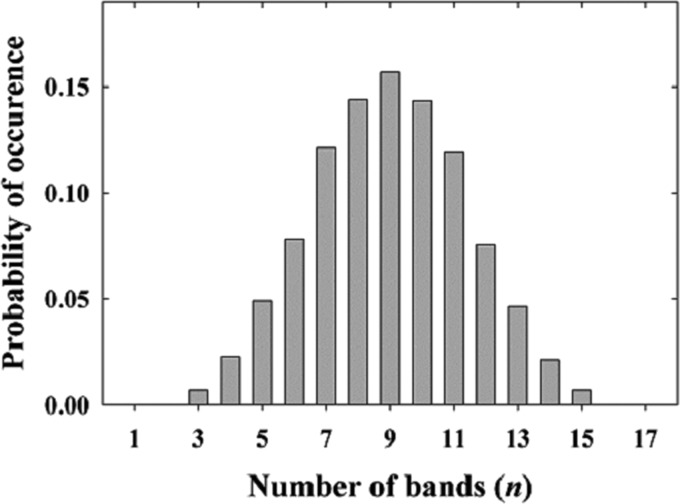
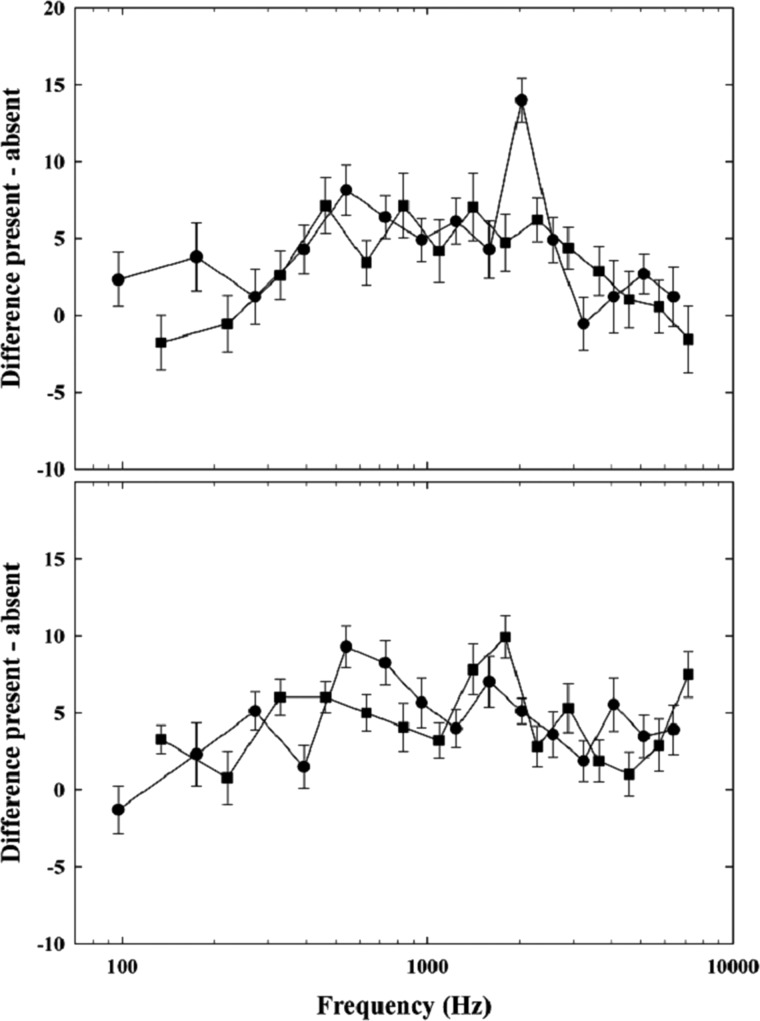
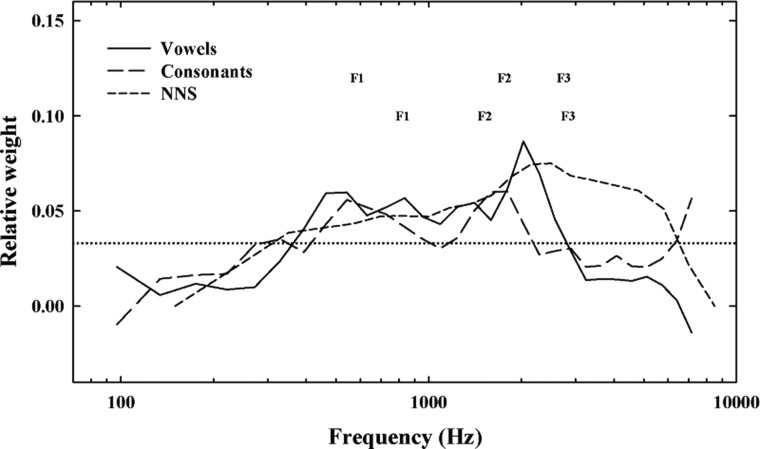
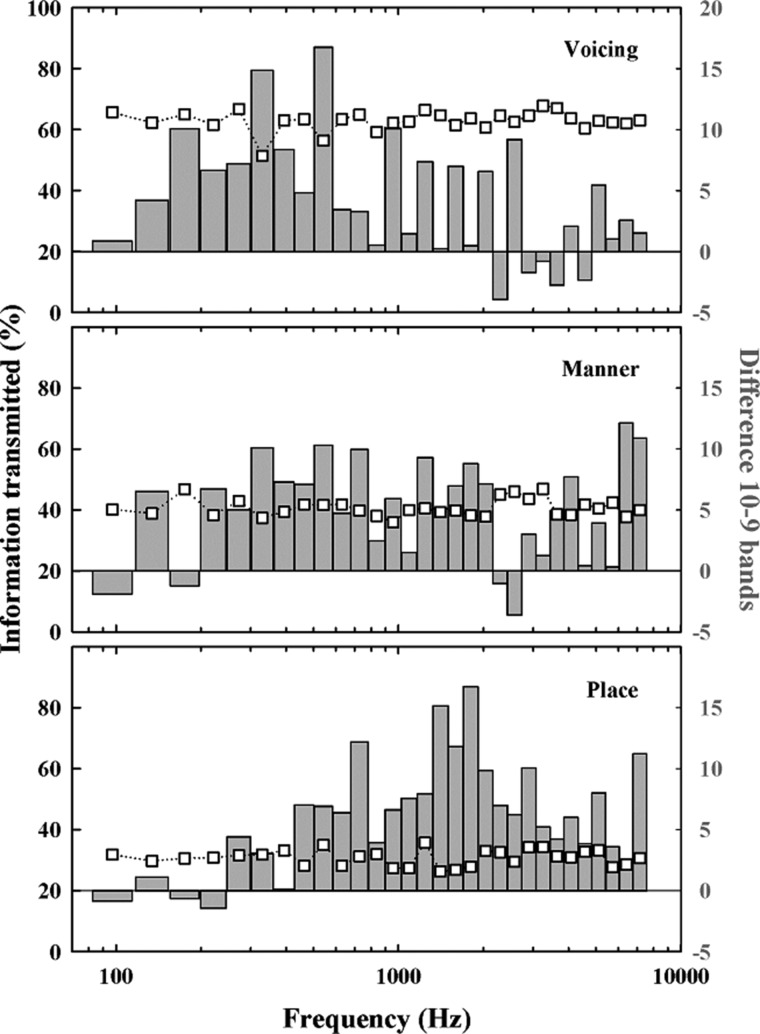
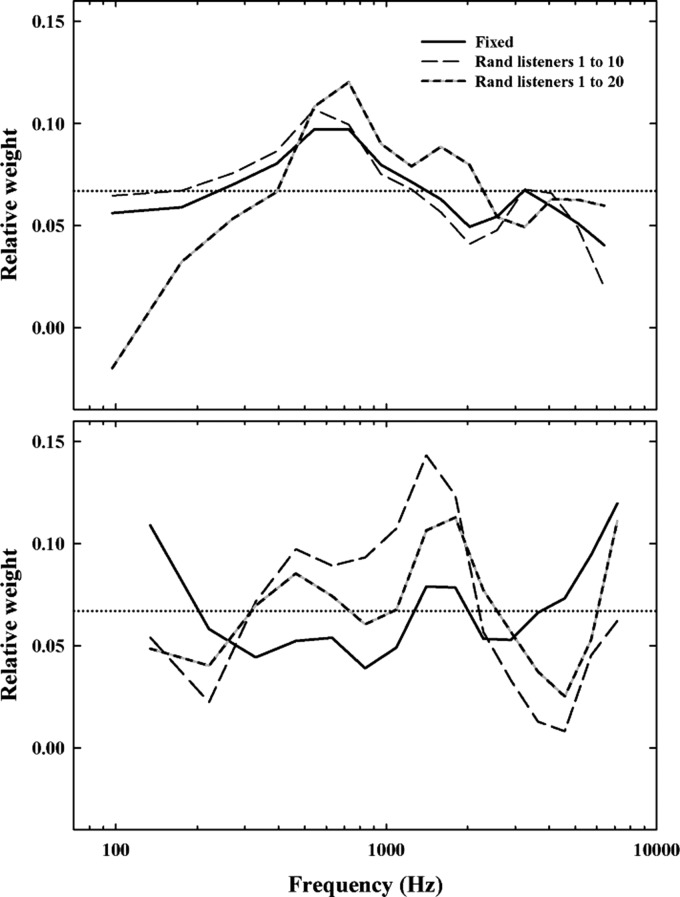
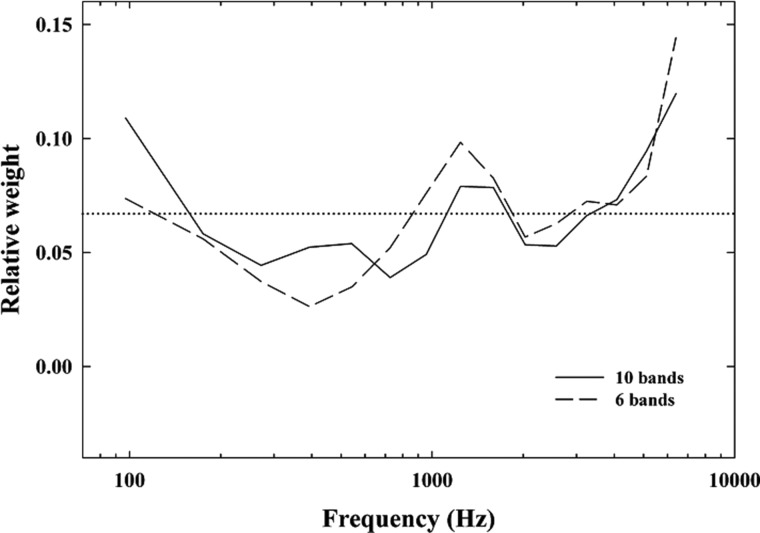
Speech recognition in noise presumably relies on the number and spectral location of available auditory-filter outputs containing a relatively undistorted view of local target signal properties. The purpose of the present study was to estimate the relative weight of each of the 30 auditory-filter wide bands between 80 and 7563 Hz. Because previous approaches were not compatible with this goal, a technique was developed. Similar to the "hole" approach, the weight of a given band was assessed by comparing intelligibility in two conditions differing in only one aspect-the presence or absence of the band of interest. In contrast to the hole approach, however, random gaps were also created in the spectrum. These gaps were introduced to render the auditory system more sensitive to the removal of a single band and their location was randomized to provide a general view of the weight of each band, i.e., irrespective of the location of information elsewhere in the spectrum. Frequency-weighting functions derived using this technique confirmed the main contribution of the 400-2500 Hz frequency region. However, they revealed a complex microstructure, contrasting with the "bell curve" shape typically reported.


Figures

Figure 1
Figure 1
Schematic of two trials designed to assess the weight of a given speech band.
Figure 2
Figure 2
Probability that a given number of bands (n) will appear in a given trial, during the first two experiments.
Figure 3
Figure 3
Averaged differences between percent-correct scores in the present (PRS) and absent (ABS) conditions as a function of band center frequency. Error bars represent the standard error of the mean. The separate groups hearing the odd-numbered bands are represented by circles and those hearing even-numbered bands are represented by squares. Data for vowels (condition V10r) are plotted in the top panel, while data for consonants (condition C10r) are plotted in the bottom panel.
Figure 4
Figure 4
Relative weight as a function of the center frequency of the 1-ERBN band for vowels (solid line) and consonants (long dashes). Data have been normalized so that the sum of all the weights equals 1. Also plotted is the function representing various nonsense syllable tests (NNS) from the Speech Intelligibility Index (short dashes). The horizontal dotted line indicates the average band weight (i.e., 1/30). Note that for the NNS data, the average band weight is 1/21.
Figure 5
Figure 5
The top, middle, and bottom panels display data for the features voicing, manner, and place of articulation, respectively. In each panel, the open squares show the mean percentage of information transmitted as a function of the center frequency of the 1-ERBN band in the ABS condition (left axis). The bars shows the difference between percentage of information transmitted in the PRS and ABS conditions, also as a function of the center frequency of the 1-ERBN band (right axis).
Figure 6
Figure 6
The top and bottom panels display functions based on the odd-numbered and even-numbered bands, respectively. Each panel shows the relative weight as a function of the center frequency of the 1-ERBN band for a fixed number of bands (solid line) or a random number of bands (dashed lines). The black and white line shows data from the first 10 listeners, while the black and grey line shows data from all 20 listeners. Data have been normalized so that the sum of all the weights equals 1. The dotted line indicates the average band weight (i.e., 1/15). Because a separate smoothing was applied to each function, the shapes of these functions differ substantially from that in Fig. 4. Accordingly, prospective users should not refer to these functions for band importance.
Figure 7
Figure 7
Relative weight as a function of the center frequency of the odd-numbered 1-ERBN bands for ten (solid line) or six fixed bands (dashed line). Data have been normalized so that the sum of all the weights equals 1. The dotted line indicates the average band weight (i.e., 1/15).

References

    1. American National Standards Inst. (1969). ANSI S3.5, American National Standard Methods for Calculation of the Articulation Index (American National Standard Inst., New York: ).
    1. American National Standards Inst. (1997). ANSI S3.5 (R2007), American National Standard Methods for Calculation of the Speech Intelligibility Index (American National Standard Inst., New York).
    1. American National Standards Inst. (2004). ANSI S3.6 (R2010), American National Standard Specifications for Audiometers (American National Standard Inst., New York: ).
    1. Apoux, F., and Bacon, S. P. (2004). “ Relative importance of temporal information in various frequency regions for consonant identification in quiet and in noise,” J. Acoust. Soc. Am. 116, 1671–1680. 10.1121/1.1781329 - DOI - PubMed
    1. Apoux, F., and Healy, E. W. (2009). “ On the number of auditory filter ouputs needed to understand speech: Further evidence for auditory channel independence,” Hear. Res. 255, 99–108. 10.1016/j.heares.2009.06.005 - DOI - PMC - PubMed

Publication types