

Estimation of breast percent density in raw and processed full field digital mammography images via adaptive fuzzy c-means clustering and support vector machine segmentation
- PMID: 22894417
- PMCID: PMC3416877
- DOI: 10.1118/1.4736530
Estimation of breast percent density in raw and processed full field digital mammography images via adaptive fuzzy c-means clustering and support vector machine segmentation
Abstract
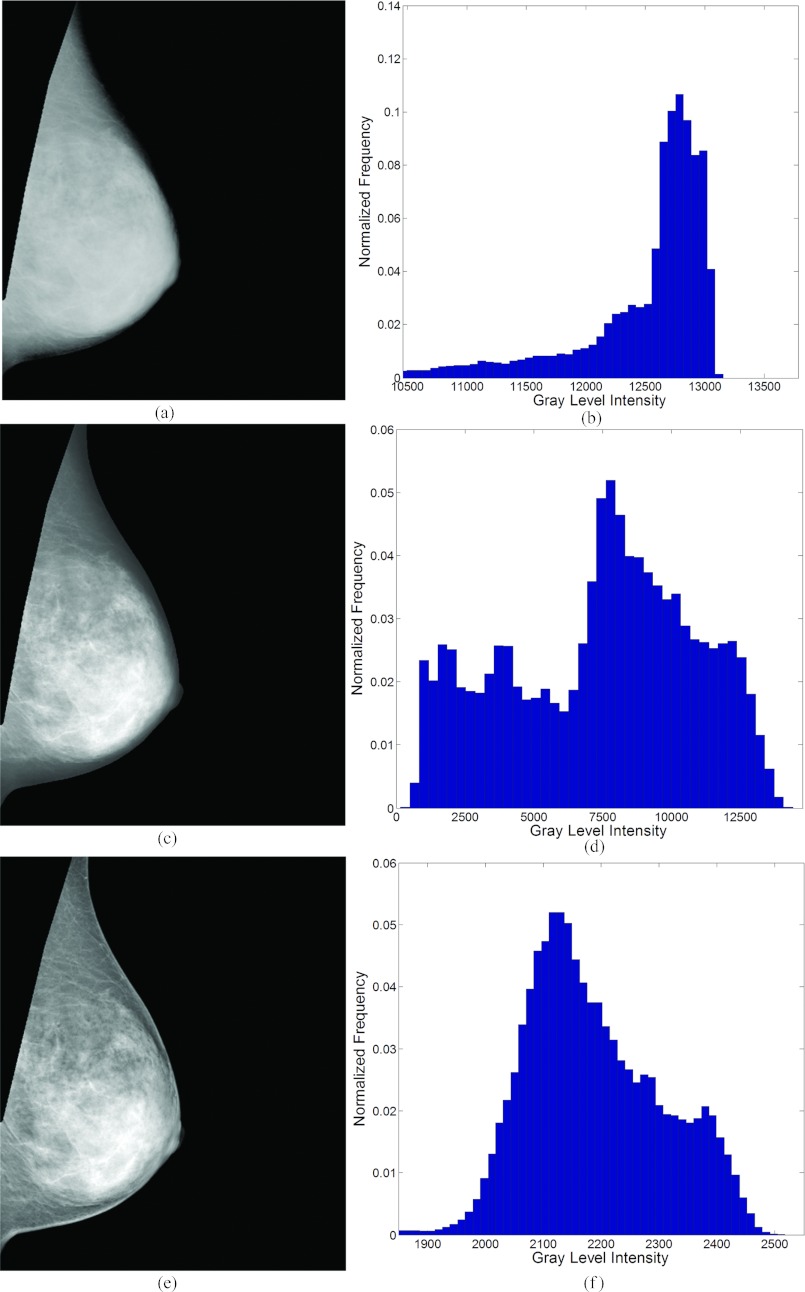
Purpose: The amount of fibroglandular tissue content in the breast as estimated mammographically, commonly referred to as breast percent density (PD%), is one of the most significant risk factors for developing breast cancer. Approaches to quantify breast density commonly focus on either semiautomated methods or visual assessment, both of which are highly subjective. Furthermore, most studies published to date investigating computer-aided assessment of breast PD% have been performed using digitized screen-film mammograms, while digital mammography is increasingly replacing screen-film mammography in breast cancer screening protocols. Digital mammography imaging generates two types of images for analysis, raw (i.e., "FOR PROCESSING") and vendor postprocessed (i.e., "FOR PRESENTATION"), of which postprocessed images are commonly used in clinical practice. Development of an algorithm which effectively estimates breast PD% in both raw and postprocessed digital mammography images would be beneficial in terms of direct clinical application and retrospective analysis.
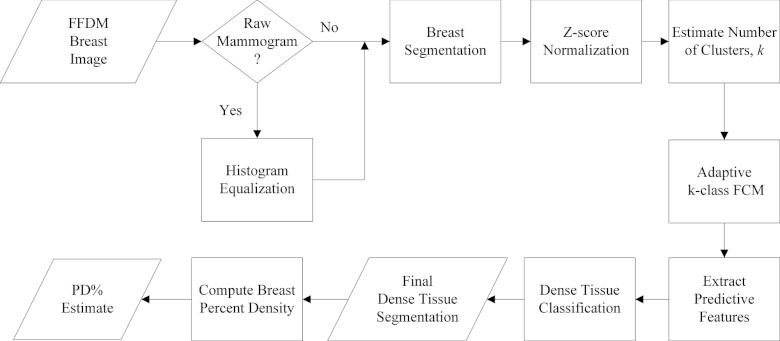
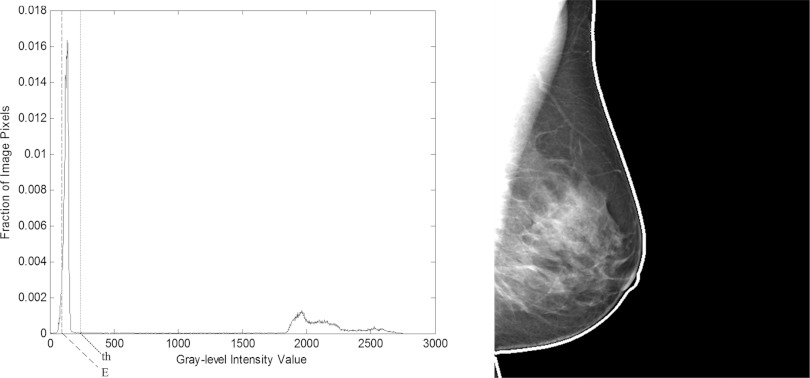
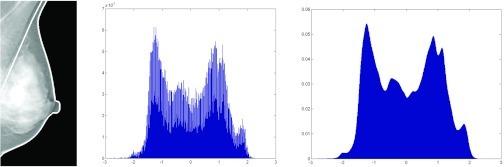
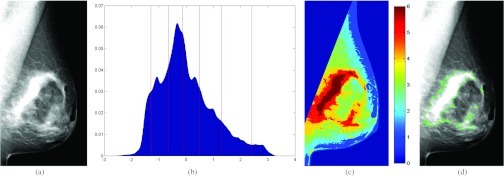
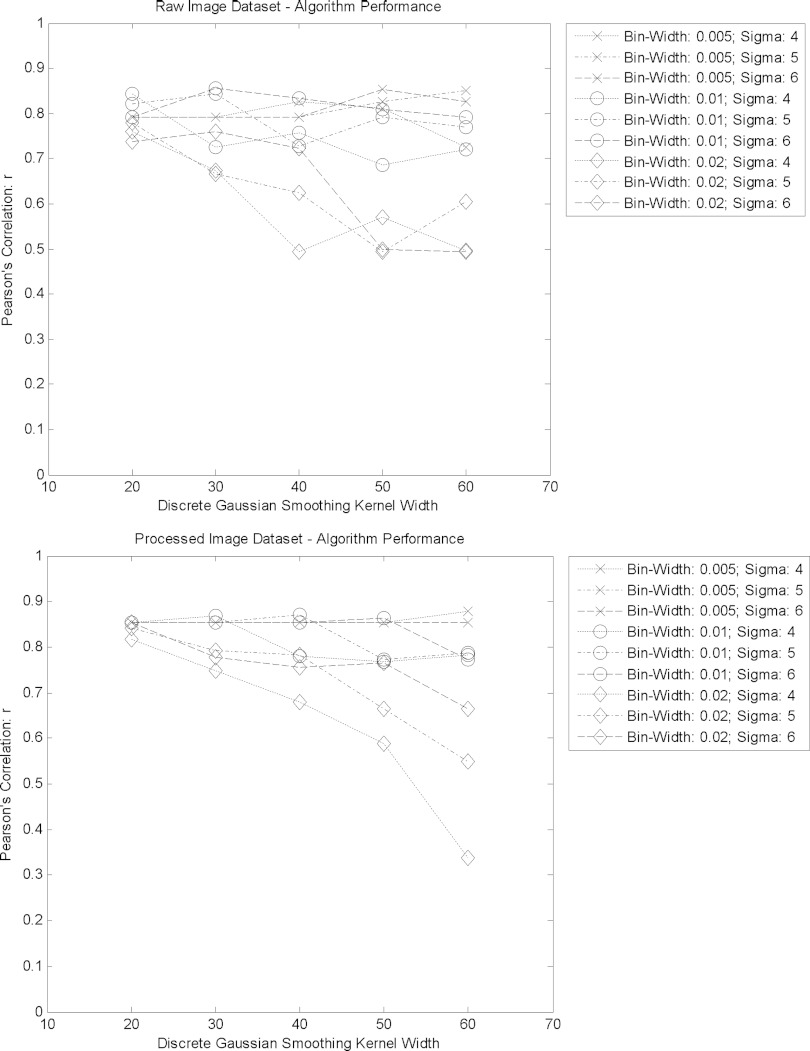
Methods: This work proposes a new algorithm for fully automated quantification of breast PD% based on adaptive multiclass fuzzy c-means (FCM) clustering and support vector machine (SVM) classification, optimized for the imaging characteristics of both raw and processed digital mammography images as well as for individual patient and image characteristics. Our algorithm first delineates the breast region within the mammogram via an automated thresholding scheme to identify background air followed by a straight line Hough transform to extract the pectoral muscle region. The algorithm then applies adaptive FCM clustering based on an optimal number of clusters derived from image properties of the specific mammogram to subdivide the breast into regions of similar gray-level intensity. Finally, a SVM classifier is trained to identify which clusters within the breast tissue are likely fibroglandular, which are then aggregated into a final dense tissue segmentation that is used to compute breast PD%. Our method is validated on a group of 81 women for whom bilateral, mediolateral oblique, raw and processed screening digital mammograms were available, and agreement is assessed with both continuous and categorical density estimates made by a trained breast-imaging radiologist.
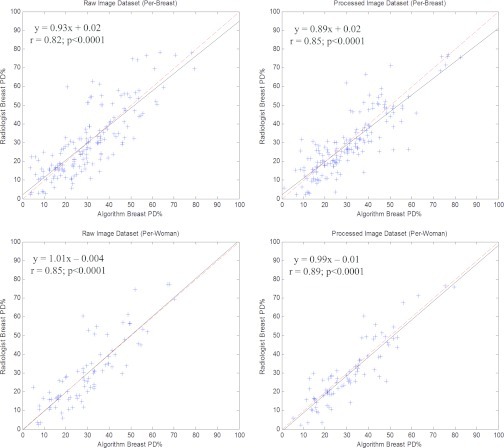
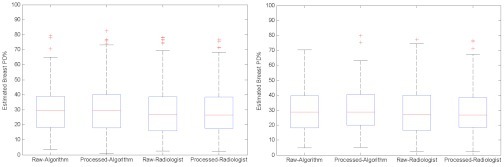
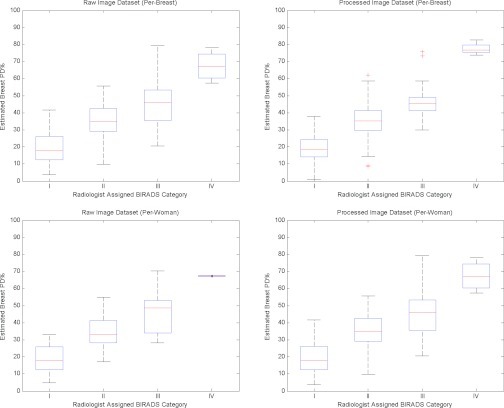
Results: Strong association between algorithm-estimated and radiologist-provided breast PD% was detected for both raw (r = 0.82, p < 0.001) and processed (r = 0.85, p < 0.001) digital mammograms on a per-breast basis. Stronger agreement was found when overall breast density was assessed on a per-woman basis for both raw (r = 0.85, p < 0.001) and processed (0.89, p < 0.001) mammograms. Strong agreement between categorical density estimates was also seen (weighted Cohen's κ ≥ 0.79). Repeated measures analysis of variance demonstrated no statistically significant differences between the PD% estimates (p > 0.1) due to either presentation of the image (raw vs processed) or method of PD% assessment (radiologist vs algorithm).
Conclusions: The proposed fully automated algorithm was successful in estimating breast percent density from both raw and processed digital mammographic images. Accurate assessment of a woman's breast density is critical in order for the estimate to be incorporated into risk assessment models. These results show promise for the clinical application of the algorithm in quantifying breast density in a repeatable manner, both at time of imaging as well as in retrospective studies.
Figures
References
-
- Gail M. H., Brinton L. A., Byar D. P., Corle D. K., Green S. B., Schairer C., and Mulvihill J. J., “Projecting individualized probabilities of developing breast cancer for white females who are being examined annually,” J. Natl. Cancer Inst. 81, 1879–1886 (1989). 10.1093/jnci/81.24.1879 - DOI - PubMed
-
- Lehman C. D., Blume J. D., Weatherall P., Thickman D., Hylton N., Warner E., Pisano E., Schnitt S. J., Gatsonis C., Schnall M., DeAngelis G. A., Stomper P., Rosen E. L., O’Loughlin M., Harms S., and Bluemke D. A., “Screening women at high risk for breast cancer with mammography and magnetic resonance imaging,” Cancer 103, 1898–1905 (2005). 10.1002/cncr.20971 - DOI - PubMed
-
- Lehman C. D., Isaacs C., Schnall M. D., Pisano E. D., Ascher S. M., Weatherall P. T., Bluemke D. A., Bowen D. J., Marcom P. K., Armstrong D. K., Domchek S. M., Tomlinson G., Skates S. J., and Gatsonis C., “Cancer yield of mammography, MR, and US in high-risk women: prospective multi-institution breast cancer screening study,” Radiology 244, 381–388 (2007). 10.1148/radiol.2442060461 - DOI - PubMed
Publication types
MeSH terms
Grants and funding
LinkOut - more resources
Full Text Sources
Other Literature Sources
Medical
